. 2014 Jan 27;28(2):117-31.
doi: 10.1016/j.devcel.2013.11.023. Epub 2014 Jan 9.

Ankyrin-G directly binds to kinesin-1 to transport voltage-gated Na+ channels into axons

Affiliations

Ankyrin-G directly binds to kinesin-1 to transport voltage-gated Na+ channels into axons

Joshua Barry et al. Dev Cell. .

Abstract

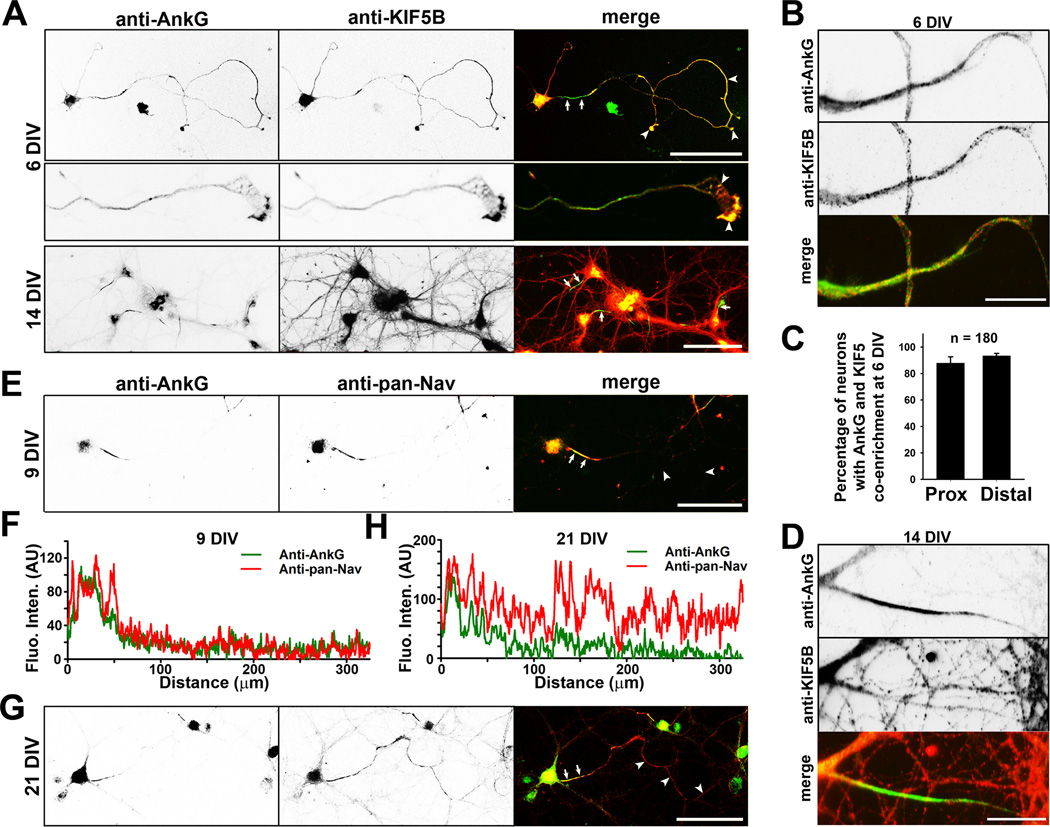
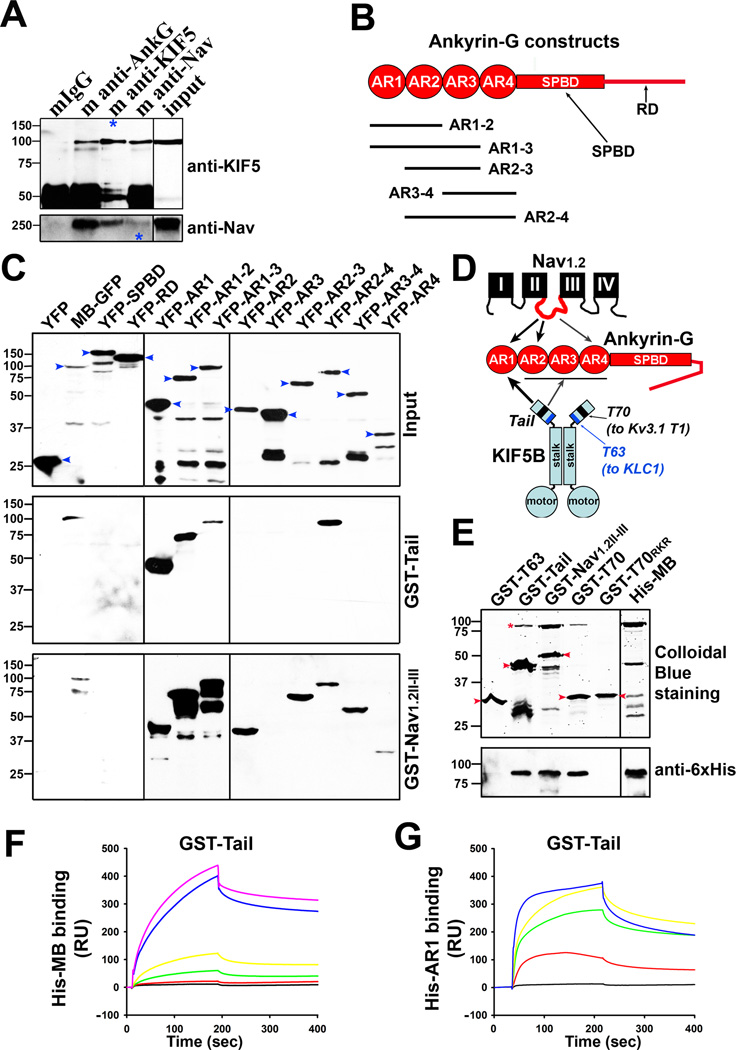
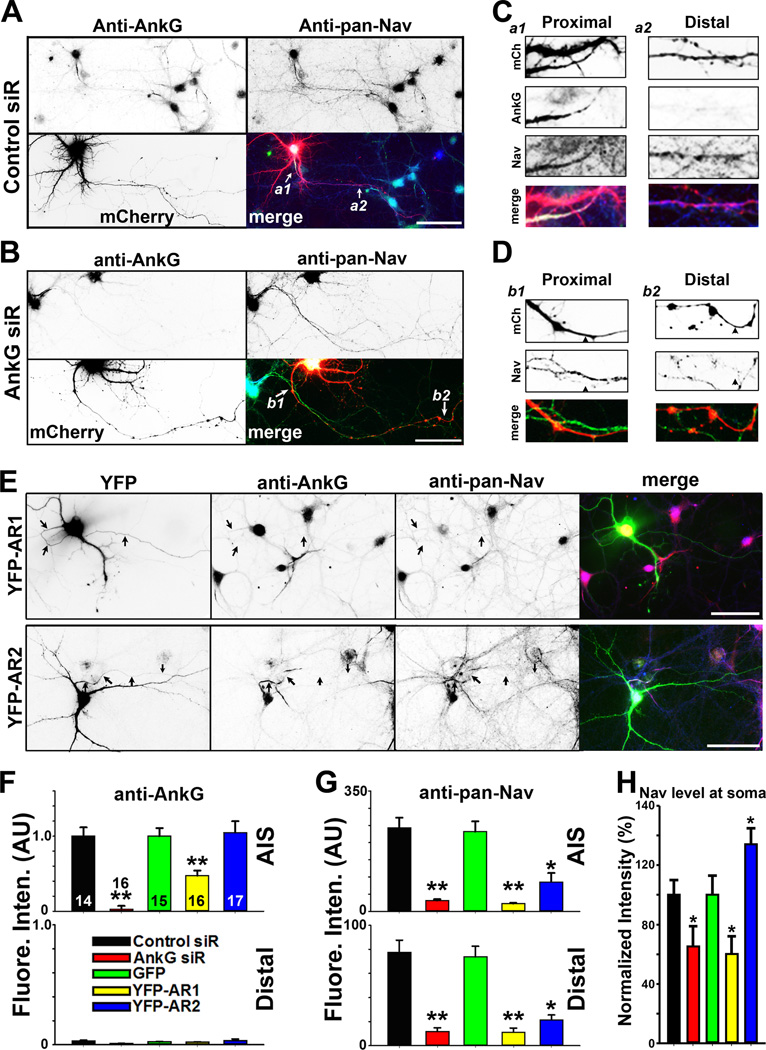
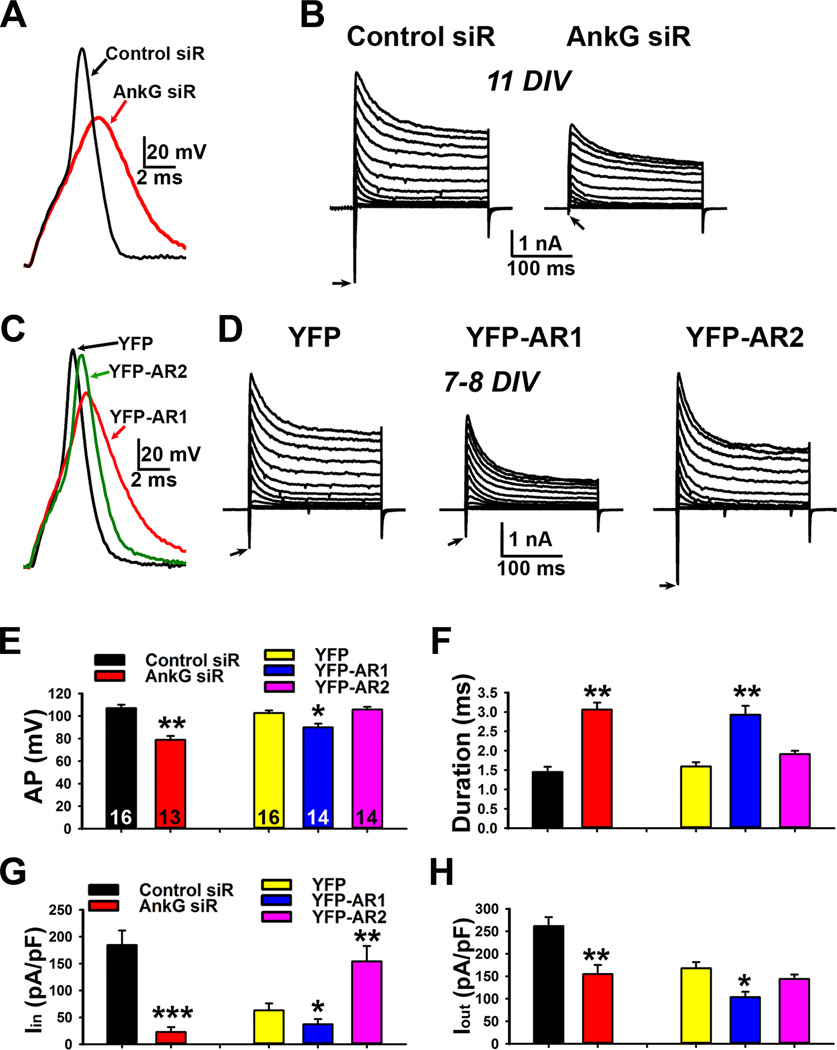
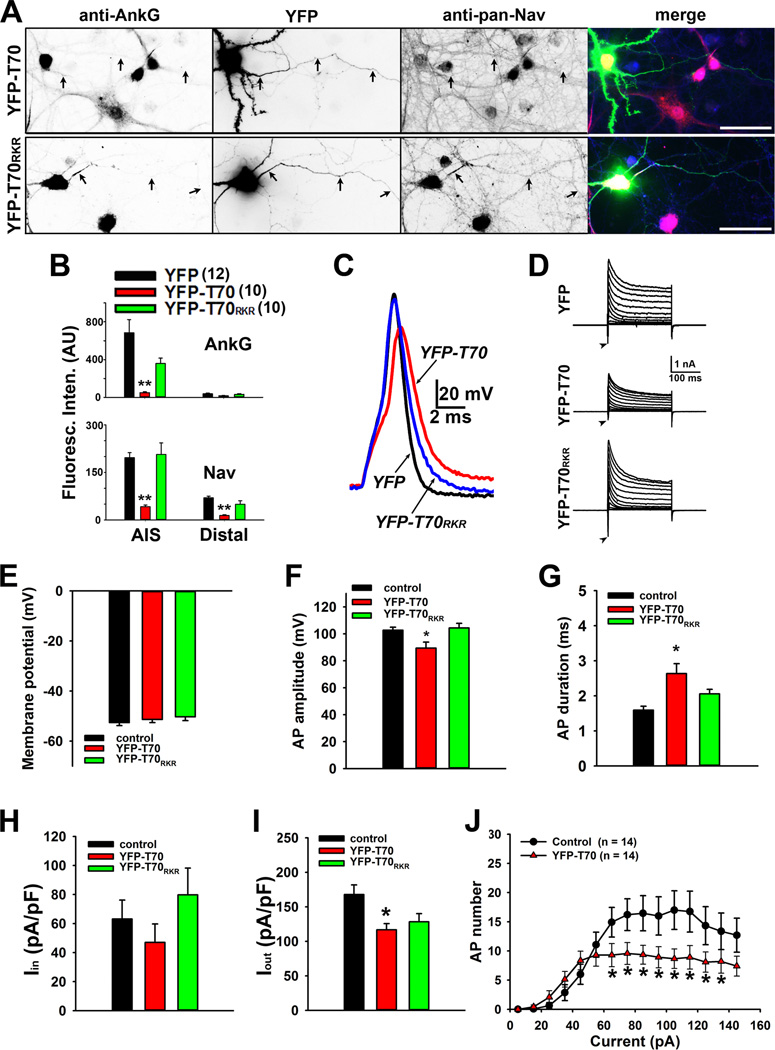
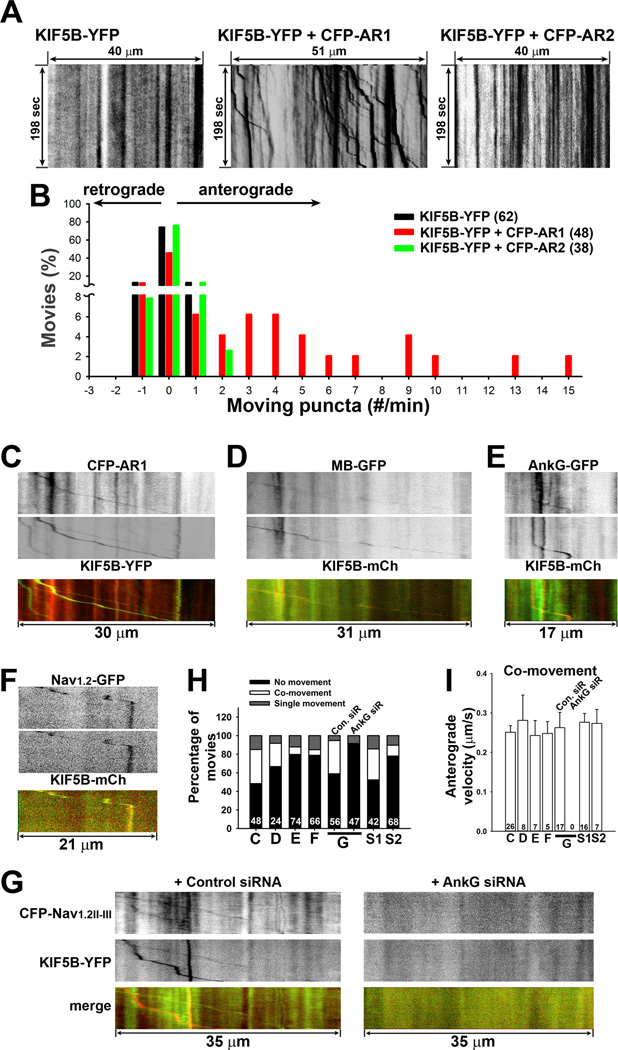
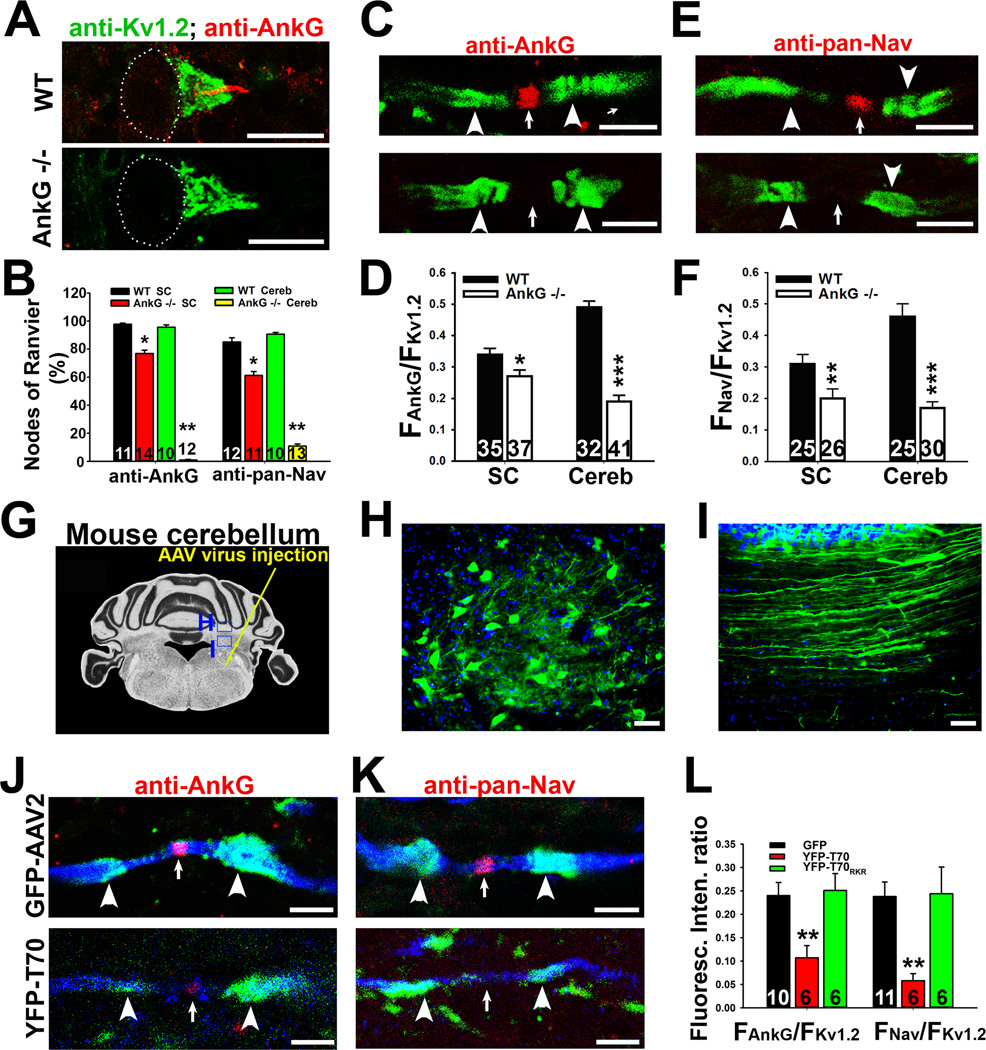
Action potentials (APs) propagating along axons require the activation of voltage-gated Na(+) (Nav) channels. How Nav channels are transported into axons is unknown. We show that KIF5/kinesin-1 directly binds to ankyrin-G (AnkG) to transport Nav channels into axons. KIF5 and Nav1.2 channels bind to multiple sites in the AnkG N-terminal domain that contains 24 ankyrin repeats. Disrupting AnkG-KIF5 binding with small interfering RNA or dominant-negative constructs markedly reduced Nav channel levels at the axon initial segment (AIS) and along entire axons, thereby decreasing AP firing. Live-cell imaging showed that fluorescently tagged AnkG or Nav1.2 cotransported with KIF5 along axons. Deleting AnkG in vivo or virus-mediated expression of a dominant-negative KIF5 construct specifically decreased the axonal level of Nav, but not Kv1.2, channels in mouse cerebellum. These results indicate that AnkG functions as an adaptor to link Nav channels to KIF5 during axonal transport before anchoring them to the AIS and nodes of Ranvier.


Figures

Figure 1
Figure 1. Development-dependent colocalization of AnkG, KIF5B and Nav channels along axons
Hippocampal neurons cultured from rat E18 embryos were fixed and stained at different developmental stages. A, Development-dependent colocalization of KIF5B (red in merged) and AnkG (green in merged) in neurons. Signals are inverted in gray scale images. KIF5B and AnkG colocalized in an axonal growth cone (middle, 3-fold higher magnification compared to the top). B, High magnification images show colocalization of AnkG and KIF5B in proximal axons of neurons at 6 DIV. C, Summary of percentage of neurons with the co-enrichment of AnkG and KIF5B in the proximal (left) and distal (right) axons. D, High magnification images show the AnkG and KIF5B staining in the proximal axon from a neuron at 14 DIV. E, Colocalization of AnkG (green in merged) and pan-Nav channels (red in merged) in hippocampal neurons at 9 DIV. The anti-pan-Nav channel antibodies were used throughout this study. F, Fluorescence intensities of AnkG (green) and pan-Nav channels (red) along the axon in E. G, Colocalization of AnkG (green) and pan-Nav channels (red) in hippocampal neurons at 21 DIV. H, Fluorescence intensities along the axon in G. Arrows, proximal axons including the AIS; Arrowheads, distal axons. Scale bars, 100 µm in A,E,G; 25 µm in B,D. See also Figure S1.
Figure 2
Figure 2. Novel direct binding between AnkG and KIF5
A,, AnkG and Nav channel interacted with KIF5 in brain lysates from mouse pups (postnatal day 7 to 21). Blue asterisks, 10% of KIF5 (H2) pulldown was loaded (top); 5% of Nav channel pulldown was loaded (bottom). 5% was loaded for both inputs. B, Diagram of AnkG domains and YFP fusion constructs. AR, ankyrin repeat; SPBD, spectrin-binding domain; RD, regulatory domain. C, Identifying the KIF5- and Nav-channel-binding sites within AnkG. Both GST-Nav1.2II–III and GST-Tail pulled down the N-terminal MB domain (membrane-binding domain containing 24 ankyrin repeats), but not SPBD and C-terminal RD. GST-Tail and GST-Nav1.2II–III differ in binding to different ankyrin repeat clusters within the MB domain. YFP-fusion proteins expressed in HEK293 cells (inputs on the top) were pulled down by purified GST-Tail (middle) or GST-Nav1.2II–III (bottom), revealed in Western blotting with an anti-GFP antibody. Molecular weights are indicated on the left. Blue arrowheads, full-length YFP-fusion proteins. D, Diagram shows different binding sites of KIF5 and Nav1.2 in the MB domain of AnkG. The T63 (aa 758–820) and T70 (aa 865–934) regions in KIF5B tail bind to KLC1 and Kv3.1 T1 domain, respectively. E, The T70 region binds to the AnkG N-terminus. The pulldown assay was performed with purified proteins and shown with Colloidal Blue staining for proteins (top) and confirmed with Western blotting with an anti-6×His antibody (bottom). The bands of full-length GST-fusion proteins are indicated with red arrowheads. The full-length His-MB bands are indicated with a red asterisk. There were smaller degradation bands for some proteins. GST-Nav1.2II–III had a weak band near the position of His-MB. F, SPR response curves in measuring the binding affinity between GST-Tail and His-MB. His-MB concentrations (µM): 0, 0.001, 0.005, 0.01, 0.05, and 0.1. G, SPR response curves in measuring the binding affinity between GST-Tail and His-AR1. His-AR1 concentrations (µM): 0, 0.053, 0.265, 0.53, and 1.59. See also Figure S2.
Figure 3
Figure 3. Disrupting AnkG-KIF5 interaction suppresses axonal targeting of Nav channels
A, Control siRNA had no effect on endogenous AnkG and Nav channels along axons. Hippocampal neurons were transfected with control siRNA at 5 DIV, fixed and stained at 21 DIV. Signals are inverted in gray-scale images. In merged image: anti-AnkG, blue; anti-pan-Nav, green; mCherry from the siRNA vector, red. White arrows, proximal and distal axons. B, Knocking down AnkG with siRNA reduced the overall Nav channel level along the entire axon. C, Two enlarged areas (3 fold) in A. a1, proximal axon; a2, middle-distal axon. D, Two enlarged areas (3 fold) in B. b1, proximal axons; b2, distal axons. Black arrowheads, axons with AnkG siRNA. E, YFP-AR1, but not YFP-AR2, reduced AnkG (red in merged) and Nav channel (blue in merged) levels at the AIS. Hippocampal neurons were transfected at 12 DIV, fixed and stained at 17 DIV. In single images, signals are inverted. Black arrows, proximal axons. Scale bars, 100 µm. F, Summary of the effect of siRNA knock down of endogenous AnkG and over-expression of YFP-AR1 and YFP-AR2 (transfected on 12 DIV and fixed on 17 DIV) on endogenous AnkG along axons. Fluorescence intensities were normalized with Control siRNA or GFP. G, Summary of the effect on endogenous Nav channels along axons. H, Normalized fluorescence intensity of the anti-pan-Nav staining at the soma of the neurons. The "n" number is indicated in each column in the upper panel of F. Unpaired t-test was used for the siRNA experiments and One-Way ANOVA followed by Dunnett's test was used for the experiments of YFP-AR1 and YFPAR2. *, p < 0.05; **, p < 0.01. See also Figure S3.
Figure 4
Figure 4. Knocking down AnkG or over-expression of AnkG dominant-negative fragments differentially changes action potential firing by altering inward and outward currents
A, Effects of knocking down AnkG on the action potential waveform recorded with current clamp. B, Effects of knocking down AnkG on inward (downward) and outward currents recorded with voltage clamp. Neurons were transfected with siRNA plasmids at 5 DIV and recorded at 11 DIV. C, Differential effects of expressing YFP-AR1 and YFP-AR2 on action potential firing recorded with current clamp. Neurons were transfected at 5 DIV and recorded at 7–8 DIV. D, Effects of YFP-AR1 and YFP-AR2 on inward and outward currents recorded with voltage clamp. E, Summary of the effects on AP amplitude (AP in mV). F, Summary of the effects on AP duration (ms). G, Summary of the effects on inward current density (Iin). H, Summary of the effects on outward current density (Iout). The "n" number is indicated in each column in E. An unpaired t-test was used for the siRNA experiments and One-Way ANOVA followed by Dunnett's test was used for the experiments of YFP-AR1 and YFP-AR2. *, p < 0.05; **, p < 0.01; ***, p < 0.001. See also Figure S4.
Figure 5
Figure 5. Disruption of AnkG-KIF5 binding by expression of the KIF5 tail fragment reduces axonal targeting of Nav channels and action potential firing
A, YFP-T70 but not YFP-T70RKR reduces the endogenous levels of AnkG and Nav channels along axons. Black arrows, proximal and distal axons. In merged images: YFP in green, anti-AnkG in red, and anti-pan-Nav in blue. Scale bars, 100 µm. B, Summary of fluorescence intensities of AnkG (top) and Nav channel (bottom) in the AIS and distal axons of neurons expressing either YFP, YFP-T70, or YFP-T70RKR. The "n"s numbers are provided on the top. C, A single action potential induced in the presence of YFP (black), YFP-T70 (red) and YFP-T70RKR (blue) with expanded time scale. D, Voltage-clamp recording of inward and outward currents corresponding to the action potential traces in C. E, The resting membrane potential did not change. F, YFP-T70, but not YFP and YFP-T70RKR, reduced AP amplitude. G, YFP-T70 significantly increased AP duration. H, The inward current remained same. I, YFP-T70 reduced the outward current. J, The input-output relationship significantly reduced in YFP-T70- expressing neurons. 1000-ms duration currents of increasing amplitude (from 5 to 145 pA with increments of 10 pA) were injected into the soma to induce APs. The "n" numbers for electrophysiology experiments are provided in J. One way ANOVA followed by Dunnett's test was used in B, E–I, and an unpaired t-test was used in J. *, p < 0.01; **, p < 0.001. See also Figure S5.
Figure 6
Figure 6. Co-transport of AnkG, Nav1.2 and KIF5B along axons
Hippocampal neurons were transfected at 5 DIV and imaged 2–3 days later. A, CFP-AR1 but not CFP-AR2 increased the anterograde transport of KIF5B-YFP, indicated by kymographs of KIF5B-YFP puncta along axonal segments alone (left), or in the presence of CFP-AR1 (middle) or CFP-AR2 (right). B, Frequency of axonal transport of KIF5B-YFP puncta under 3 different conditions in A. C, Kymograph of anterograde co-transport of CFP-AR1 (red in merged) and KIF5B-YFP (green in merged). D, Kymograph of anterograde co-transport of MB-GFP (green in merged) and KIF5B-mCh (red in merged). E, Kymograph of anterograde co-transport of AnkG-GFP (green in merged) and KIF5B-mCh (red in merged), preincubated with 2.5 µM Latrunculin A at 37°C for 2 hrs. F, Kymograph of anterograde co-transport of Nav1.2-GFP (green in merged) and KIF5B-mCh (red in merged). G, Kymographs of co-movement of CFP-Nav1.2II–III (green in merged) and KIF5B-YFP (red in merged) in the presence of control siRNA (left) or AnkG siRNA (right). H, Percentage of anterograde and retrograde co-moving puncta (C: CFP-AR1 + KIF5B-YFP; D: MB-GFP + KIF5B-mCh; E: AnkG-GFP + KIF5B-mCh; F: Nav1.2-GFP + KIF5B-mCh; G: CFP-Nav1.2II–III + KIF5B-YFP; S1: CFP-Nav1.2II–III + YFP-AR1; S2: CFP-AR1 + Nav1.2-YFP). The movie number is provided for each bar. The time length was 198 sec for all kymographs and the distance is provided for each one. I, Average anterograde velocity of co-moving puncta in different conditions. The puncta number is provided for each bar. See also Figure S6.
Figure 7
Figure 7. AnkG deletion or disruption of AnkG-KIF5 binding by expressing a KIF5B tail fragment reduces the axonal level of Nav channels in vivo
Costaining of Kv1.2 and AnkG (or Nav channels) was performed on coronal sections of mouse cerebellum. A, Confocal images of AnkG (red) and Kv1.2 (green) co-staining at the AIS of Purkinje neurons in WT (top) and AnkG −/− (bottom) mice. White dots indicate the soma of Purkinje neurons. B, Summary of the percentage of nodes of Ranvier with AnkG and Nav channel staining in WT and AnkG −/− mice in the cerebellum (Cereb) and spinal cord (SC). The nodal regions were defined by a pair of JXP Kv1.2 clusters. C, High magnification confocal images of AnkG (red) and Kv1.2 (green) staining in cerebellar white matter myelinated axons of WT (top) and AnkG −/− (bottom) mice. D, Summary of the ratio of AnkG and Kv1.2 staining fluorescence along the axonal segment. E, High magnification confocal images of pan-Nav (red) and Kv1.2 (green) staining in cerebellar white matter myelinated axons of WT (top) and AnkG −/− (bottom) mice. F, Summary of the ratio of pan-Nav and Kv1.2 staining fluorescence intensities. G, Diagram for AAV virus injection into mouse cerebellum. H, Neurons in cerebellar nuclei expressing AAV-GFP. I, Axons expressing AAV-GFP in cerebellum white matter. J, Axons expressing either GFP (top, blue) or YFP-T70 (bottom, blue) were co-stained for endogenous AnkG (red) and Kv1.2 (green). K, Axons expressing either GFP (top, blue) or YFP-T70 (bottom, blue) were co-stained for endogenous pan-Nav (red) and Kv1.2 (green) channels. L, Summary of the effect of AAV-mediated expression of dominant-negative construct of KIF5B tail domain. White arrowheads, JXP region; White arrows, nodes of Ranvier. Scale bars, 200 µm in H,I; 50 µm in A; 10 µm in C,E,J,K. An unpaired t-test was used in B,D,F; One way ANOVA followed by Dunnett's test was used in L. *, p < 0.05; **, p < 0.01; ***, p < 0.001. See also Figure S7.

References

    1. Armstrong CM, Hille B. Voltage-gated ion channels and electrical excitability. Neuron. 1998;20:371–380. - PubMed
    1. Asbury CL, Fehr AN, Block SM. Kinesin moves by an asymmetric hand-over-hand mechanism. Science. 2003;302:2130–2134. - PMC - PubMed
    1. Barry J, Xu M, Gu Y, Dangel W, Jukkola P, Shrestha C, Gu C. Activation of Conventional Kinesin Motors in Clusters by Shaw Voltage-Gated Potassium Channels. J Cell Sci. 2013;126:2027–2041. - PMC - PubMed
    1. Barry J, Gu C. Coupling mechanical forces to electrical signaling: molecular motors and intracellular transport of ion channels. Neuroscientist. 2013;19:145–159. - PMC - PubMed
    1. Bennett V, Baines AJ. Spectrin and ankyrin-based pathways: metazoan inventions for integrating cells into tissues. Physiol Rev. 2001;81:1353–1392. - PubMed

Publication types

MeSH terms