

Reduced Na⁺ current density underlies impaired propagation in the diabetic rabbit ventricle
- PMID: 24412579
- PMCID: PMC4066653
- DOI: 10.1016/j.yjmcc.2013.12.031
Reduced Na⁺ current density underlies impaired propagation in the diabetic rabbit ventricle
Abstract
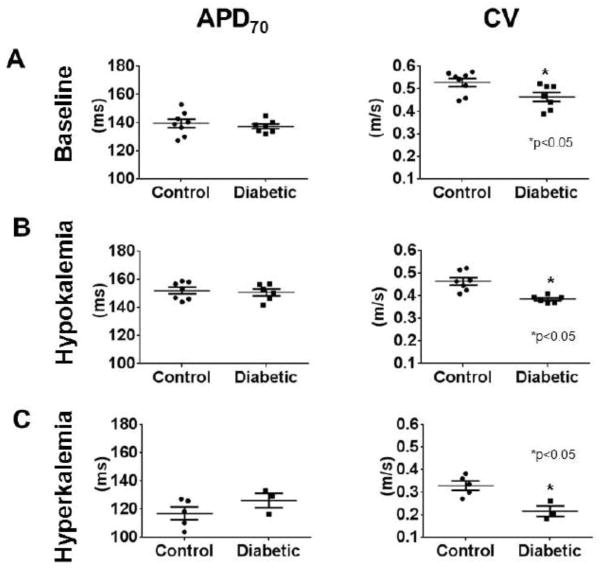
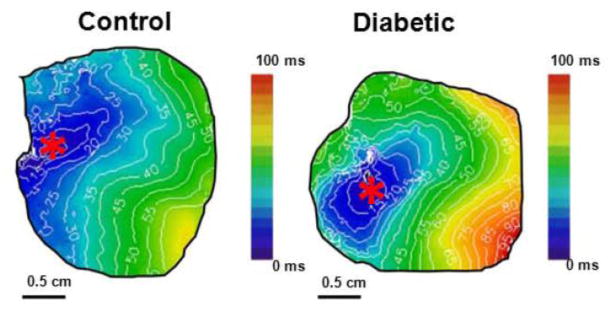
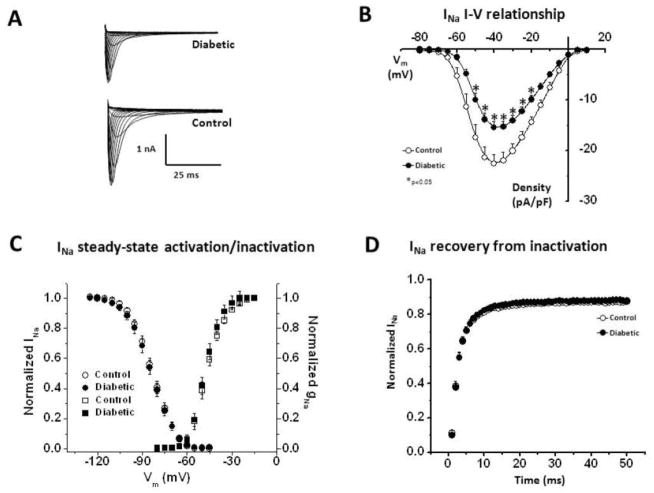
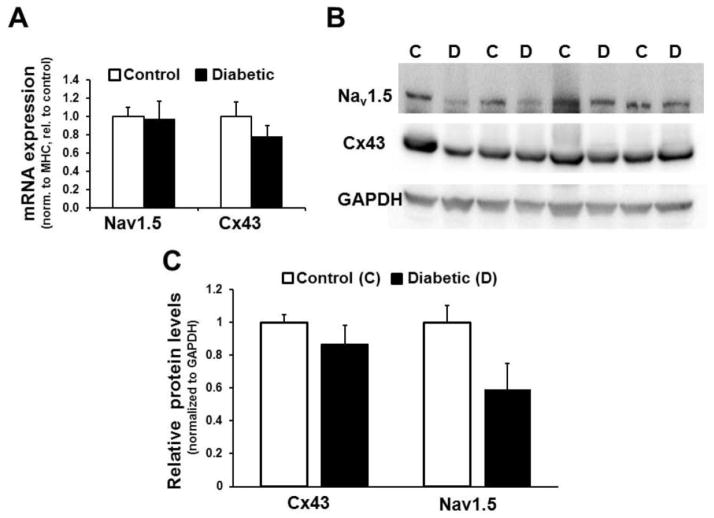
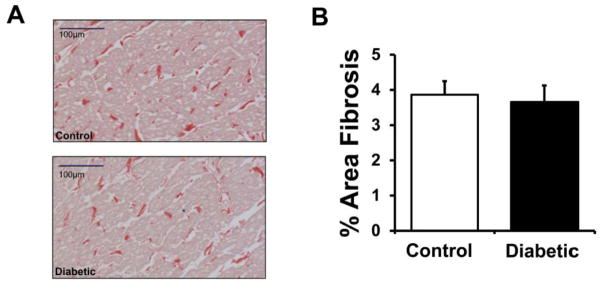
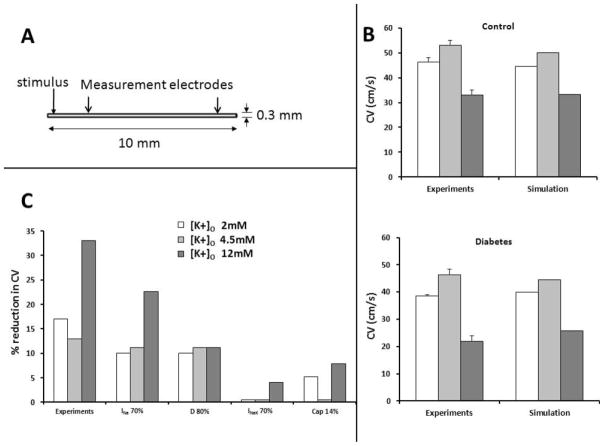
Diabetes is associated with an increased risk of sudden cardiac death, but the underlying mechanisms remain unclear. Our goal was to investigate changes occurring in the action potential duration (APD) and conduction velocity (CV) in the diabetic rabbit ventricle, and delineate the principal ionic determinants. A rabbit model of alloxan-induced diabetes was utilized. Optical imaging was used to record electrical activity in isolated Langendorff-perfused hearts in normo-, hypo- and hyper-kalemia ([K(+)]o=4, 2, 12 mM respectively). Patch clamp experiments were conducted to record Na(+) current (I(Na)) in isolated ventricular myocytes. The mRNA/protein expression levels for Nav1.5 (the α-subunit of I(Na)) and connexin-43 (Cx43), as well as fibrosis levels were examined. Computer simulations were performed to interpret experimental data. We found that the APD was not different, but the CV was significantly reduced in diabetic hearts in normo-, hypo-, and, hyper-kalemic conditions (13%, 17% and 33% reduction in diabetic vs. control, respectively). The cell capacitance (Cm) was increased (by ~14%), and the density of INa was reduced by ~32% in diabetic compared to control hearts, but the other biophysical properties of I(Na) were unaltered. The mRNA/protein expression levels for Cx43 were unaltered. For Nav1.5, the mRNA expression was not changed, and though the protein level tended to be less in diabetic hearts, this reduction was not statistically significant. Staining showed no difference in fibrosis levels between the control and diabetic ventricles. Computer simulations showed that the reduced magnitude of I(Na) was a key determinant of impaired propagation in the diabetic ventricle, which may have important implications for arrhythmogenesis.
Keywords: Diabetes rabbit cardiac electrophysiology Na(+)-current.
Copyright © 2014 Elsevier Ltd. All rights reserved.
Figures
References
-
- Centers for disease control and prevention. National diabetes fact sheet: National estimates and general information on diabetes and prediabetes in the united states, 2011. Atlanta, GA: U.S. Department of health and human services, centers for disease control and prevention; 2011.
-
- Dillmann WH. Diabetes and thyroid-hormone-induced changes in cardiac function and their molecular basis. Annu Rev Med. 1989;40:373–394. - PubMed
-
- El-Atat FA, McFarlane SI, Sowers JR, Bigger JT. Sudden cardiac death in patients with diabetes. Curr Diab Rep. 2004;4:187–193. - PubMed
-
- Bergner DW, Goldberger JJ. Diabetes mellitus and sudden cardiac death: what are the data? Cardiol J. 2010;17(2):117–29. Review. - PubMed
Publication types
MeSH terms
Substances
Grants and funding
LinkOut - more resources
Full Text Sources
Other Literature Sources
