. 2014 Jan 16;40(1):66-77.
doi: 10.1016/j.immuni.2013.11.020. Epub 2014 Jan 9.

Transmigrating neutrophils shape the mucosal microenvironment through localized oxygen depletion to influence resolution of inflammation

Affiliations

Transmigrating neutrophils shape the mucosal microenvironment through localized oxygen depletion to influence resolution of inflammation

Eric L Campbell et al. Immunity. .

Abstract

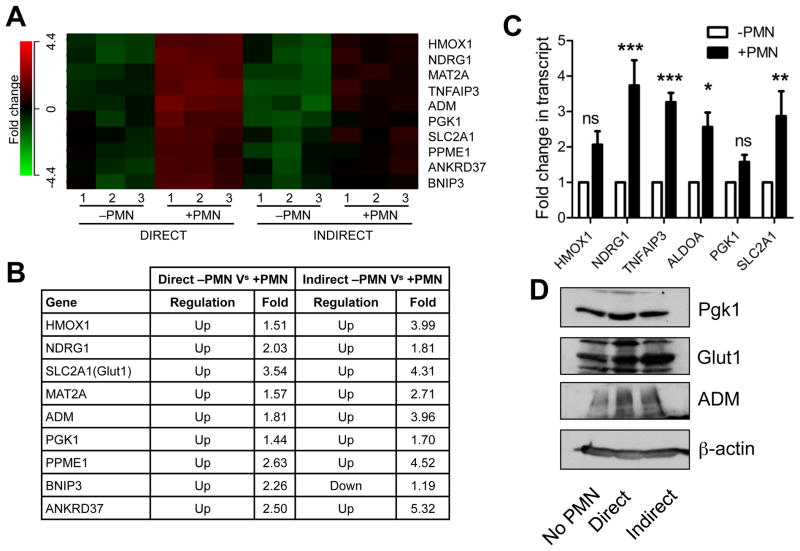
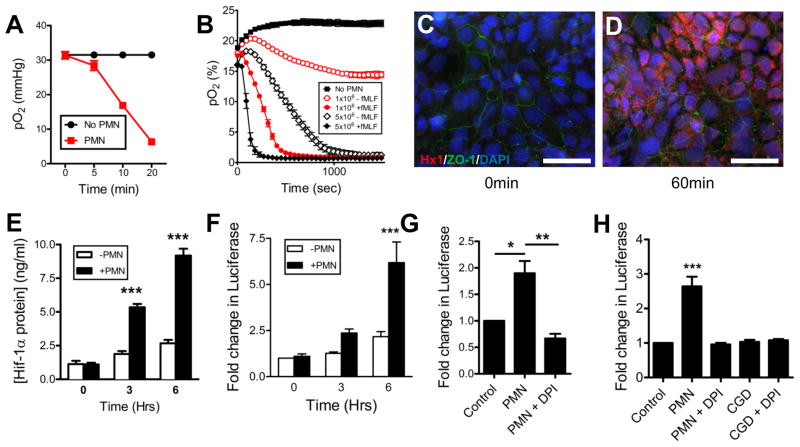
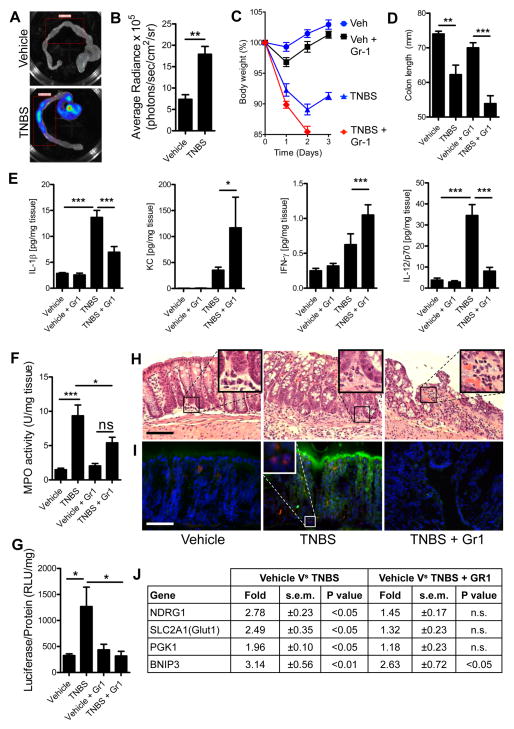
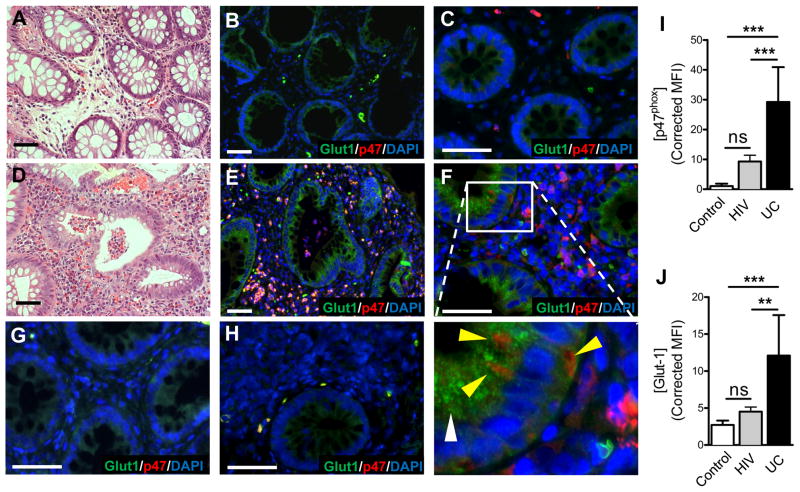
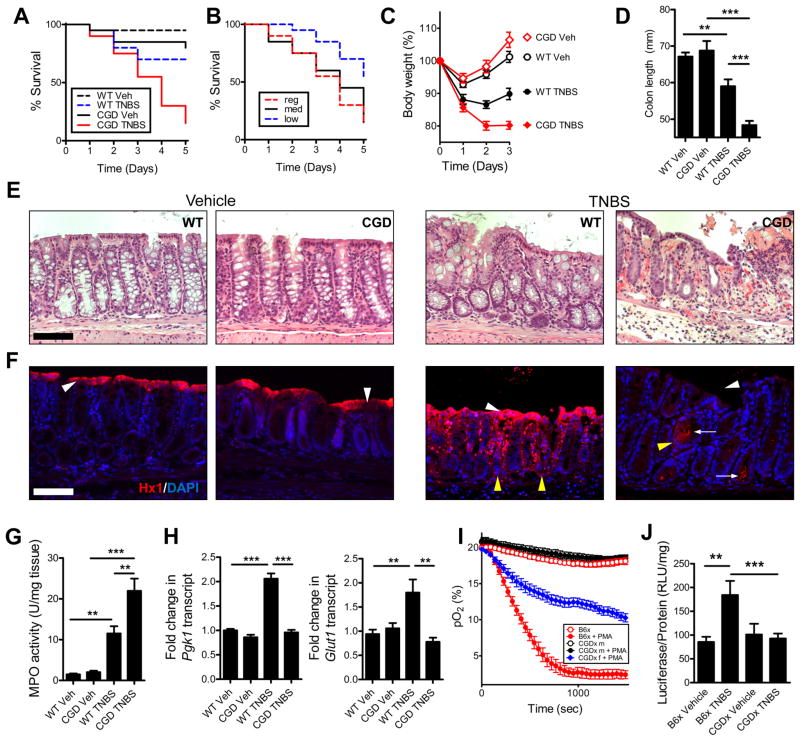
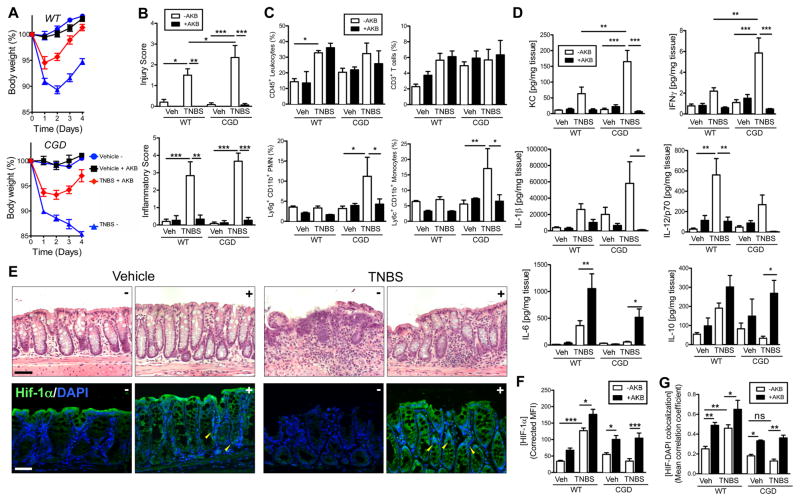
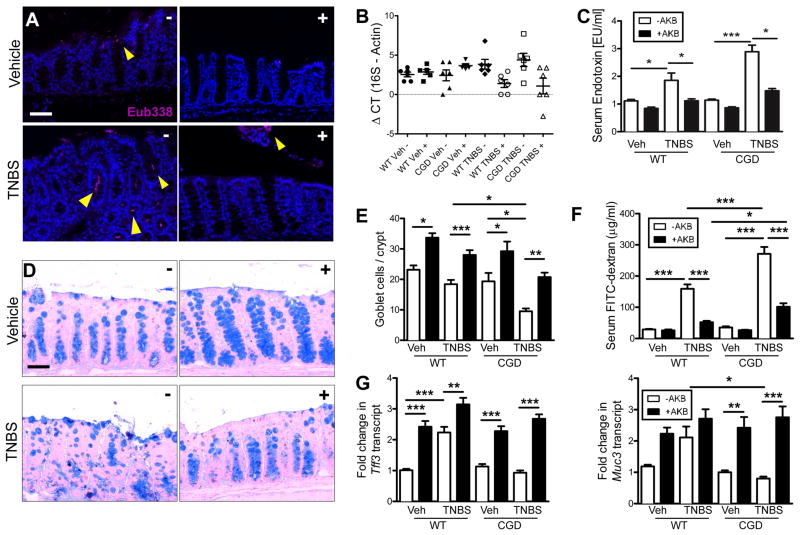
Acute intestinal inflammation involves early accumulation of neutrophils (PMNs) followed by either resolution or progression to chronic inflammation. Based on recent evidence that mucosal metabolism influences disease outcomes, we hypothesized that transmigrating PMNs influence the transcriptional profile of the surrounding mucosa. Microarray studies revealed a cohort of hypoxia-responsive genes regulated by PMN-epithelial crosstalk. Transmigrating PMNs rapidly depleted microenvironmental O2 sufficiently to stabilize intestinal epithelial cell hypoxia-inducible factor (HIF). By utilizing HIF reporter mice in an acute colitis model, we investigated the relative contribution of PMNs and the respiratory burst to "inflammatory hypoxia" in vivo. CGD mice, lacking a respiratory burst, developed accentuated colitis compared to control, with exaggerated PMN infiltration and diminished inflammatory hypoxia. Finally, pharmacological HIF stabilization within the mucosa protected CGD mice from severe colitis. In conclusion, transcriptional imprinting by infiltrating neutrophils modulates the host response to inflammation, via localized O2 depletion, resulting in microenvironmental hypoxia and effective inflammatory resolution.


Figures

Figure 1
Figure 1. Transmigrating neutrophils induce transcriptional imprinting in intestinal epithelial cells
(A) Microarrays were hybridized with cDNA synthesized from epithelial RNA isolated from “Direct” versus “Indirect” transmigration experiments. Three separate experiments were performed and (n = 3). (B) Table highlighting fold changes between groups. Statistical cutoff was set to P < 0.05. (C) Validation of hypoxia-responsive gene cluster by qPCR in the “Indirect” model. Values are means ± SEM and are pooled from three independent experiments (n = 3; *, P < 0.05; **, P < 0.01; ***, P < 0.001; two-way ANOVA). (D) Validation of hypoxia-responsive target induction by immunoblotting for GLUT1, PGK1 and ADM. β-actin used as loading control. Images are representative of three independent experiments. See also Figure S1.
Figure 2
Figure 2. Activated neutrophils rapidly deplete O2 and induce HIF-1α stabilization via respiratory burst
(A) pO2 values were recorded in hypoxia chamber set to 4% O2, using a OxoProbe at indicated time points in the presence of 1×10⁶ PMN, activated with fMLF. Data are representative of three independent experiments and presented as means ± SD (n = 3; P < 0.001; two-way ANOVA). (B) Consumption of dissolved O2 in normoxia was monitored in real-time using OxoDishes mounted on an SDR O2 sensor reader in the presence of increasing numbers of PMN ± activation with fMLF set up with the “SDR real-time O2” (see Figure S1d) model. Data is representative of three independent experiments and presented as means ± SD (n = 3; P < 0.001 throughout time course for ± PMN; P < 0.001 throughout time course for 1×10⁶ PMN ± chemoattractant; P < 0.001 between 46 and 948 seconds for 5×10⁶ PMN ± chemoattractant and P < 0.001 between 46 and 407 seconds for 1×10⁶ versus 5×10⁶ with chemoattractant; two-way ANOVA). (C) Immunofluorescent staining of T84 IECs exposed to PMN using the “Co-culture” model (see Figure S1c) for 0min and (D) 60min, representative images from two independent experiments. Hypoxyprobe-1 adduct staining (red), ZO-1 (green) and nuclei (blue). Scale bar = 200μm. (E) Nuclear accumulation of HIF-1α protein was assayed by Mesoscale ELISA, following exposure of epithelia to activated PMN by “Co-culture” model. Data are represented as means ± SEM and are pooled from three independent experiments (n = 3; P < 0.001 by two-way ANOVA). (F) IECs transfected with HRE-firefly and SV40-renilla Luciferase reporters and subsequently exposed to activated PMN, indicated increased HIF activity Data are represented as means ± SEM and are pooled from three independent experiments (n = 3; P < 0.001 by two-way ANOVA). (G) IECs transfected with HRE-firefly and SV40-renilla luciferase reporters and subsequently exposed to pre-treated PMN in the presence of fMLF. Data are represented as means ± SEM and are pooled from three independent experiments (n = 3; P < 0.05 for ± PMN; P < 0.01 for PMN versus PMN+DPI; one-way ANOVA; DPI = diphenyleneiodonium). (H) HRE-transfected Caco-2 IECs, with subsequent exposure to activated PMN from wild-type or CGD mice. Data are represented as means ± SEM and are pooled from three independent experiments (n = 3; P < 0.001 for no PMN versus wild-type PMN; P > 0.05 for no PMN versus PMN+DPI; P > 0.05 for no PMN versus CGD PMN; one-way ANOVA). See also Figure S2.
Figure 3
Figure 3. Neutrophil accumulation in colitis induces “inflammatory hypoxia”
(A) Representative image of colons excised from Vehicle and TNBS-treated ODD-Luc reporter mice, injected with D-Luciferin before sacrifice and imaged for luciferase activity. (B) Quantification of bioluminescent imaging values represent mean ± SEM. (n = 5; **, P < 0.01; two-tailed Student’s t-test). Gr-1 antibody was used to deplete PMN in ODD-Luc mice, prior to induction of colitis with TNBS. PMN-depleted ODD-Luc mice developed more severe colitis than sham injected mice, demonstrated by (C) weight-loss curves (P < 0.001 for Vehicle versus TNBS; P < 0.001 TNBS versus TNBS+Gr-1; two-way ANOVA) and (D) colon length (P > 0.05 for Vehicle versus TNBS; P < 0.05 for Vehicle+Gr-1 versus TNBS+Gr-1; one-way ANOVA). Data are represented as means ± SEM and are pooled from three independent experiments (n = 12). (E) Protein lysates were profiled for cytokines and normalized to total protein (*, P < 0.05; ***, P < 0.001; one-way ANOVA). (F) MPO activity in tissues post-TNBS ± Gr-1. Data are represented as means ± SEM and are pooled from three independent experiments (n = 12). (G) Tissue homogenates from distal colons of TNBS-treated mice ± Gr-1 depletion revealed an increase in luciferase activity in TNBS-treated mice (P < 0.05), which was attenuated by Gr-1 depletion (P < 0.05; one-way ANOVA). Data represented as means ± SEM and pooled from two independent experiments (n = 8). (H) Representative H&E stained sections revealed PMN accumulation in TNBS, which was attenuated by Gr-1. Inset highlights typical infiltrate observed. (I) IHC for Luciferase and Ly6g indicated accumulation of PMN in TNBS (highlighted in inset), which coincided with hypoxic Luciferase accumulation and an abrogation of both with Gr-1 depletion. Scale bars = 100μm. (J) Fold increases in HIF target gene transcript expression in TNBS ± Gr-1 measured by qPCR, data represents means ± SEM and are pooled from three independent experiments (n = 12). See also Figure S3.
Figure 4
Figure 4. Ulcerative colitis patients with crypt abscesses demonstrate hypoxia-dependent target induction
Biopsies from (A, B, C) uninflamed margins and (D, E, F) inflamed regions with active crypt abscess formation in patients with ulcerative colitis, were processed for H&E (A, D) and stained for hypoxia-responsive Glut-1 (green), neutrophil p47phox (red) and nuclei (blue). Higher magnification of uninflamed tissue (C) or colitis (F) indicates de novo Glut1 (white arrowhead) adjacent to transmigrating PMN (yellow arrowhead). Disease controls from un-inflamed (G) and HIV patient (H) biopsies. Quantification of staining intensities for p47 (G) and Glut1 (H). Measurements were made from 5 ROIs per slide and 5 slides per group. Data represent means ± SEM (n = 25). (**, P < 0.01; ***, P < 0.001; one-way ANOVA). Scale bars = 50μm.
Figure 5
Figure 5. Neutrophil respiratory burst-deficient (CGD) mice develop severe non-resolving colitis
(A) Survival curves for C57/B6 versus CGD following TNBS administration (P < 0.001 compared with vehicle; P < 0.05 compared with wild-type TNBS; Gehan-Breslow-Wilcoxon test). Data represents means ± SEM (n = 6). (B) Survival curves for CGD mice on regular (2.5% TNBS in 50% EtOH), medium (2% TNBS in 45% EtOH) and low TNBS regimen (2% TNBS in 40% EtOH). Data represents means ± SEM (n = 6) (P < 0.005 low compared with regular dose; P < 0.05 low compared with medium dose TNBS; Gehan-Breslow-Wilcoxon test). (C) Weight-loss curves and (D) colon lengths of CGD mice on low TNBS regimen indicated a defect in resolution. Data are represented as means ± SEM and are pooled from three independent experiments (n = 8–12). (E) Representative H&E stained sections revealed severe PMN accumulation in CGD mice treated with TNBS. (F) Hypoxyprobe (red) staining and nuclear (blue) counterstain of wild type versus CGD mice ± TNBS. White arrowheads indicate presence/absence of luminal epithelial cells; yellow arrowheads indicate crypts. Arrows indicate potential presence of bacteria. Scale bars = 100μm. (G) Myeloperoxidase activity assay indicated increased PMN in TNBS (**, P < 0.01; ***, P < 0.001; one-way ANOVA). Data are represented as means ± SEM and are pooled from three independent experiments (n = 8–12). (H) Hypoxia target gene expression from purified colonic epithelial cells for Pgk1 and Glut1 in TNBS. Data are represented as means ± SEM (**, P < 0.01; ***, P < 0001; one-way ANOVA). (I) O2 consumption of B6x versus CGDx m (male) and f (female) (P < 0.001 B6x ± PMA; P > 0.05 male CGDx ± PMA; P < 0.001 female CGDx versus B6x – PMA; P < 0.001 female CGDx versus B6x +PMA; two-way ANOVA). Data is representative of three independent experiments and presented as means ± SD (n = 6). (J) Tissue luciferase was assayed following a low TNBS regimen in both B6x (P < 0.01 Vehicle versus TNBS in B6x) and CGDx (P > 0.05 CGDx vehicle versus TNBS; P < 0.05 for B6x TNBS versus CGDx TNBS; one-way ANOVA). Data represented as means ± SEM and are pooled from two independent experiments (n = 8). See also Figure S4.
Figure 6
Figure 6. Pharmacological intervention with prolyl hydroxylase inhibitor rectifies resolution defect in CGD mice
Wild type and CGD mice treated with AKB-4924 or vehicle on days -1 through 2 and TNBS or vehicle was administered on day 0. Weight loss curves for (A) wild type (P < 0.001 for vehicle versus TNBS on days 1–3; P < 0.001 TNBS versus TNBS+ AKB-4924 on days 2–3; P > 0.05 TNBS+AKB-4924 versus Vehicle+ AKB-4924 on days 2–3) and CGD mice (P < 0.001 CGD vehicle versus CGD TNBS on days 1–3; two-way ANOVA). Data are represented as means ± SEM and are pooled from three independent experiments (n = 8–12). (B) Histological scoring (Inflammatory score left panel; Injury score right panel) of colon sections (n = 4–6; *, P < 0.05; **, P < 0.01; ***, P < 0.001; one-way ANOVA). (C) Flow cytometric analysis of infiltrating leukocytes: CD45+ (bulk leukocytes), CD3+ (T-cells), Ly6g+CD11b+ (neutrophils) and Ly6c+CD11b+ (monocytes). (*, P < 0.05; **, P < 0.01; two-way ANOVA). Data are representative of two independent experiments and presented as means ± SD (n=4–6 mice per group) (p<0.01 by one-way ANOVA). (D) Tissue ELISAs for cytokines from wild type and CGD mice treated with AKB-4924 ± TNBS (*, P < 0.05; **, P < 0.01; ***, P < 0.001; one-way ANOVA). Data are represented as means ± SEM and are pooled from three independent experiments (n = 8–12). (E) Representative H&E stained sections (top panels) from CGD mice with (+) or without (−) AKB-4924 and IHC staining (bottom panels) for HIF-1α (green) and nuclei (blue). Scale bars = 100μm. Yellow arrowheads indicate co-localization in TNBS and AKB-4924-treated crypt epithelial cells. (F) Quantification of staining intensities for HIF-1α and (G) co-localization analysis of HIF-1α with nuclear DAPI. Data are represented as means ± SEM of three pooled experiments (n = 8–12), (*, P < 0.05; **, P < 0.01; ***, P < 0.001; one-way ANOVA). See also Figure S5 and S6.
Figure 7
Figure 7. HIF stabilization promotes mucosal protection against luminal bacteria in CGD mice via goblet cell function
CGD mice treated with AKB-4924 or vehicle on days -1 through 2 and TNBS or vehicle was administered on day 0. Fluorescent in situ hybridization (FISH) was performed using Eub338 probe (magenta) in CGD mice (A) representative images indicated crypt infiltration of bacteria during colitis. (B) Quantification of bacterial dissemination to mesenteric lymph nodes was achieved by 16S rDNA qPCR. Data is presented as means ± SEM (n = 6). (C) Serum LPS quantification was measured by LAL assay. Data are represented as means ± SEM of three pooled experiments (n = 8–12). (D) Representative Alcian blue staining staining for goblet cells from CGD mice. (E) Quantification of goblet cell number per crypt in CGD mice. (F) GI permeability was assessed by measuring serum FITC 4hrs post gavage. Data is represented as mean ± SEM of three pooled experiments (n = 8–12). (G) Real-time qPCR of mucosal epithelial hypoxia target genes involved in regulating mucus barrier Tff3 and Muc3. Data are represented as means ± SEM of three pooled experiments (n = 8–12), (*, P < 0.05; **, P < 0.01; ***, P < 0.001; one-way ANOVA). See also Figure 7.

Comment in

References

    1. Amulic B, Cazalet C, Hayes GL, Metzler KD, Zychlinsky A. Neutrophil function: from mechanisms to disease. Annual review of immunology. 2012;30:459–489. - PubMed
    1. Beck PL, Ihara E, Hirota SA, MacDonald JA, Meng D, Nanthakumar NN, Podolsky DK, Xavier RJ. Exploring the interplay of barrier function and leukocyte recruitment in intestinal inflammation by targeting fucosyltransferase VII and trefoil factor 3. American journal of physiology. Gastrointestinal and liver physiology. 2010;299:G43–53. - PMC - PubMed
    1. Bobrie A, Krumeich S, Reyal F, Recchi C, Moita LF, Seabra MC, Ostrowski M, Thery C. Rab27a supports exosome-dependent and -independent mechanisms that modify the tumor microenvironment and can promote tumor progression. Cancer research. 2012;72:4920–4930. - PubMed
    1. Brinkmann V, Reichard U, Goosmann C, Fauler B, Uhlemann Y, Weiss DS, Weinrauch Y, Zychlinsky A. Neutrophil extracellular traps kill bacteria. Science (New York, NY. 2004;303:1532–1535. - PubMed
    1. Campbell EL, MacManus CF, Kominsky DJ, Keely S, Glover LE, Bowers BE, Scully M, Bruyninckx WJ, Colgan SP. Resolvin E1-induced intestinal alkaline phosphatase promotes resolution of inflammation through LPS detoxification. Proceedings of the National Academy of Sciences of the United States of America. 2010;107:14298–14303. - PMC - PubMed

Publication types

MeSH terms