

A technique for in vivo mapping of myocardial creatine kinase metabolism
- PMID: 24412924
- PMCID: PMC4127628
- DOI: 10.1038/nm.3436
A technique for in vivo mapping of myocardial creatine kinase metabolism
Abstract
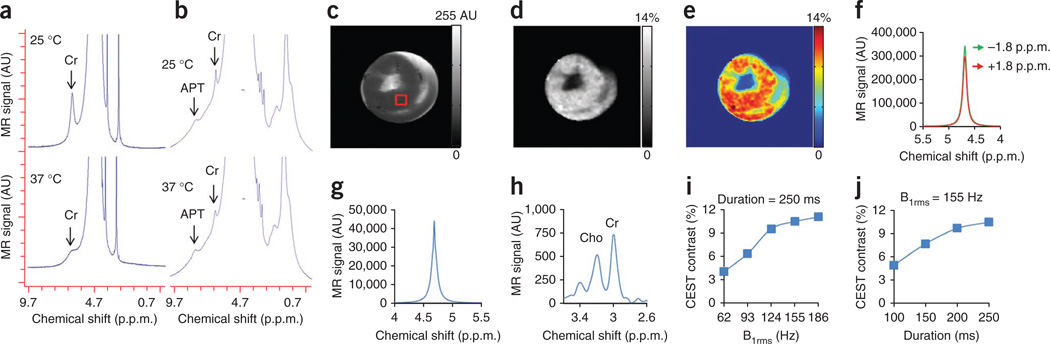
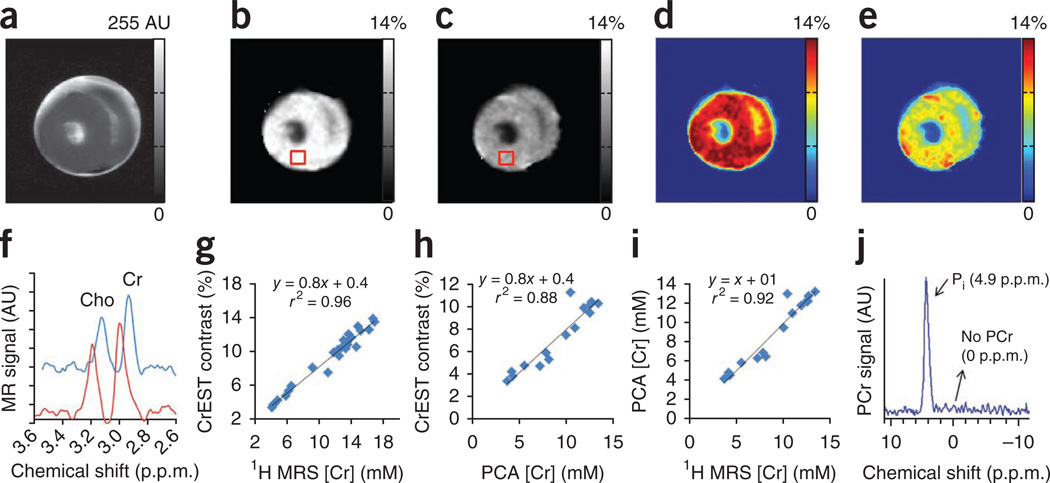
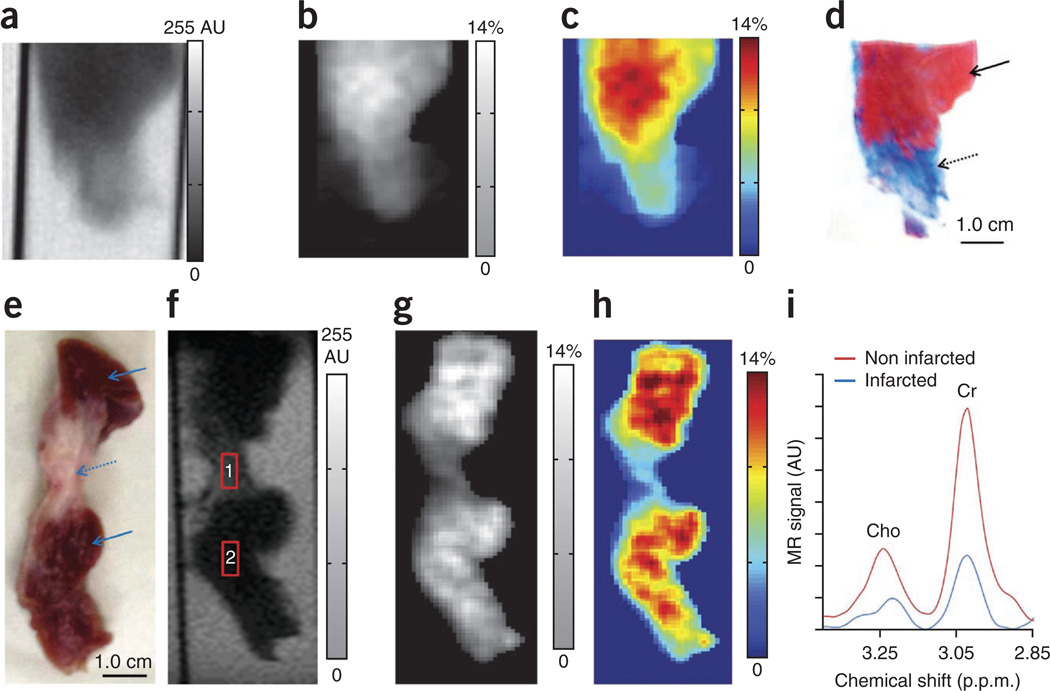
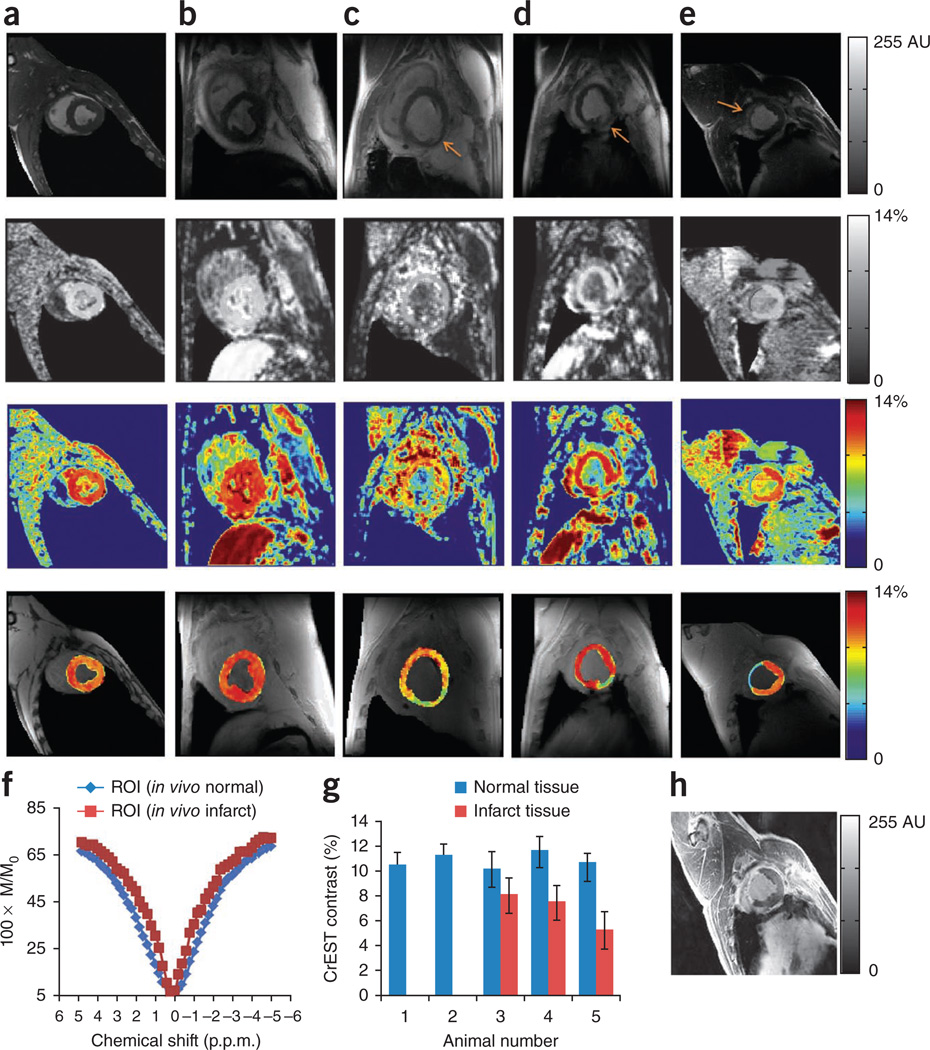
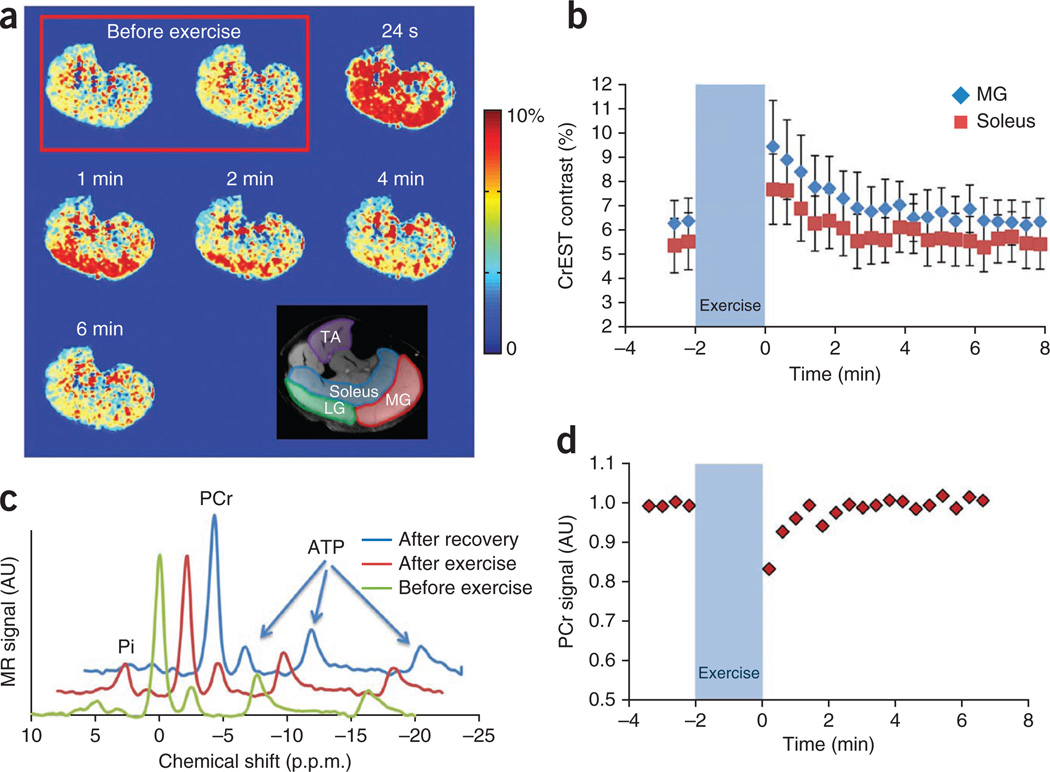
ATP derived from the conversion of phosphocreatine to creatine by creatine kinase provides an essential chemical energy source that governs myocardial contraction. Here, we demonstrate that the exchange of amine protons from creatine with protons in bulk water can be exploited to image creatine through chemical exchange saturation transfer (CrEST) in myocardial tissue. We show that CrEST provides about two orders of magnitude higher sensitivity compared to (1)H magnetic resonance spectroscopy. Results of CrEST studies from ex vivo myocardial tissue strongly correlate with results from (1)H and (31)P magnetic resonance spectroscopy and biochemical analysis. We demonstrate the feasibility of CrEST measurement in healthy and infarcted myocardium in animal models in vivo on a 3-T clinical scanner. As proof of principle, we show the conversion of phosphocreatine to creatine by spatiotemporal mapping of creatine changes in the exercised human calf muscle. We also discuss the potential utility of CrEST in studying myocardial disorders.
Figures
Similar articles
-
Exchange rates of creatine kinase metabolites: feasibility of imaging creatine by chemical exchange saturation transfer MRI.NMR Biomed. 2012 Nov;25(11):1305-9. doi: 10.1002/nbm.2792. Epub 2012 Mar 20. NMR Biomed. 2012. PMID: 22431193 Free PMC article.
-
Creatine kinase rate constant in the human heart at 7T with 1D-ISIS/2D CSI localization.PLoS One. 2020 Mar 19;15(3):e0229933. doi: 10.1371/journal.pone.0229933. eCollection 2020. PLoS One. 2020. PMID: 32191723 Free PMC article.
-
Relaxation-compensated CEST-MRI at 7 T for mapping of creatine content and pH--preliminary application in human muscle tissue in vivo.NMR Biomed. 2015 Nov;28(11):1402-12. doi: 10.1002/nbm.3367. Epub 2015 Sep 16. NMR Biomed. 2015. PMID: 26374674
-
Human cardiac spectroscopy.MAGMA. 1998 Sep;6(2-3):157-60. doi: 10.1007/BF02660945. MAGMA. 1998. PMID: 9803397 Review. No abstract available.
-
[Mechanism of myocardial contraction (review of the literature)].Vrach Delo. 1978 Oct;(10):35-40. Vrach Delo. 1978. PMID: 152514 Review. Russian. No abstract available.
Cited by
-
Metabolomic fingerprint of heart failure with preserved ejection fraction.PLoS One. 2015 May 26;10(5):e0124844. doi: 10.1371/journal.pone.0124844. eCollection 2015. PLoS One. 2015. PMID: 26010610 Free PMC article.
-
Multimodality assessment of heart failure with preserved ejection fraction skeletal muscle reveals differences in the machinery of energy fuel metabolism.ESC Heart Fail. 2021 Aug;8(4):2698-2712. doi: 10.1002/ehf2.13329. Epub 2021 May 15. ESC Heart Fail. 2021. PMID: 33991175 Free PMC article.
-
Muscle oxidative phosphorylation quantitation using creatine chemical exchange saturation transfer (CrCEST) MRI in mitochondrial disorders.JCI Insight. 2016 Nov 3;1(18):e88207. doi: 10.1172/jci.insight.88207. JCI Insight. 2016. PMID: 27812541 Free PMC article.
-
Brain pH Measurement Using AACID CEST MRI Incorporating the 2 ppm Amine Resonance.Tomography. 2022 Mar 9;8(2):730-739. doi: 10.3390/tomography8020060. Tomography. 2022. PMID: 35314637 Free PMC article.
-
Myocardial ATP depletion detected noninvasively predicts sudden cardiac death risk in patients with heart failure.JCI Insight. 2022 Jun 22;7(12):e157557. doi: 10.1172/jci.insight.157557. JCI Insight. 2022. PMID: 35579938 Free PMC article.
References
-
- Balaban RS, Chesnick S, Hedges K, Samaha F, Heineman FW. Magnetization transfer contrast in MR imaging of the heart. Radiology. 1991;180:671–675. - PubMed
-
- Bax JJ, de Roos A, van Der Wall EE. Assessment of myocardial viability by MRI. J. Magn. Reson. Imaging. 1999;10:418–422. - PubMed
-
- Kim HW, Farzaneh-Far A, Kim RJ. Cardiovascular magnetic resonance in patients with myocardial infarction: current and emerging applications. J. Am. Coll. Cardiol. 2009;55:1–16. - PubMed
-
- Beek AM, et al. Delayed contrast-enhanced magnetic resonance imaging for the prediction of regional functional improvement after acute myocardial infarction. J. Am. Coll. Cardiol. 2003;42:895–901. - PubMed
Publication types
MeSH terms
Substances
Grants and funding
LinkOut - more resources
Full Text Sources
Other Literature Sources
Medical
Research Materials
