. 2014 Jun 1;23(11):2858-79.
doi: 10.1093/hmg/ddt674. Epub 2014 Jan 9.

c-Abl phosphorylates α-synuclein and regulates its degradation: implication for α-synuclein clearance and contribution to the pathogenesis of Parkinson's disease

Affiliations

c-Abl phosphorylates α-synuclein and regulates its degradation: implication for α-synuclein clearance and contribution to the pathogenesis of Parkinson's disease

Anne-Laure Mahul-Mellier et al. Hum Mol Genet. .

Abstract

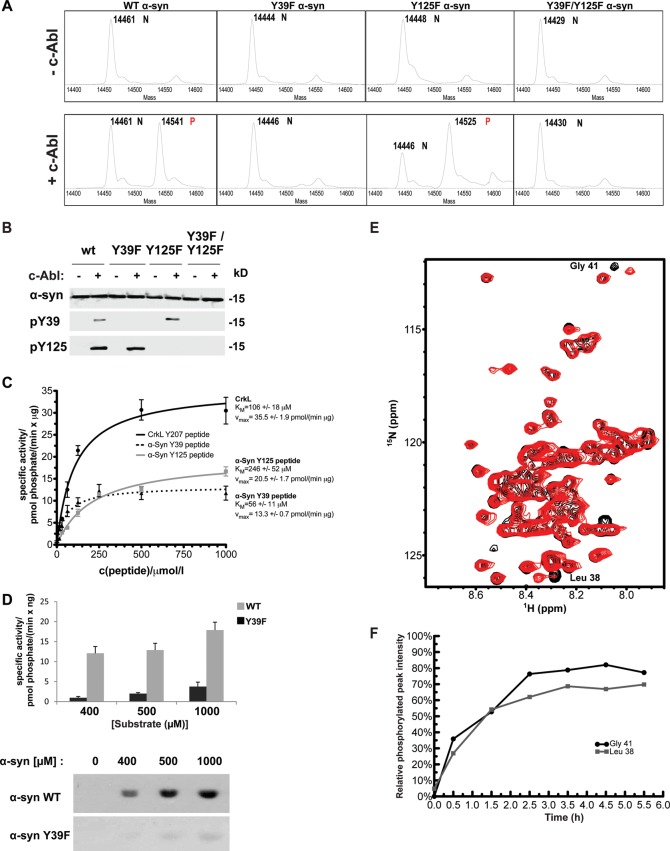
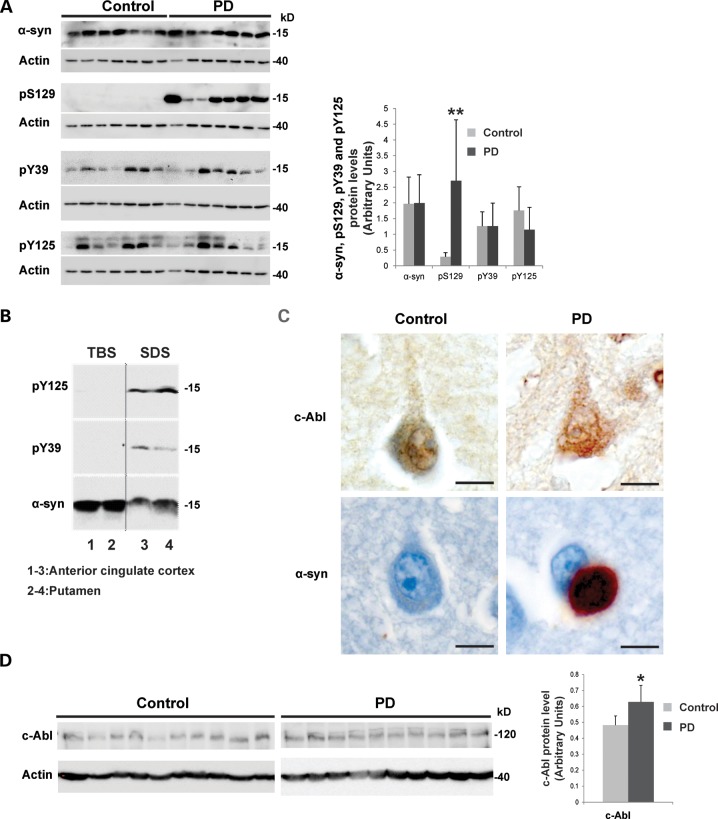
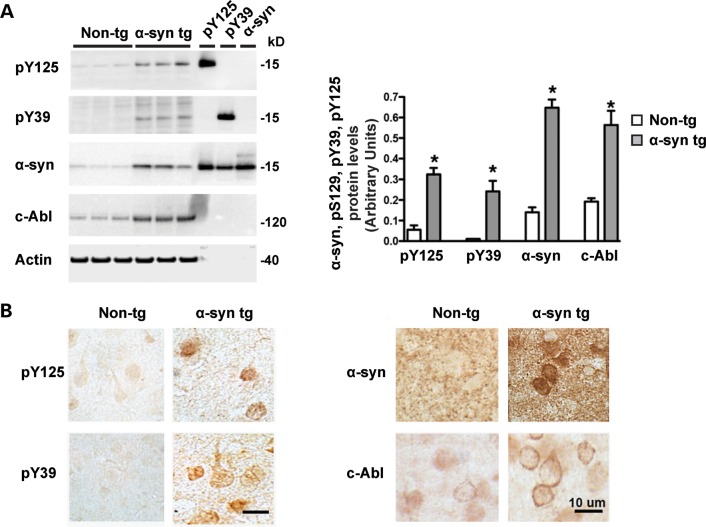
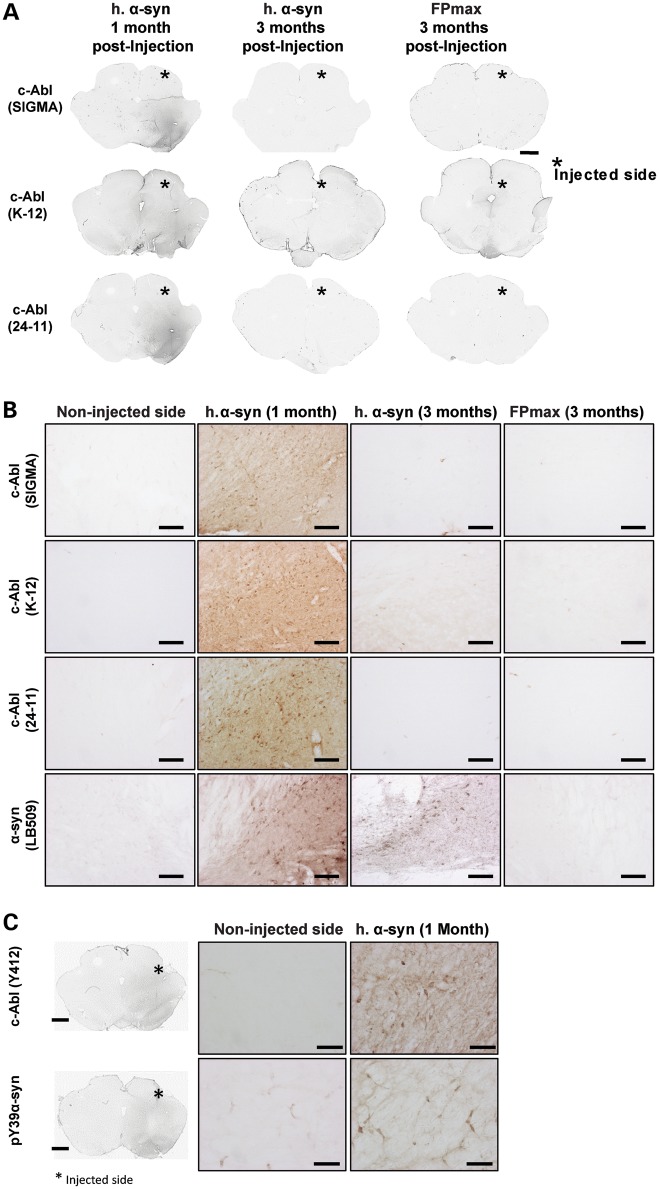
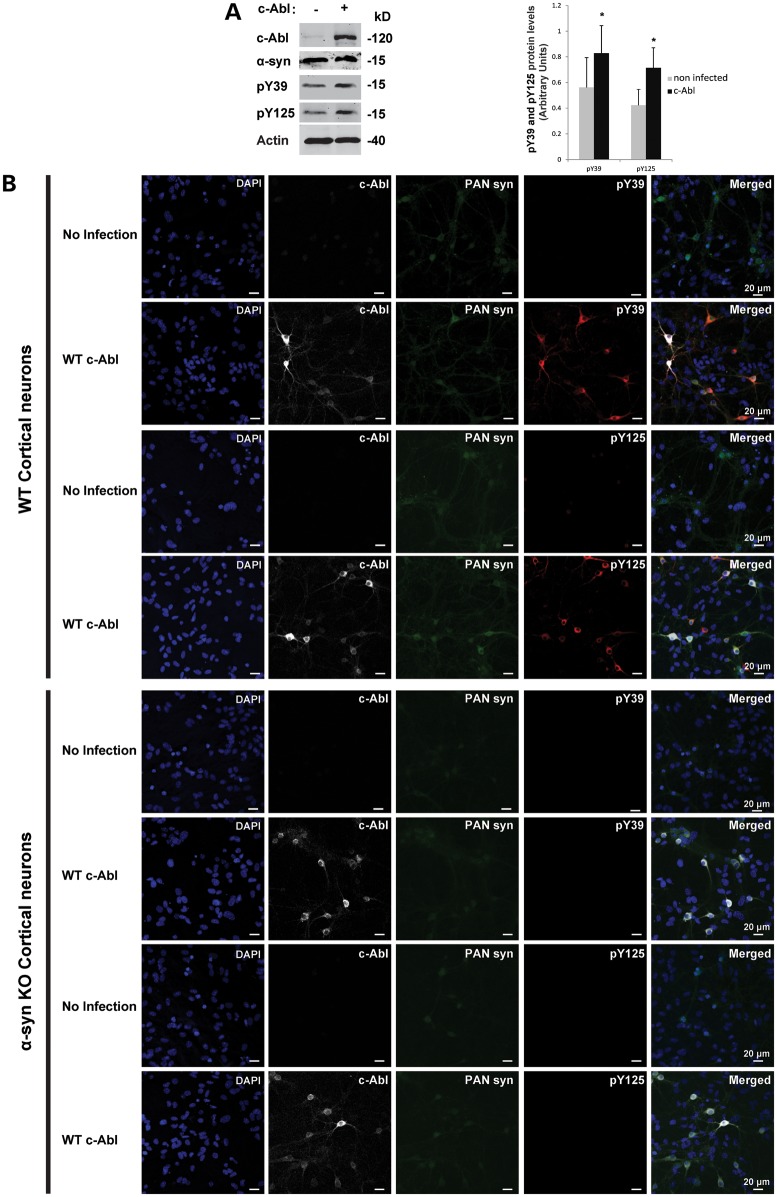
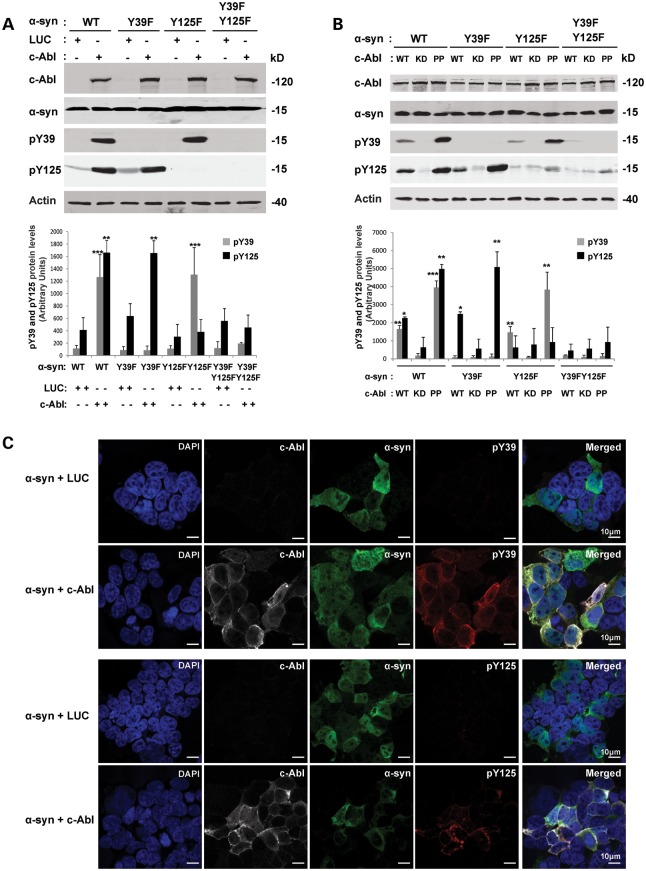
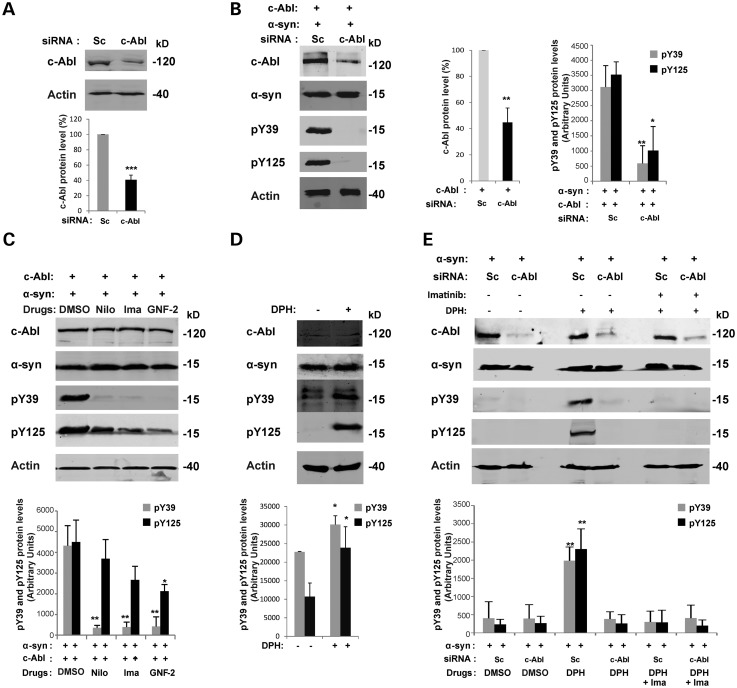
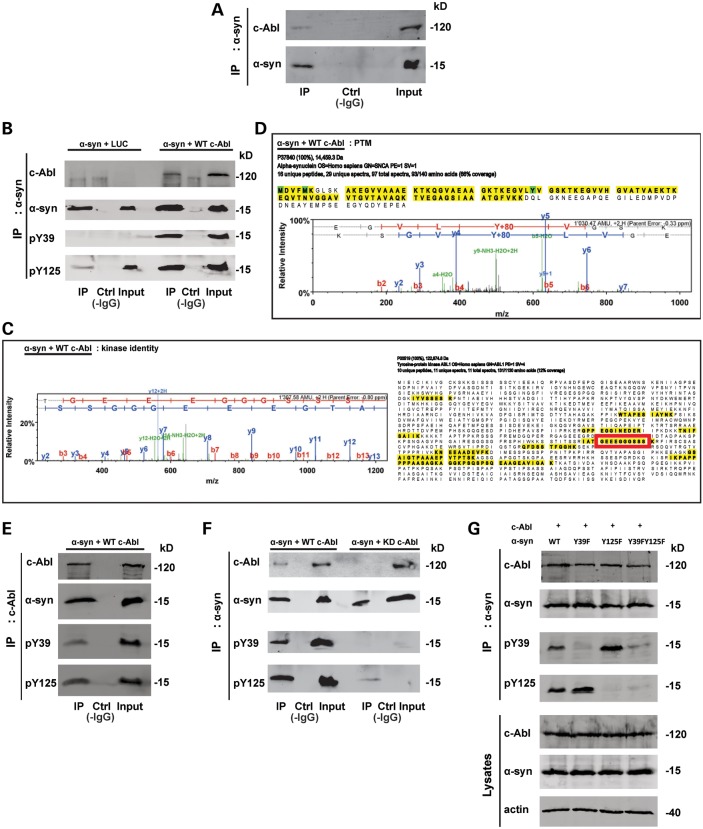
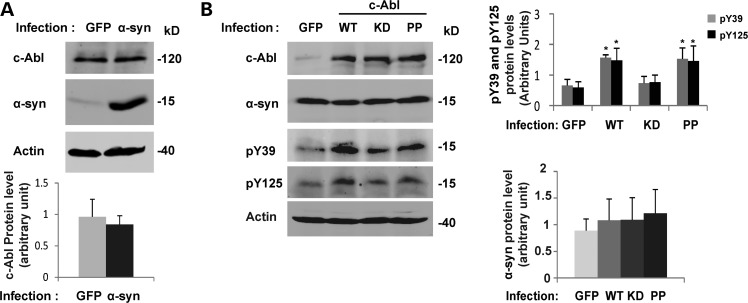
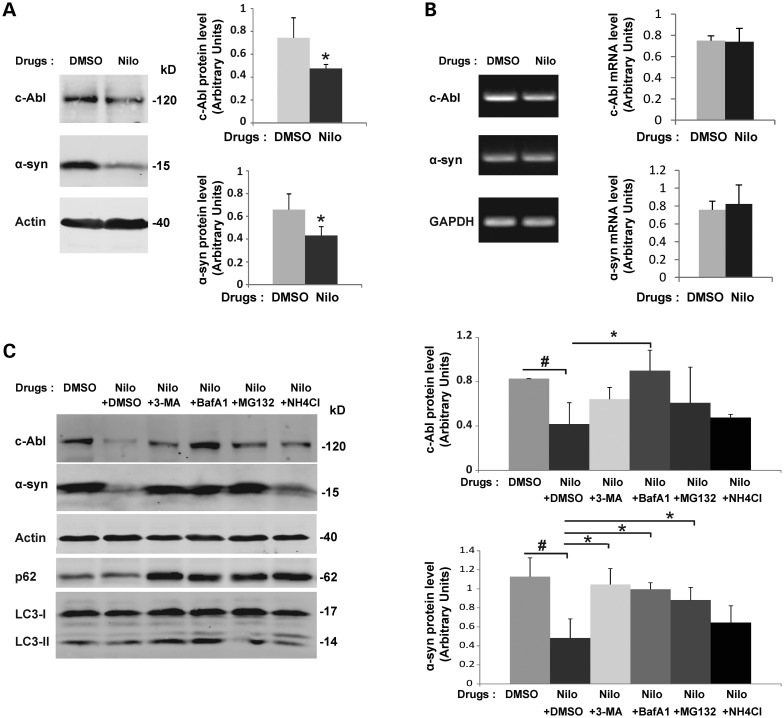
Increasing evidence suggests that the c-Abl protein tyrosine kinase could play a role in the pathogenesis of Parkinson's disease (PD) and other neurodegenerative disorders. c-Abl has been shown to regulate the degradation of two proteins implicated in the pathogenesis of PD, parkin and α-synuclein (α-syn). The inhibition of parkin's neuroprotective functions is regulated by c-Abl-mediated phosphorylation of parkin. However, the molecular mechanisms by which c-Abl activity regulates α-syn toxicity and clearance remain unknown. Herein, using NMR spectroscopy, mass spectrometry, in vitro enzymatic assays and cell-based studies, we established that α-syn is a bona fide substrate for c-Abl. In vitro studies demonstrate that c-Abl directly interacts with α-syn and catalyzes its phosphorylation mainly at tyrosine 39 (pY39) and to a lesser extent at tyrosine 125 (pY125). Analysis of human brain tissues showed that pY39 α-syn is detected in the brains of healthy individuals and those with PD. However, only c-Abl protein levels were found to be upregulated in PD brains. Interestingly, nilotinib, a specific inhibitor of c-Abl kinase activity, induces α-syn protein degradation via the autophagy and proteasome pathways, whereas the overexpression of α-syn in the rat midbrains enhances c-Abl expression. Together, these data suggest that changes in c-Abl expression, activation and/or c-Abl-mediated phosphorylation of Y39 play a role in regulating α-syn clearance and contribute to the pathogenesis of PD.


Figures

Figure 1.
Figure 1.
c-Abl preferentially phosphorylates α-syn at Y39 residue in vitro. (A) Mass spectrometry analysis of analytical in vitro phosphorylation assays of WT, Y39F, Y125F or the double mutant Y39F/Y125F α-syn with (+c-Abl) or without (−c-Abl) recombinant SH2-CD c-Abl. Phosphorylation was detected by a +80 Da mass shift. ‘N’ denotes nonphosphorylated starting material peaks, ‘P’ indicates the peaks corresponding to phosphorylated proteins. (B) WB analysis of the same reactions shown in (A) was performed using different phospho-specific α-syn antibodies in order to confirm that phosphorylation occurred at the expected sites. (C) Recombinant SH2-CD c-Abl kinase was used to perform kinase assays with increasing concentrations of α-syn peptides (dotted black line: biotin-α-syn (34–44)-NH2; full gray line: biotin-α-syn (119–129)-NH2) or the positive control CrkL peptide (full black line). Specific activity was calculated and plotted over the substrate concentration (Michaelis–Menten graph). The graph shows the mean ± SD of a representative experiment performed in triplicates. (D) Quantification of FL WT α-syn (dark gray bars) and Y39F (light gray bars) phosphorylation by recombinant WT SH2-CD c-Abl performed at different substrate concentrations (top panel). Bars represent the mean ± SD of a representative experiment performed in triplicates. Representative autoradiography (bottom panel) obtained from a SDS–PAGE gel from which the Coomassie-stained bands were cut and measured by scintillation counting to obtain the data in the top panel. (E) 1H/15N HSQC NMR spectrum of WT α-syn in the presence of c-Abl at t = 0 (black peaks) and after t = 5–6 h of phosphorylation (red peaks). The two-framed peaks in the upper right portion of the spectrum correspond to Gly41 in the unphosphorylated protein (black peak labeled ‘#’) and in the Y39-phosphorylated form (red peak labeled ‘*’). (F) Kinetics of α-syn phosphorylation at Y39 measured by NMR. The phosphorylation-dependent chemical shift changes of Gly41 (see panel C) and Leu 39 (see Supplementary Material, Fig. S1B) were used to quantify phosphorylation at Y39 as the intensity of the peak arising from the phosphorylated protein relative to the sum of the intensities of the peaks arising from both phosphorylated and unphosphorylated protein. Values <0 (due to noise-related negative peak intensities) were set to 0.
Figure 2.
Figure 2.
Phosphorylation of α-syn at Y39 and Y125 and an increase in c-Abl protein level can be detected in vivo in human PD brain tissue. (A) Representative WB of the relative phosphorylation status of α-syn observed in PD cases versus controls. Protein extracts from samples of the anterior cingulate cortex from Parkinson's disease patients (n = 17) and age- and post-mortem delay-matched neurological and neuropathological controls (n = 17) were resolved by SDS–PAGE and analyzed by WB (shown, n = 7 from PD cases and n = 7 from age- and post-mortem delay-matched neurological and neuropathological controls) using α-syn antibodies against pS129, pY125, pY39 and total α-syn (left-hand-side panel). Phosphorylation levels (pS129, pY125, pY39) of α-syn were evaluated by densitometry quantification (right-hand-side panel). The band intensities were normalized in the following manner: [(pY39 or pY125 or pS129/actin)/α-syn]. The bars represent the mean ± SD of PD cases (n = 17) and control cases (n = 17). **P < 0.005; (Student's t-test: PD cases versus controls). (B) Representative WB of the relative amounts of α-syn in PD cases. The brain tissue (anterior cingulate cortex that has lots of Lewy bodies (lanes 1 and 3) and putamen where the dopamine terminals are lost (lanes 2 and 4) from PD cases was sequentially extracted for TBS-soluble and SDS-soluble fractions. Proteins were resolved by SDS–PAGE and analyzed by WB using α-syn antibodies against pY125, pY39 and total α-syn. (C) Representative fixed tissue ICC showing protein immunoreactivity in PD and control cases. c-Abl immunoreactivity was observed in small neuronal cytoplasmic punctate structures, which were enhanced in a proportion of pyramidal neurons in PD cases versus controls. α-syn immunoreactive Lewy bodies were only observed in a proportion of pyramidal neurons in the PD cases. Scale bar = 10 µm. (D) Representative WB of the relative c-Abl protein amounts observed in PD cases versus controls. Protein extracts from samples of the anterior cingulate cortex from PD cases (n = 17) and age- and post-mortem delay-matched neurological and neuropathological controls (n = 17) were resolved by SDS–PAGE and analyzed by WB (shown, n = 10 from PD cases and n = 10 from age- and post-mortem delay-matched neurological and neuropathological controls) using a c-Abl antibody (left hand panel). c-Abl protein level was evaluated by densitometry quantification (right-hand-side panel). The band intensities were normalized in the following manner: (c-Abl/actin). The bars represent the mean ± SD of PD cases (n = 17) and control cases (n = 17). *P < 0.05; (Student's t-test: PD cases versus controls).
Figure 3.
Figure 3.
Both c-Abl and phosphorylated α-syn (at Y39 or Y125) levels are increased in α-syn transgenic mice. (A) Brain homogenates from non-transgenic and mThy1-h α-syn WT transgenic (tg) mice from line 61 (49) (male, 6 m/o) were fractioned into membrane and cytosolic fractions and ran in SDS–PAGE gels, blotted and probed with antibodies against pY125, pY39, α-syn, c-Abl and actin as previously described (54). Representative blots are from the membrane fraction, bands in the far right are recombinant proteins that served as positive controls and molecular weight markers (left-hand-side hand panels). Image analysis of the specific bands expressed as ratio to the actin loading control. The bars represent the mean ± SD of n = 5 mice per group, *P < 0.001 by Student's t-test. (B) Immunocytochemical analysis with antibodies pY125, pY39, α-syn and c-Abl developed with diaminobenzidine utilizing vibratome sections. Images are representative of the temporal cortex. In the tg mice, there was increased immunoreactivity in neuronal cell bodies with pY125, pY39, α-syn and c-Abl antibodies.
Figure 4.
Figure 4.
c-Abl protein levels increase transiently upon α-syn overexpression in rat midbrains. (A and B) Effect of α-syn overexpression on c-Abl protein levels in vivo, low magnification (scale bar: 500 µm) (A) and high-power magnification photomicrographs (scale bar: 100 µm) (B) that illustrate the endogenous protein level of c-Abl after the overexpression of human α-syn or FPmax (*, injected side; n = 3 per condition). The use of three different antibodies raised against different epitopes of c-Abl [(Sigma), (K12, Santa Cruz), (24-11, Santa Cruz)] revealed a dramatic increase of c-Abl protein level only in the side injected with human α-syn. Overexpression of α-syn was confirmed by IHC staining on serial section (B, bottom line). No c-Abl signal was detected in FPmax-injected or in the non-injected sides. The enhancement of c-Abl protein expression induced by α-syn overexpression was primarily observed at 1 month post-injection and disappeared after 3 months post-injection, suggesting a transient interplay between c-Abl and α-syn. (C) Protein levels of pY39 α-syn and activated c-Abl (pY412, a marker of high kinase activity) increased only in the injected side overexpressing α-syn 1 month post-injection (scale bar: 50 µm).
Figure 5.
Figure 5.
c-Abl induces α-syn phosphorylation at Y39 and Y125 residues in primary cortical neurons. (A) WT primary cortical neurons were infected with lentivirus encoding for c-Abl or with an empty lentivirus. Five days post-infection, neurons were lysed and the proteins were separated using SDS–PAGE and detected by WB analysis (left-hand-side panel). The α-syn phosphorylation status was assessed using the phosphorylation site-specific antibodies for Y39 or Y125 residues. α-syn and c-Abl expressions were confirmed in an additional protein blot using specific antibodies. Actin was used as a loading control. The phosphorylation of α-syn at residues Y39 and Y125 was evaluated by densitometry quantification (right-hand-side panel). The band intensities were normalized in the following manner: pY39/[α-syn/actin] or pY125/[α-syn/actin]. Bars represent the mean ± SD of three independent experiments. *P < 0.05 (Student's t-test: non-infected versus c-Abl infection). (B) WT or α-syn KO primary cortical neurons were infected with c-Abl lentivirus or an empty lentivirus. Five days post-infection, neurons were immunostained with the appropriate antibodies and counterstained with DAPI to reveal the nucleus.
Figure 6.
Figure 6.
c-Abl induces α-syn phosphorylation at Y39 and Y125 residues in HEK293T cells. (A) HEK293T cells were transfected with WT α-syn or its mutants (Y39F, Y125F or Y39FY125F) together with plasmids encoding for LUC (negative control) or WT c-Abl. Twenty-four hours post-transfection, cells were lysed and the proteins separated using SDS–PAGE and detected by WB analysis (top panel). α-syn phosphorylation status was assessed using phosphorylation site-specific antibodies for Y39 or Y125 residues. α-syn and c-Abl expression were confirmed in an additional protein blot using specific antibodies. Actin was used as a loading control. The phosphorylation of α-syn at residues Y39 and Y125 was evaluated by densitometry quantification (bottom panel). The band intensities were in the following manner: pY39/[α-syn/actin] or pY125/[α-syn/actin]. The bars represent the mean ± SD of three independent experiments. **P < 0.005; ***P < 0.0005 (Student's t-test: α-syn + LUC versus α-syn + c-Abl). (B) HEK293T cells were transfected with WT α-syn or its mutants (Y39F, Y125F or Y39FY125F) together with plasmids encoding for WT c-Abl or its inactive mutant KD c-Abl (kinase dead) or its constitutively active mutant PP c-Abl. Twenty-four hours post-transfection, cells were lysed and proteins separated using SDS–PAGE and detected by WB analysis (top panel). α-syn phosphorylation status was assessed using phosphorylation site-specific antibody for Y39 or Y125 residues. α-syn and c-Abl expression were confirmed in an additional protein blot using specific antibodies. Actin was used as a loading control. Phosphorylation of α-syn at residues Y39 and Y125 was evaluated by densitometry quantification (bottom panel). The band intensities were normalized as followed: pY39/[α-syn/actin] or pY125/[α-syn/actin]. The bars represent the mean ± SD of three independent experiments. **P < 0.005; ***P < 0.0005 (Student's t-test: α-syn + KD c-Abl versus α-syn + WT c-Abl or PP). (C) HEK293T cells were transfected with WT α-syn together with plasmids encoding for LUC or WT c-Abl. Twenty-four hours post-transfection, cells were immunostained with the appropriate antibodies and counterstained with DAPI to reveal the nucleus.
Figure 7.
Figure 7.
Modulation of c-Abl activity regulates α-syn phosphorylation at Y39 and Y125 residues. (A) Validation of the siRNA against c-Abl. HEK293T cells were transfected with specific siRNA against c-Abl or with a negative control (scramble siRNA, Sc). Forty-eight hours post-transfection, cells were lysed and protein level of endogenous c-Abl was assessed by WB and quantified by densitometry. The band intensities were normalized in the following manner: c-Abl/actin. The bars represent the mean ± SD of four independent experiments. ***P < 0.005 (Student's t-test: siRNA Sc cells versus siRNA c-Abl cells). (B) Downregulation of c-Abl protects α-syn from phosphorylation at Y39 and Y125 residues. HEK293T cells were transfected with a siRNA construct against c-Abl or with a control scrambled siRNA (Sc) together with plasmids encoding for WT α-syn and WT c-Abl. The downregulation of the c-Abl protein and its effect on α-syn phosphorylation (Y39 and Y125 residues) was confirmed by WB 48 h post-transfection (left-hand-side panel). Actin was used as a loading control. α-syn phosphorylation at Y39 and Y125 was evaluated by densitometry quantification (right-hand-side panel). The band intensities were normalized in the following manner: c-Abl/actin or pY39/[α-syn/actin] or pY125/[α-syn/actin]. The bars represent the mean ± SD of three independent experiments. *P < 0.01; **P < 0.005 (Student's t-test: siRNA Sc cells versus siRNA c-Abl cells). (C) c-Abl drug inhibitors protect α-syn from phosphorylation at Y39 and Y125 residues. c-Abl activity can be specifically inhibited using drugs such as nilotinib and imatinib (ATP competitors) or GNF-2 (non-ATP competitor). HEK293T cells were transfected with WT α-syn together with a plasmid encoding for WT c-Abl. Twenty-four hours post-transfection, the cells were left untreated (DMSO) or treated overnight with c-Abl kinase pharmacological inhibitors: nilotinib (20 µm) or imatinib (20 µm) or GNF-2 (20 µm). WB analysis (top panel) shows the decrease of α-syn phosphorylation (Y39 and Y125 residues) when c-Abl activity was inhibited using drugs. Actin was used as a loading control. The phosphorylation of α-syn at residues Y39 and Y125 was evaluated by densitometry quantification (bottom panel). The band intensities were normalized in the following manner: pY39/[α-syn/actin] or pY125/[α-syn/actin]. The bars represent the mean ± SD of three independent experiments. *P < 0.05; **P < 0.005 (Student's t-test: untreated versus c-Abl kinase drug inhibitors). (D) c-Abl drug activator DPH induces α-syn phosphorylation at Y39 and Y125 residues in an SH-5Y5 α-syn stable cell line. SH-5Y5 α-syn stable cells were left untreated (DMSO) or treated for 3 h with DPH (50 µm) and analyzed by WB (top panel). DPH induced α-syn phosphorylation at Y39 and Y125 residues was evaluated by densitometry quantification (bottom panel). The band intensities were normalized in the following manner: pY39/[α-syn/actin] or pY125/[α-syn/actin]. The bars represent the mean ± SD of three independent experiments. *P < 0.05 (Student's t-test: untreated versus DPH treatment). (E) c-Abl drug activator induces α-syn phosphorylation at Y39 and Y125 residues. c-Abl activity can be specifically activated using DPH. HEK293T cells were transfected with a siRNA construct against c-Abl or with a control scrambled siRNA (Sc). Twenty-four hours post-transfection, cells were left untreated (DMSO) or treated overnight with c-Abl kinase drugs activator: DPH (50 µm) with or without imatinib (20 µm). Immunoblots (top panel) shown that DPH induced phosphorylation of α-syn (Y39 and Y125 residues) in the cells expressing c-Abl (Sc cells) but not in the cells in which endogenous c-Abl has been downregulated. Imatinib inhibited phosphorylation of α-syn (Y39 and Y125 residues) induced using DPH in the Sc cells. Phosphorylation of α-syn at residues Y39 and Y125 was evaluated by densitometry quantification (bottom panel). The band intensities were normalized in the following manner: pY39/[α-syn /actin] or pY125/[α-syn/actin]. The bars represent the mean ± SD of three independent experiments. **P < 0.005 (Student's t-test: siRNA Sc cells versus siRNA c-Abl cells).
Figure 8.
Figure 8.
c-Abl interacts with α-syn. (A) Co-immunoprecipitation of endogenous/native α-syn and c-Abl. Cortical neurons were lysed and total cell lysates were left untreated (Ctrl without IgG, Input) or immunoprecipitated (IP) with an anti-α-syn antibody and the blots were probed with the indicated antibodies. WB showed that endogenous c-Abl could be co-immunoprecipitated with endogenous α-syn. (BD) Mass spectrometry-based confirmation of c-Abl-mediated α-syn phosphorylation at Y39. HEK293T cells were transfected with WT α-syn together with plasmids coding for Luciferase or WT c-Abl. Twenty-four hours post-transfection, total cell lysates were left untreated (Ctrl without IgG, Input) or immunoprecipitated (IP) with an anti-α-syn antibody, and the blots were probed with the indicated antibodies. (B) WB analysis confirmed α-syn phosphorylation at Y39 and Y125 residues and showed c-Abl could be co-immunoprecipitated with α-syn (top panel). IP eluates were also loaded onto Coomassie-stained gels and the bands corresponding to α-syn and c-Abl were excised, digested with trypsin and analyzed by LC–ESI–MS/MS. (C) Sequence coverage for c-Abl identified from the Co-immunoprecipitation, and the MS/MS spectrum of a unique, c-Abl-specific tryptic peptide (sequence GGEEEGGGSSS, indicated by a red frame). (D) The sequence coverage and a representative MS/MS spectrum confirming α-syn phosphorylation at Y39 (figures generated using Scaffold v. 3.4.5). (E) α-syn co-immunoprecipitated with c-Abl. HEK293T cells were transfected with WT α-syn together with plasmids encoding for WT c-Abl. Twenty-four hours post-transfection total cell lysates were left untreated (Ctrl without IgG, Input) or immunoprecipitated (IP) with an anti-c-Abl antibody and the blots probed with the indicated antibodies. (F) WT c-Abl but not its inactive mutant (KD c-Abl) Co-immunoprecipitated with α-syn. HEK293T cells were transfected with α-syn WT together with plasmids encoding for WT c-Abl or KD c-Abl. Twenty-four hours post-transfection total cell lysates were left untreated (Ctrl without IgG, Input) or IP with an anti-α-syn antibody and blots probed with the indicated antibodies. (G) WT c-Abl co-immunoprecipitated with WT α-syn or its mutants. HEK293T cells were transfected with WT α-syn or its mutant (Y39F, Y125F or Y39FY125F) together with plasmid encoding for WT c-Abl. Twenty-four hours post-transfection total cell lysates were left untreated (Ctrl without IgG, Input) or IP with an anti-α-syn antibody, and blots probed with the indicated antibodies.
Figure 9.
Figure 9.
α-syn protein level does not increase in cortical neurons infected by c-Abl. (A) Cortical neurons were infected with lentiviruses for GFP or α-syn (top panel). After 5 days, neurons were lysed in Laemmli buffer 2× and the proteins were separated using SDS–PAGE. The expression levels of α-syn and c-Abl were assessed by WB. Actin was used as a loading control. c-Abl protein level was evaluated by densitometry quantification (bottom panel). The band intensities were normalized in the following manner: (c-Abl/actin). The bars represent the mean ± SD of three independent experiments. P > 0.05 (Student's t-test: GFP versus α-syn infected cells). (B) Cortical neurons were infected with lentiviruses for GFP, WT, KD or PP c-Abl. After 5 days, cells were lysed in Laemmli buffer 2× and the proteins were separated by SDS–PAGE. α-syn and c-Abl expression levels were assessed by WB (left hand panel). α-syn phosphorylation status was also confirmed using anti-pY39 or pY125 antibodies in a separate protein blot. Actin was used as a loading control. The α-syn protein levels were evaluated by densitometry quantification (right-hand-side panels). The band intensities were normalized in the following manner: (α-syn/actin). The bars represent the mean ± SD of three independent experiments. P > 0.05 (Student's t-test:GFP versus c-Abl infected cells); *P < 0.05 (Student's t-test: GFP versus WT or PP c-Abl infected cells).
Figure 10.
Figure 10.
α-syn and c-Abl protein levels are concomitantly regulated via autophagy. (A) Inhibition of c-Abl activity by nilotinib induces degradation of α-syn and c-Abl in primary cortical neurons. Primary cultures of cortical neurons were treated with nilotinib or DMSO (negative control). After 16 h of treatment, cells were directly lysed in 2× Laemmli buffer and the proteins were separated using SDS–PAGE and detected by WB analysis using the appropriate antibodies (left-hand-side panel). Actin was used as a loading control. c-Abl and α-syn protein level were evaluated by densitometry quantification (right-hand-side panels). Band intensities were normalized as in the following manner: (c-Abl/actin) or (α-syn/actin). Bars represent the mean ± SD of three independent experiments. *P < 0.05 (Student's t-test: DMSO versus nilotinib treatment). (B) Inhibition of c-Abl activity by nilotinib does not change mRNA levels of α-syn and c-Abl. Primary cultures of cortical neurons were treated with nilotinib or DMSO (negative control). 16 h post-treatment, cells were lysed and mRNA extraction performed. Semiquantitative RT–PCR using specific primers against c-Abl or α-syn followed by agarose gel electrophoresis (left hand panel) demonstrates that c-Abl and α-syn mRNA levels were not changed upon nilotinib treatment. c-Abl and α-syn mRNA level were evaluated by densitometry quantification (right-hand-side panels). The band intensities were normalized using the mRNA level of the housekeeping gene GAPDH: c-Abl/GAPDH or α-syn/GAPDH. The bars represent the mean ± SD of three independent experiments. P > 0.05 (Student's t-test: DMSO versus nilotinib). (C) Inhibition of c-Abl activity by nilotinib induces degradation of α-syn and c-Abl via the autophagy and proteasome pathways. Primary cultures of cortical neurons were treated with nilotinib or DMSO (negative control) for 16 h prior to addition of inhibitors of autophagy (3-MA, Bafilomycin A1), an inhibitor of phagosome-lysosome fusion (NH4Cl) or an inhibitor of proteasome (MG-132) for 6 h. The cells were directly lysed in 2× Laemmli buffer and proteins were separated using SDS–PAGE and detected by WB analysis using the appropriate antibodies (left-hand-side panels). Actin was used as a loading control. c-Abl and α-syn protein levels were evaluated by densitometry quantification (right-hand-side panels). The band intensities were normalized in the following manner: (c-Abl/actin) or (α-syn/actin). The bars represent the mean ± SD of three independent experiments. ANOVA test followed by Tukey–Kramer post hoc test were performed: #P < 0.05 (DMSO versus nilotinib) or *P < 0.05 (nilotinib ± drugs inhibitors).

References

    1. Moresco E.M., Koleske A.J. Regulation of neuronal morphogenesis and synaptic function by Abl family kinases. Curr. Opin. Neurobiol. 2003;13:535–544. - PubMed
    1. Zukerberg L.R., Patrick G.N., Nikolic M., Humbert S., Wu C.L., Lanier L.M., Gertler F.B., Vidal M., Van Etten R.A., Tsai L.H. Cables links Cdk5 and c-Abl and facilitates Cdk5 tyrosine phosphorylation, kinase upregulation, and neurite outgrowth. Neuron. 2000;26:633–646. - PubMed
    1. Jones S.B., Lu H.Y., Lu Q. Abl tyrosine kinase promotes dendrogenesis by inducing actin cytoskeletal rearrangements in cooperation with Rho family small GTPases in hippocampal neurons. J. Neurosci. 2004;24:8510–8521. - PMC - PubMed
    1. Woodring P.J., Litwack E.D., O'Leary D.D., Lucero G.R., Wang J.Y., Hunter T. Modulation of the F-actin cytoskeleton by c-Abl tyrosine kinase in cell spreading and neurite extension. J. Cell Biol. 2002;156:879–892. - PMC - PubMed
    1. Lanier L.M., Gertler F.B. From Abl to actin: Abl tyrosine kinase and associated proteins in growth cone motility. Curr. Opin. Neurobiol. 2000;10:80–87. - PubMed

Publication types

MeSH terms

Substances