. 2014 Feb;11(2):190-6.
doi: 10.1038/nmeth.2804. Epub 2014 Jan 12.

Transcriptome in vivo analysis (TIVA) of spatially defined single cells in live tissue

Affiliations

Transcriptome in vivo analysis (TIVA) of spatially defined single cells in live tissue

Ditte Lovatt et al. Nat Methods. 2014 Feb.

Abstract

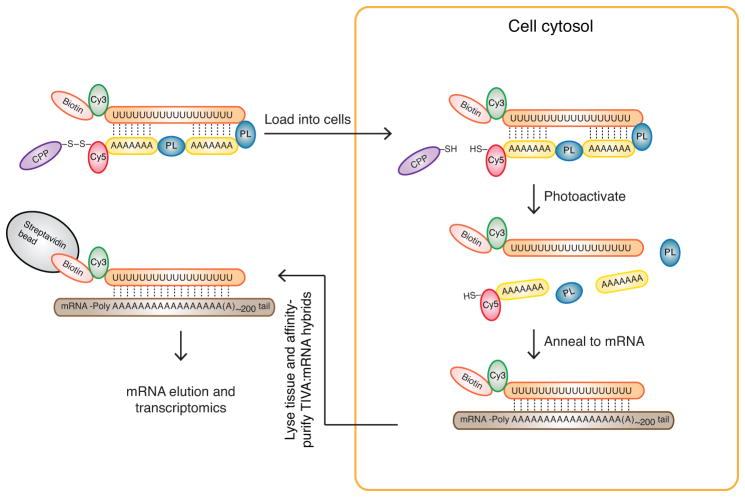
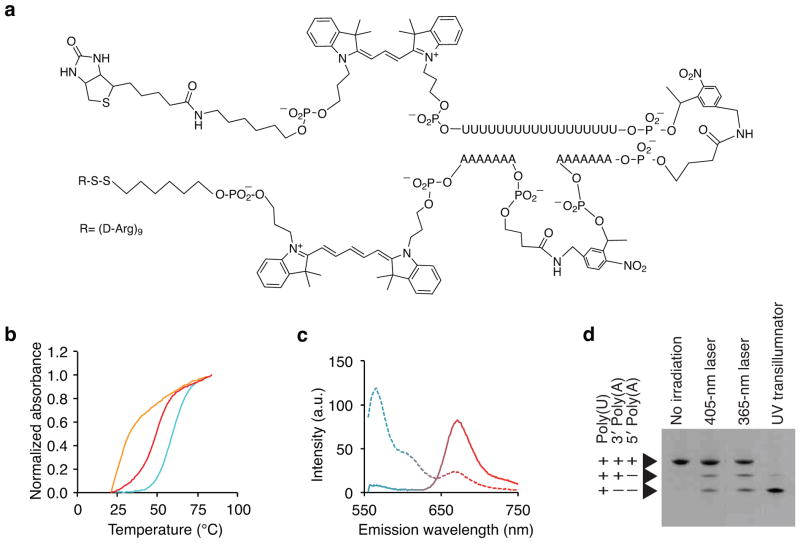
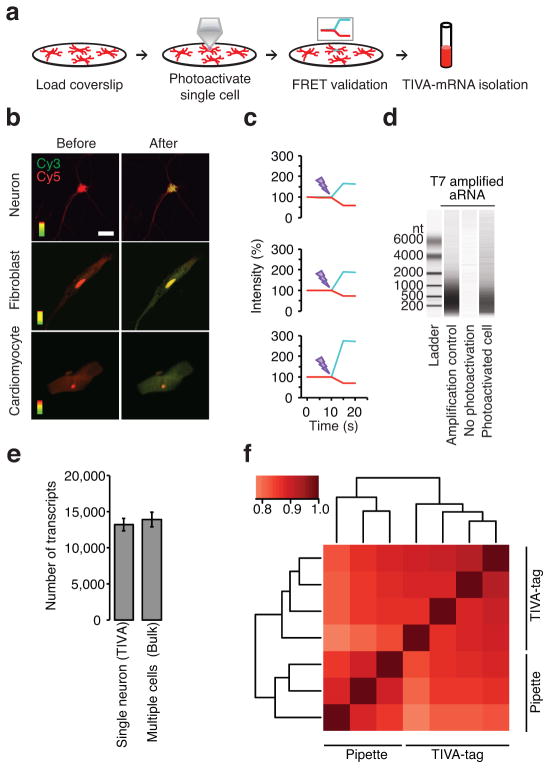
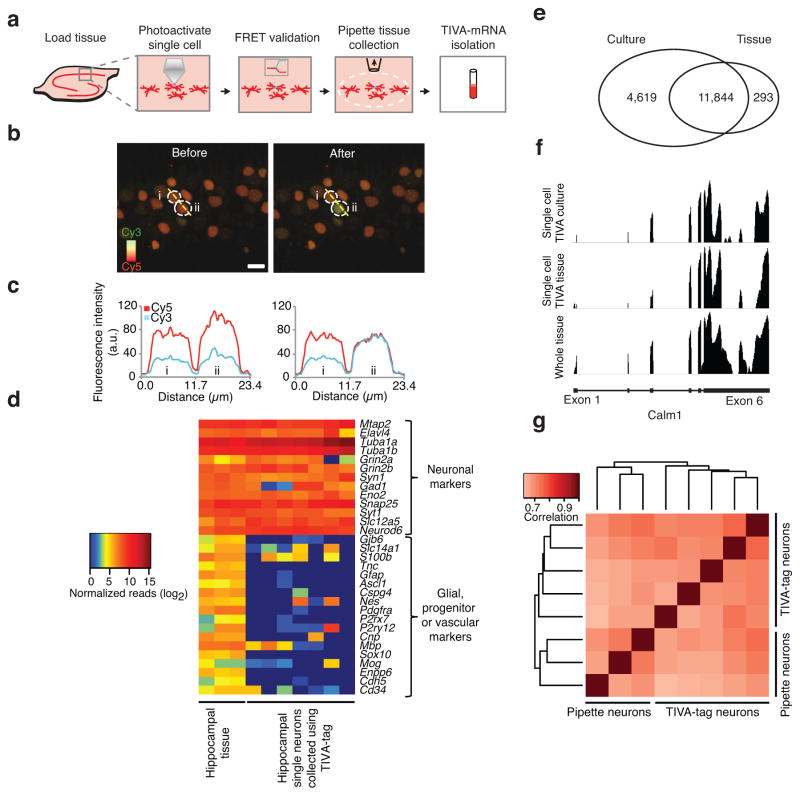
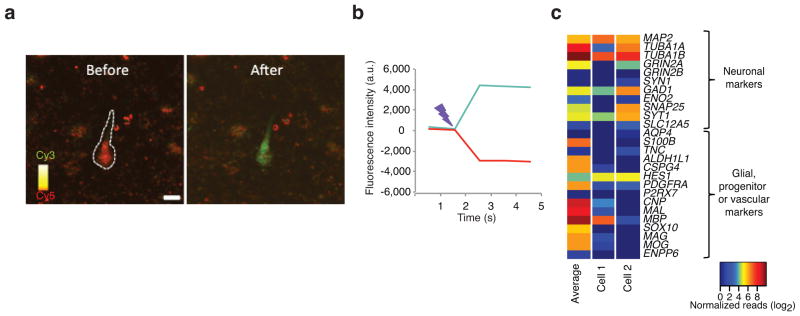
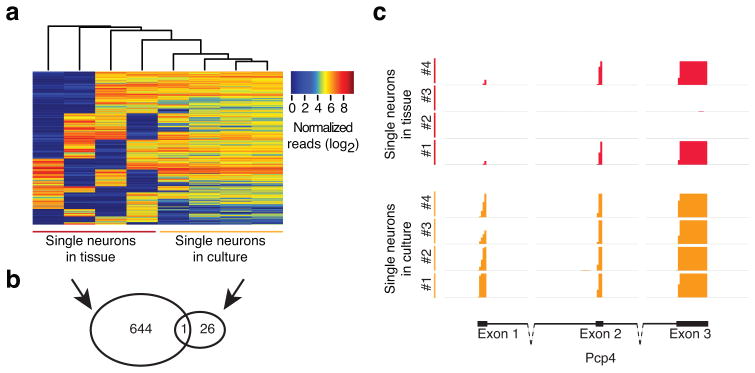
Transcriptome profiling of single cells resident in their natural microenvironment depends upon RNA capture methods that are both noninvasive and spatially precise. We engineered a transcriptome in vivo analysis (TIVA) tag, which upon photoactivation enables mRNA capture from single cells in live tissue. Using the TIVA tag in combination with RNA sequencing (RNA-seq), we analyzed transcriptome variance among single neurons in culture and in mouse and human tissue in vivo. Our data showed that the tissue microenvironment shapes the transcriptomic landscape of individual cells. The TIVA methodology is, to our knowledge, the first noninvasive approach for capturing mRNA from live single cells in their natural microenvironment.


Figures

Figure 1
Figure 1
The TIVA-tag is a multifunctional, caged mRNA-capture molecule. The TIVA-tag is composed of several functional groups; Biotin (pink), Cy3 (green), poly-A tail binding 2′-F RNA poly-U oligo (orange), photocleavable linker (PL, blue), 2′-OMe RNA poly-A oligo (yellow), Cy5 (red), disulfide bond (black), and cell-penetrating peptide (CPP) (purple). The CPP carries the TIVA-tag into cells, where the disulfide bond is cleaved by the intracellular environment, trapping the TIVA-tag inside the cell. Photoactivation by laser is targeted to the cell or cells of interest to uncage the poly-A tail-binding poly-U oligo, since photocleavage of the two PLs reduces the thermal stability of the TIVA-tag. The biotinylated poly-U mRNA capture moiety anneals to the poly-A tail of cellular mRNA (brown). The stable biotinylated poly-U-mRNA hybrid (also referred to as the TIVA-mRNA hybrid) is then affinity purified using streptavidin beads (grey). Following purification, the mRNA is eluted and then amplified for subsequent transcriptome profiling. The Cy3 and Cy5 groups form a FRET pair that allows real time monitoring of cellular uptake as well as uncaging.
Figure 2
Figure 2
Validation of the TIVA-tag in solution. (a) Chemical structure of the TIVA-tag. (b) Thermal denaturation curves of TIVA-tag to determine the melting temperature before (blue) and after (orange) photoactivation (365 nm), and after photoactivation in the presence of 20-mer poly-A RNA to simulate hybridization to mRNA (red) (n = 3). (c) Evaluation of the efficiency of the Cy3-Cy5 FRET pair in TIVA-tag in solution before (solid) and after (dotted) photocleavage given by changes in the Cy3 (blue) and Cy5 (red) emission (n = 3). (d) Denaturing PAGE gel of TIVA-tag without irradiation or with photoactivation at different wavelengths as indicated. Note that incomplete irradiation of lane 2 and 3 results from the laser beam intersecting only a fraction of the droplet. Lane 1: No irradiation; Lane 2: Partial irradiation of droplet for 9 × 101 μs with 405 nm laser at 27 mW; Lane 3: Partial irradiation of droplet for 10 s with 365 nm laser at 50 mW; Lane 4: 15 min irradiation with 365 nm transilluminator (9 mW/cm2).
Figure 3
Figure 3
A Cy3-Cy5 FRET pair enables validation of uptake and uncaging of TIVA-tag in live cells. (a) Schematic showing (i) loading of TIVA-tag into neurons on coverslip, (ii) photoactivation of single cell by laser, (iii) validation of photoactivation by loss of FRET signal, and (iv) affinity-capture of mRNA by the TIVA-tag. (b) (D-Arg)9-labeled TIVA-tag was taken up by neurons, fibroblasts, and cardiomyocytes. TIVA-tag without a CPP did not enter cells (data not shown). The entire area of the cell was photoactivated by laser. Scale bar 20 μm. (c) Photoactivation resulted in loss of FRET (red, Cy5; blue, Cy3). (d) Bioanalyzer analysis validated the quantity and sizes of aRNA from coverslips with and without a photoactivated cell. (e) Expressed transcripts were defined as those with greater than 10 unique exon reads per transcript using normalized RNA-seq data (mean ± STDV). (f) Heatmap of spearman correlation coefficients among single cells collected with pipette or TIVA-tag performed using normalized log2 read count data.
Figure 4
Figure 4
TIVA-tag enables mRNA capture from single neurons without contamination from neighboring cells in hippocampal slices. (a) Schematic showing (i) loading of TIVA-tag into live neurons in hippocampal slice, (ii) photoactivation of single cell, (iii) validation of uncaging by FRET, (iv) isolation of the stimulated area and (v) TIVA-mRNA affinity isolation. (b) Uncaging of TIVA-tag in a single neuron does not affect FRET in the adjacent neuron. The resting FRET signal was recorded in two neurons in hippocampus CA1 area outlined by dotted white lines and labeled “i” and “ii”. Cy3 is pseudocolored green and Cy5 is psedocolored red. The Cy5 signal is generated as a FRET signal from Cy3 emission at 514nm activating Cy5 fluorescence. Upon photoactivation the amount of red fluorescence decreases and the green signal increases as the FRET is reduced with the overlap being yellow. (c) Cy3 and Cy5 fluorescence signals in neurons “i” and “ii” were quantified using a line scan intersecting both cells. Upon uncaging neuron “ii”, the FRET signal only changes in neuron “ii” while not affecting adjacent neuron “i”. Images were captured as Z-stack (14 sections in 10 μm ranges, uncaging was performed in the middle of image stack) and merged as top-view for analysis. Color scale, Cy3: green; Cy5: red; Scale bar: 10 μm. (d) Heat map of expressed neuronal, glial, progenitor and vascular markers transcripts using normalized RNA-seq data. (e) Venn diagram showing overlap of expressed transcripts between single neurons collected using TIVA-tag in tissue versus in culture. Expressed transcripts were defined as those with at least 10 unique exon reads per transcript in at least one sample within its group using normalized RNA-seq data. (f) RNA-seq pileup of unique exon reads aligning to the transcript Calm1 (4107 bp) in samples from single cell TIVA culture (vertical label: 0–307), single cell TIVA tissue (vertical label: 0–147), and in whole tissue (vertical label: 0–531). Calm1 gene structure shown at bottom depicts exon 1 (left) through exon 6 (right) (horizontal label) (blocks, exons; solid lines, introns). (g) Heat map of Spearman correlation coefficients between pipette and TIVA-tag collected single hippocampal neurons in tissue.
Figure 5
Figure 5
TIVA-tag capture of mRNA from cells in human live brain tissue. A tissue specimen was obtained from biopsy of the right frontal cortex from a communicating subject undergoing surgery for hydrocephalus. Briefly, (a) loaded cells were identified by FRET signal. (b) The uncaging was performed using the same parameters as in mouse. Color scale, Cy3: green; Cy5: red; Scale bar: 10 μm. (c) A heat map comparing the gene expression of common cell type markers in an average pool of 13 TIVA-tag captured cells and in two TIVA-tag captured individual cells.
Fig. 6
Fig. 6
Single hippocampal neurons demonstrate wider range of expression across single cells, and more bimodal transcripts than cultured cells. (a) Clustering of 645 bimodal genes in single cell TIVA tissue samples as compared to single cell TIVA culture samples. Bimodal genes were defined as having a gap in expression of at least four log units in two samples. In addition, two samples were required to have expression values on either side of this gap, and samples with low expression were required to have fewer than 10 normalized counts. (b) A Venn diagram showing the overlap between bimodal genes found in single neurons from tissue and from culture. (c) RNA-seq pileup of unique exon reads aligning to Pcp4, a bimodal gene among single cell TIVA tissue cells, n=4 (red), and not among single cell TIVA culture cells, n=4 (orange). Pcp4 gene structure shown at bottom depicts exon 1 through 3 (blocks, exons; solid lines, introns; dotted lines, part of intron not shown at relative length). Vertical axis range for all samples: 0–3.0.

Comment in

Similar articles

Cited by

References

    1. Kaern M, Elston TC, Blake WJ, Collins JJ. Stochasticity in gene expression: from theories to phenotypes. Nature Rev Genet. 2005;6:451–464. doi: 10.1038/nrg1615. - DOI - PubMed
    1. Raj A, van Oudenaarden A. Nature, nurture, or chance: stochastic gene expression and its consequences. Cell. 2008;135:216–226. doi: 10.1016/j.cell.2008.09.050. - DOI - PMC - PubMed
    1. Eldar A, Elowitz MB. Functional roles for noise in genetic circuits. Nature. 2010;467:167–173. doi: 10.1038/nature09326. - DOI - PMC - PubMed
    1. Elowitz MB, Levine AJ, Siggia ED, Swain PS. Stochastic gene expression in a single cell. Science. 2002;297:1183–1186. doi: 10.1126/science.1070919. - DOI - PubMed
    1. Flatz L, et al. Single-cell gene-expression profiling reveals qualitatively distinct CD8 T cells elicited by different gene-based vaccines. Proc Natl Acad Sci U S A. 2011;108:5724–5729. doi: 10.1073/pnas.1013084108. - DOI - PMC - PubMed

Publication types

Associated data