. 2014 Jan 13;33(2):157-70.
doi: 10.1002/embj.201386120. Epub 2014 Jan 10.

Proteomic screening of glutamatergic mouse brain synaptosomes isolated by fluorescence activated sorting

Affiliations

Proteomic screening of glutamatergic mouse brain synaptosomes isolated by fluorescence activated sorting

Christoph Biesemann et al. EMBO J. .

Abstract

For decades, neuroscientists have used enriched preparations of synaptic particles called synaptosomes to study synapse function. However, the interpretation of corresponding data is problematic as synaptosome preparations contain multiple types of synapses and non-synaptic neuronal and glial contaminants. We established a novel Fluorescence Activated Synaptosome Sorting (FASS) method that substantially improves conventional synaptosome enrichment protocols and enables high-resolution biochemical analyses of specific synapse subpopulations. Employing knock-in mice with fluorescent glutamatergic synapses, we show that FASS isolates intact ultrapure synaptosomes composed of a resealed presynaptic terminal and a postsynaptic density as assessed by light and electron microscopy. FASS synaptosomes contain bona fide glutamatergic synapse proteins but are almost devoid of other synapse types and extrasynaptic or glial contaminants. We identified 163 enriched proteins in FASS samples, of which FXYD6 and Tpd52 were validated as new synaptic proteins. FASS purification thus enables high-resolution biochemical analyses of specific synapse subpopulations in health and disease.


Figures
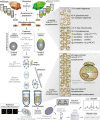
Figure 1
Figure 1
Overview of the FASS protocol. Wild-type and VGLUT1VENUS forebrains were dissected, homogenized, and subjected to subcellular fractionation yielding the synaptosome fraction (B).H, homogenate; P1, pellet 1; S1, supernatant 1; P2, pellet 2; S2, supernatant 2 (for details see Materials and Methods). All particles of the synaptosomal fraction were then stained with FM4-64, which was used to trigger detection of particles in the sorter. Wild-type samples were used to determine the level of autofluorescence in the VENUS channel. Only fluorescent particles brighter than autofluorescence were sorted in the VGLUT1VENUS samples. Drops that contained contaminating particles were discarded as waste. The FASS sample was collected by filtration or centrifugation, depending on the subsequent analysis. Intact VGLUT1VENUS-positive synaptosomes were composed of a fragment of the postsynapse, a presynaptic active zone, SVs, and mitochondria. FASS samples were analyzed by immunofluorescence or electron microscopy, Western blotting, and proteomic techniques. The higher purity of FASS-purified VGLUT1VENUS-positive synaptosomes is illustrated schematically.
Figure 2
Figure 2
Analysis and gating of VGLUT1VENUS-positive synaptosomes. Representative flow-cytometry data. Each plot shows 100,000 events. A FM4-64 lipophilic styryl dye labeling of synaptosomes to trigger the detection of microparticles. Confocal microscopy images of FM4-64-stained VGLUT1VENUS S-synaptosomes. Note the more homogeneous size range of VGLUT1venus particles. Scale bar, 2 μm. B Fluorescence triggering of FM4-64-stained synaptosomal particles with a threshold set to block out buffer background. C, C1 Analysis of WT synaptosomes determines the level of autofluorescence in the VENUS channel. D, D1 Analysis of VGLUT1VENUS samples. Only particles of the combined ‘small size’ and ‘sorted fluorescence’ gates were sorted and reanalyzed. E Comparison of WT and VGLUT1VENUS distributions of fluorescent signals. The fluorescence threshold for the ‘total fluorescence’ gate is the same as for the ‘sorted fluorescence’ gate. F, F1 Reanalysis of a non-selective sort of all particles. G, G1 Reanalysis of sorted fluorescent VGLUT1VENUS-positive particles of small size. Note the homogeneous light scattering of this particle population and the significant shift toward high VENUS fluorescence signals. H Comparison of the distributions of fluorescence signals of all particles versus fluorescent particles. Data information: In the contour plots (C–G), contour lines mark differences of 10% probability, and outliers with a probability of <5% are plotted as dots. For each gate the percentages given are the average of four independent experiments. +/− errors indicate the average deviation from the mean.
Figure 3
Figure 3
Characterization of FASS VGLUT1VENUS-positive synaptosomes. A Representative Western blot profiles of S-synaptosomes (0.25–1 μg) and FASS VGLUT1VENUS synaptosomes (∼0.5 μg). In some cases, lanes from the same blot were rearranged for presentation (white separators). VGLUT1/2, vesicular glutamate transporter 1/2; VDAC, voltage-dependent anion channel; IBA1, ionized calcium binding adaptor molecule 1; GLT1, glutamate transporter 1; PLP, myelin proteolipid protein; DM20, isoform DM20 of myelin proteolipid protein; VIAAT, vesicular inhibitory amino acid transporter; VAChT, vesicular acetylcholine transporter; VAMP2, vesicle-associated membrane protein 2. B, C Quantification of Western blots series shown in (A). Data are represented as the co-enrichment factor (CF) ± s.e.m. for each protein, relative to the enrichment of VGLUT1VENUS in the sorted versus unsorted sample. Asterisks indicate significant pairwise differences in a one-sided t-test (P < 0.05). n, number of independent experiments. D Representative immunofluorescence micrographs of sorted VGLUT1VENUS-positive synaptosomes stained for VGLUT1VENUS (anti-GFP; note the 0.5–1.5 μm expected size range) and VIAAT. Scale bar, 1 μm. E Quantification of VGLUT1VENUS/VIAAT double positive particles (see D). One hundred and sixty-five GFP-positive particles from one FASS experiment (N = 1; n = 165). F–I A non-selective sort of all particles was compared to FASS-purified VGLUT1VENUS-positive synaptosomes by ultrastructural analysis on the collection filters (see Fig 2D–F). Electron micrographs allowed the identification of synaptosomes (F and H) or material classified collectively as debris (G). Filters were imaged and analyzed systematically by an observer blinded to the experimental condition. Synaptosomal and debris structures were manually outlined and quantified using ImageJ (I). Note that the number of synaptic profiles is doubled and their relative surface area is increased 4.87-fold in the FASS-purified sample.
Figure 4
Figure 4
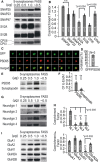
High-resolution delineation of the synaptic compartment in VGLUT1venus FASS purified synaptosomes. A, B Analysis of the co-enrichment of several presynaptic protein isoforms. SNAP23/25/47, synaptosomal associated protein of 23/25/47 kDa; SV2A/B, synaptic vesicle protein 2A/B; n.s., not significant. n, number of independent experiments. C Representative immunofluorescence micrographs of sorted VGLUT1VENUS-positive synaptosomes stained for VGLUT1VENUS (anti-GFP) and PSD95. VGLUT1VENUS is usually associated with the staining of postsynaptic PSD95. Scale bar, 1 μm. D Quantification of PSD95/VGLUT1venus apposition in 485 GFP-positive particles from three independent FASS experiments (see C; n = 485; N = 3). E, F Analysis of PSD95 and Synaptopodin1 enrichments by Western blot (E) and corresponding quantifications (F). G, H Analysis of co-enrichment of the four Neuroligin isoforms (NL1-4) in the sorted VGLUT1VENUS-positive synaptosomes by Western blot (G) and the corresponding quantification (H). n, number of independent experiments. I, J Analysis of co-enrichment of several subunits of postsynaptic glutamate receptors in the sorted VGLUT1VENUS-positive synaptosomes by Western blot (I) and the corresponding quantification (J). White separators indicate when lanes from the same blot were rearranged for presentation. n, number of independent experiments.
Figure 5
Figure 5
Figure 5. Comparative proteomic analysis of S-synaptosomes and FASS purified VGLUT1VENUS-positive synaptosomes.
  1. Following SDS-PAGE and tryptic digestion, proteins of both samples were analyzed by high-resolution tandem MS. The enrichment and depletion of proteins in sorted versus unsorted synaptosomes were determined by spectral counting using Scaffold. Of 1,075 quantified proteins, 163 were enriched by a factor of two or more, while 343 were depleted by a factor of two or more (listed in supplementary Tables S1–S3).

  2. Fold change of protein spectral counts between the FASS-purified and S-synaptosomes for selected targets that were also analyzed by Western blotting (see Figs 4). Fold depletion is plotted as negative values and fold enrichment as positive values.

  3. Spectral countings were compared with mRNA expression data of neurons, oligodendrocytes, and astrocytes (Cahoy et al, 2008). Relative contributions of genes with maximal expression in neurons (Nmax, NmaxA, NmaxO), astrocytes (Amax, AmaxN, AmaxO) and oligodendrocytes (Omax, OmaxN, OmaxA) are plotted as percentages of differentially expressed genes (see supplementary Fig S2 for detailed clusters). Among astrocyte and oligodendrocyte genes, percentages of genes classified to have relatively high expression in neurons are also plotted (e.g. AmaxN/(Amax+AmaxN+AmaxO); OmaxN/(Omax+OmaxN+OmaxA)).

  4. Subcellular localizations of the 163 proteins enriched twofold or more in FASS samples.

  5. Cellular functions of the 163 proteins enriched twofold or more in FASS samples.

Figure 6
Figure 6
FXYD6 and Tpd52 are localized to VGLUT1-positive synapses. A Regional distribution of FXYD6 in adult mouse brain homogenates. ob, olfactory bulb; ctx, cerebral cortex; cp, caudate-putamen; hc, hippocampus; th, thalamus; hy, hypothalamus; cb, cerebellum; bs, brainstem. B FXYD6, VGLUT1, GluN1 distribution in subcellular fractions of mouse brain. Note that FXYD6 is markedly enriched in the synaptic plasma membrane fraction LP1B. H,homogenate; P1, nuclear pellet; S1, supernatant 1; P2, crude synaptosomes; S2, supernatant 2; P3, microsomal fraction; S3, somatic soluble fraction; LP1, lysed P2 pellet 1; LP1A, myelin-rich light membrane fraction; LP1B, synaptic plasma membrane fraction; LP2, crude SVs; LS2, soluble synaptic fraction. C FXYD6 enrichment in sorted VGLUT1VENUS synaptosomes by Western blot analysis. The average CF of 0.97 for FXYD6 with VGLUT1 in FASS-purified synaptosomes indicates a high rate of copurification of the two markers. The error bar indicates the s.e.m. n, independent experiments. D Immunofluorescence of FXYD6 (red), VGLUT1 (green), and PSD95 (blue) in primary cultured hippocampal neurons. Scale bars, 2 μm in overviews and 0.4 μm for enlarged images. E, F Pre-embedding immunoelectron microscopy of ultrathin sections of mouse hippocampus using the anti-FXYD6 antibody. HPC, hippocampus; t, terminal; a, axon; d, dendrite. Double arrows mark synaptic contacts. Scale bars, 0.5 μm (E and F). G Western blot analysis of the distribution of Tpd52 in homogenates of different brain regions of adult mice. ob, olfactory bulb; ctx, cerebral cortex; cp, caudate-putamen; hc, hippocampus; th/hy, thalamus and hypothalamus; mb, mid brain including colliculi, substantia nigra and ventral tegmental area; cb, cerebellum, bs, brainstem; sc, spinal cord. H Western blot analysis of Tpd52 in subcellular fractions of mouse brain. Samples used here are identical to those employed in (B). I Representative immunofluorescence micrographs of sorted VGLUT1VENUS-positive synaptosomes stained for VGLUT1VENUS (anti-GFP) and Tpd52. Scale bar, 1 μm. J Quantification of VGLUT1VENUS/Tpd52 double positive particles (see C). A total of 168 GFP-positive particles from one FASS experiment were analyzed (n = 168; N = 1). K Triple immunofluorescence staining for VGLUT1 (green), Tpd52 (red), and PSD95 (blue) in cultured primary hippocampal neurons (DIV22). Arrowheads mark examples of co-localization of Tpd52 with VGLUT1 or PSD95. Scale bar, 1 μm in enlarged images and 6 μm for overviews.

References

    1. Abul-Husn NS, Devi LA. Neuroproteomics of the synapse and drug addiction. J Pharmacol Exp Ther. 2006;318:461–468. - PubMed
    1. Al-Hallaq RA, Yasuda RP, Wolfe BB. Enrichment of N-methyl-d-aspartate NR1 splice variants and synaptic proteins in rat postsynaptic densities. J Neurochem. 2001;77:110–119. - PubMed
    1. Bai F, Witzmann FA. Synaptosome proteomics. Subcell Biochem. 2007;43:77–98. - PMC - PubMed
    1. Bajjalieh SM, Frantz GD, Weimann JM, McConnell SK, Scheller RH. Differential expression of synaptic vesicle protein 2 (SV2) isoforms. J Neurosci. 1994;14:5223–5235. - PMC - PubMed
    1. Bard L, Groc L. Glutamate receptor dynamics and protein interaction: lessons from the NMDA receptor. Mol Cell Neurosci. 2011;48:298–307. - PubMed

Publication types