

Structural basis for microtubule recognition by the human kinetochore Ska complex
- PMID: 24413531
- PMCID: PMC3923297
- DOI: 10.1038/ncomms3964
Structural basis for microtubule recognition by the human kinetochore Ska complex
Abstract
The ability of kinetochores (KTs) to maintain stable attachments to dynamic microtubule structures ('straight' during microtubule polymerization and 'curved' during microtubule depolymerization) is an essential requirement for accurate chromosome segregation. Here we show that the kinetochore-associated Ska complex interacts with tubulin monomers via the carboxy-terminal winged-helix domain of Ska1, providing the structural basis for the ability to bind both straight and curved microtubule structures. This contrasts with the Ndc80 complex, which binds straight microtubules by recognizing the dimeric interface of tubulin. The Ska1 microtubule-binding domain interacts with tubulins using multiple contact sites that allow the Ska complex to bind microtubules in multiple modes. Disrupting either the flexibility or the tubulin contact sites of the Ska1 microtubule-binding domain perturbs normal mitotic progression, explaining the critical role of the Ska complex in maintaining a firm grip on dynamic microtubules.
Figures
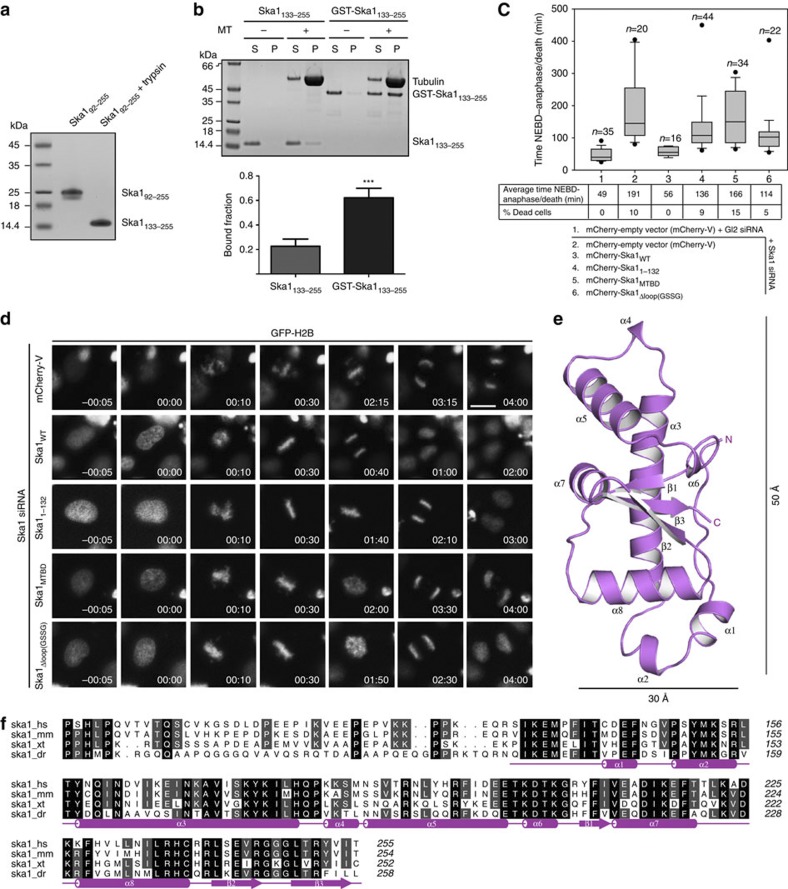
 0.001, t-test). (c) Box-and-whisker plot showing the elapsed time (min) between nuclear envelope breakdown (NEBD) and anaphase onset/death for individual cells. The total number of cells (n) from two or more independent experiments is given above each box. Lower and upper whiskers represent 10th and 90th percentiles, respectively. Table summarizing information from the live cell experiments shown below regarding the average time in mitosis (from NEBD until anaphase onset/cell death) and the percentage of cells dying in mitosis. (d) Representative stills from time-lapse video-microscopy experiments illustrating mitotic progression of HeLa S3 cells stably expressing histone H2B-GFP treated as in c. Time in h:min is indicated. T=0 was defined as the time point at which NEBD became evident. Scale bar, 10 μm. (e) Cartoon representation of the structure of human Ska1–MTBD, which possesses a modified winged-helix domain with an elongated shape. The length of the structure is ~50 Å whereas the width is ~30 Å. Secondary structure elements are labelled. (f) Sequence alignment of human Ska191–255 showing amino acid conservation between H. sapiens (hs), Mus musculus (mm), Xenopus tropicalis (xt) and Danio rerio (dr). Secondary structure elements are shown below the aligned sequences. Amino acid conservation is highlighted in grey.
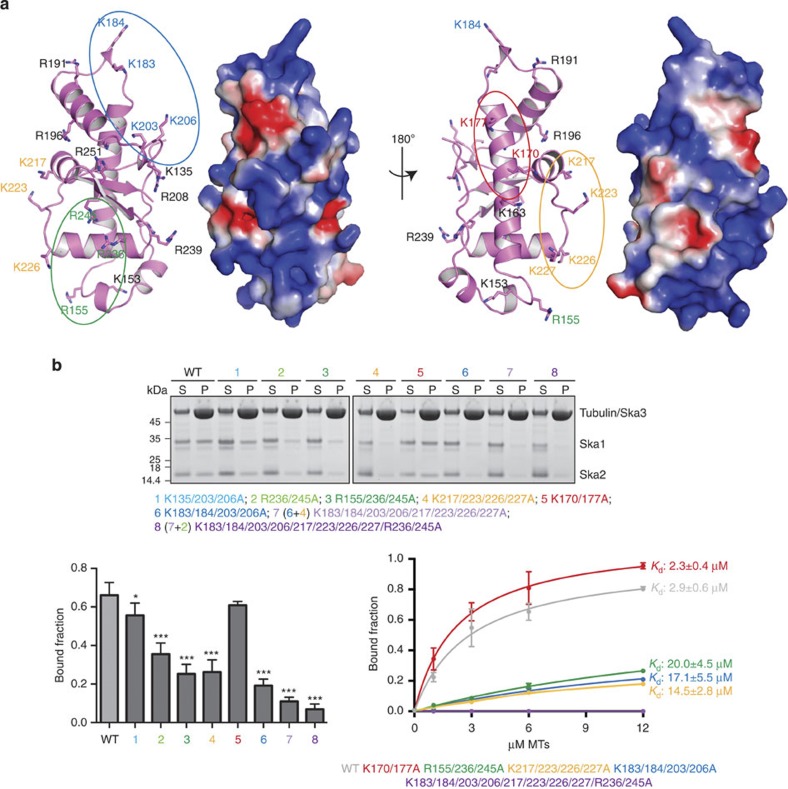
 3, *P0.05, ***P0.001; t-test; right bottom panel). Kd values were calculated using 1 μM Ska and 0–12 μM MTs (bottom left panel). Uncropped scans of the gels are shown in Supplementary Fig. S8b.
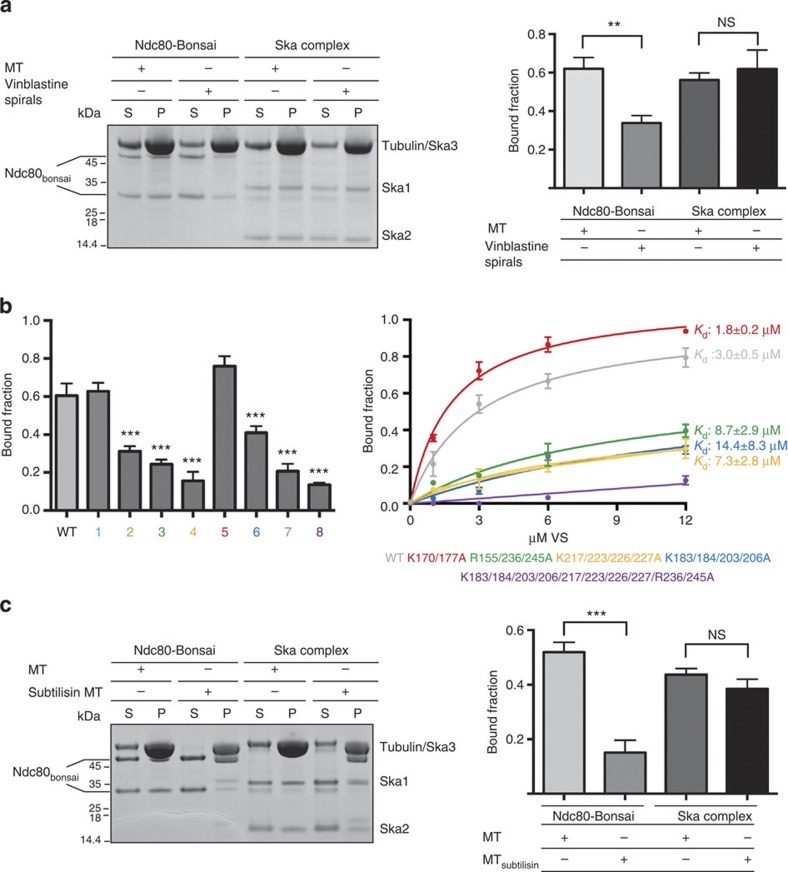 3, ***P0.001; t-test). Kd values were calculated using 1 μM Ska and 0–12 μM vinblastine spirals (left panel). (c) Left, representative SDS–PAGE. Right, quantification of MT cosedimentation assays with Ndc80 and Ska complexes (1 μM) binding to MTs or subtilisin-treated MTs (6 μM; mean±s.d., n3, ***P0.001; t-test). Uncropped scans of the gels are shown in Supplementary Fig. S8c.
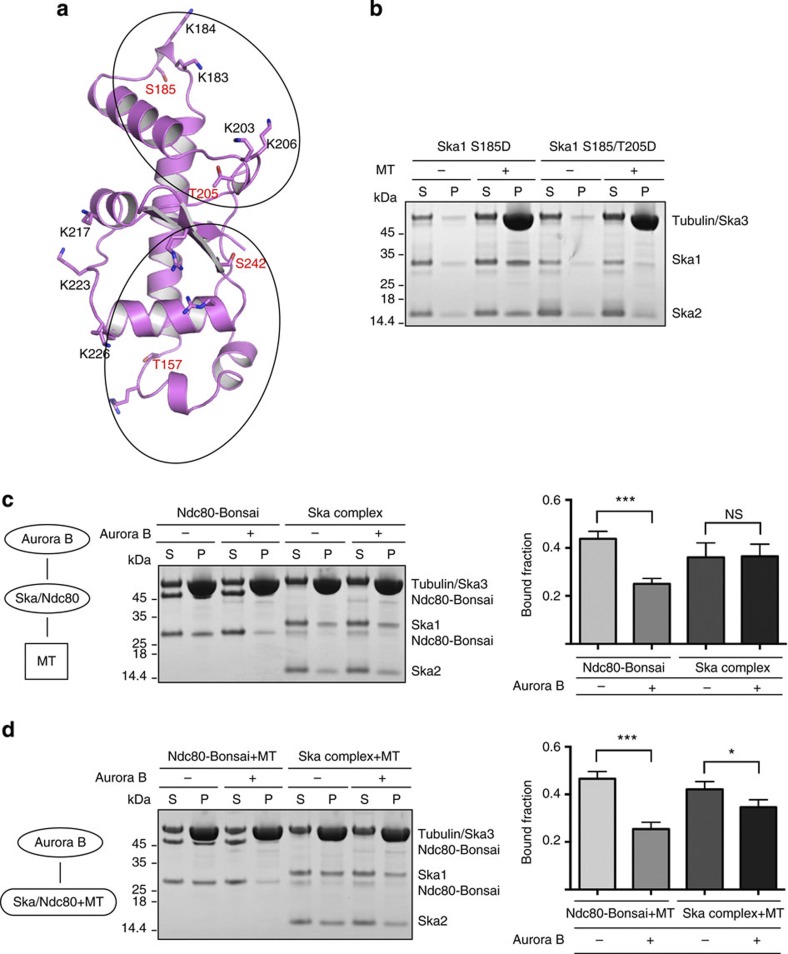 3, *P0.05, ***P0.001; t-test). Uncropped scans of the gels are shown in Supplementary Fig. S8d.
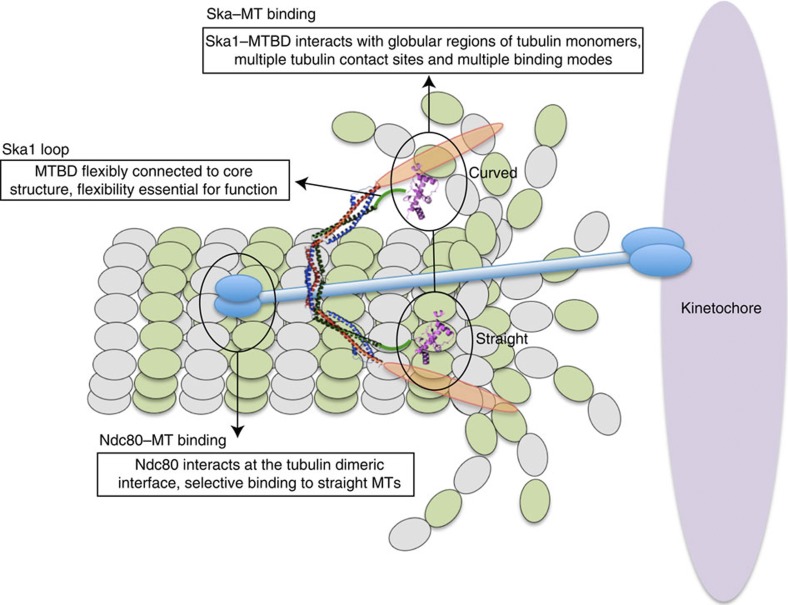
References
Publication types
MeSH terms
Substances
Grants and funding
LinkOut - more resources
Full Text Sources
Other Literature Sources
Molecular Biology Databases
