. 2014 Apr;42(6):3551-64.
doi: 10.1093/nar/gkt1358. Epub 2014 Jan 9.

CpG domains downstream of TSSs promote high levels of gene expression

Affiliations

CpG domains downstream of TSSs promote high levels of gene expression

Simone Krinner et al. Nucleic Acids Res. 2014 Apr.

Abstract

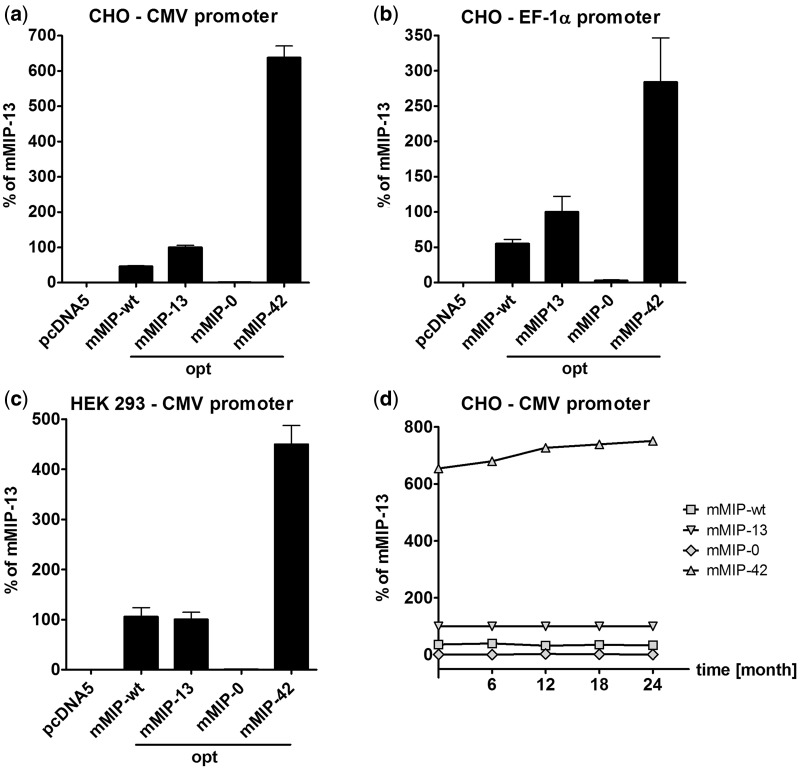
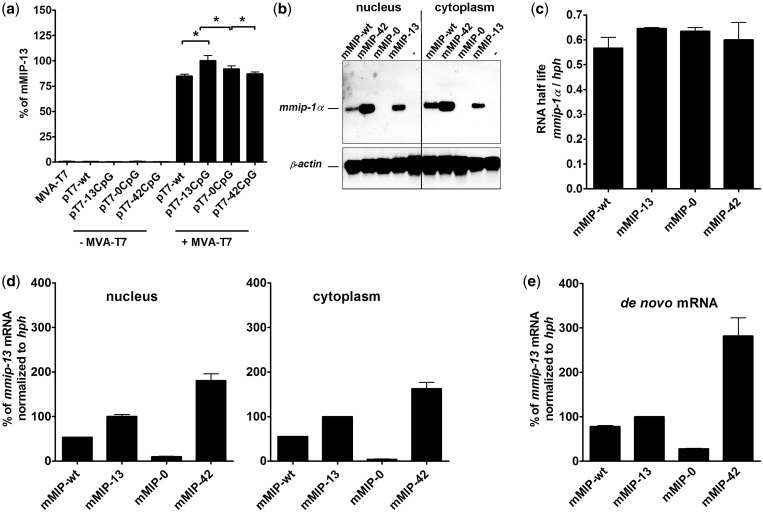
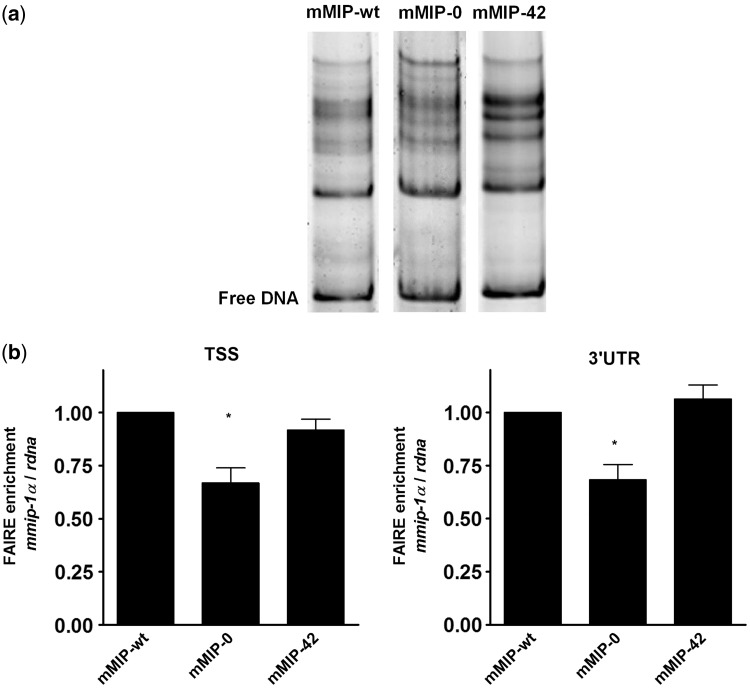
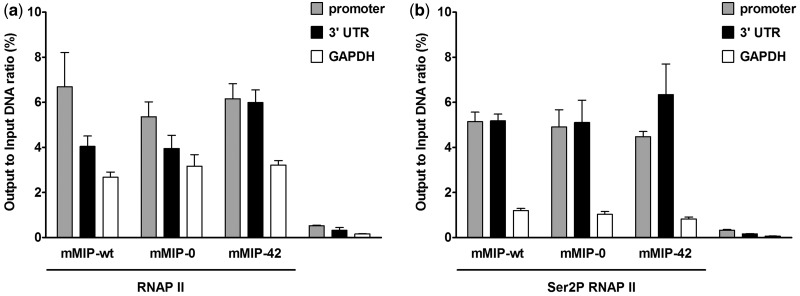
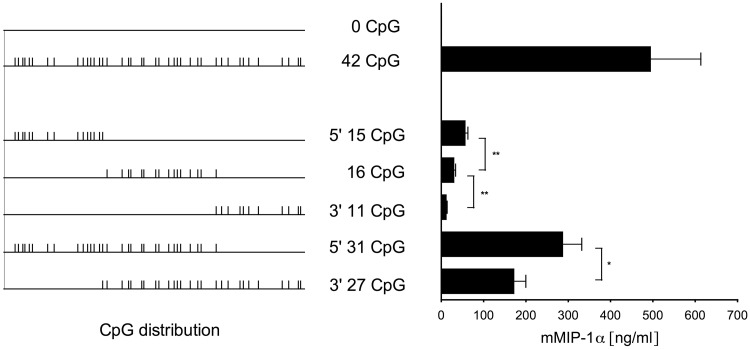
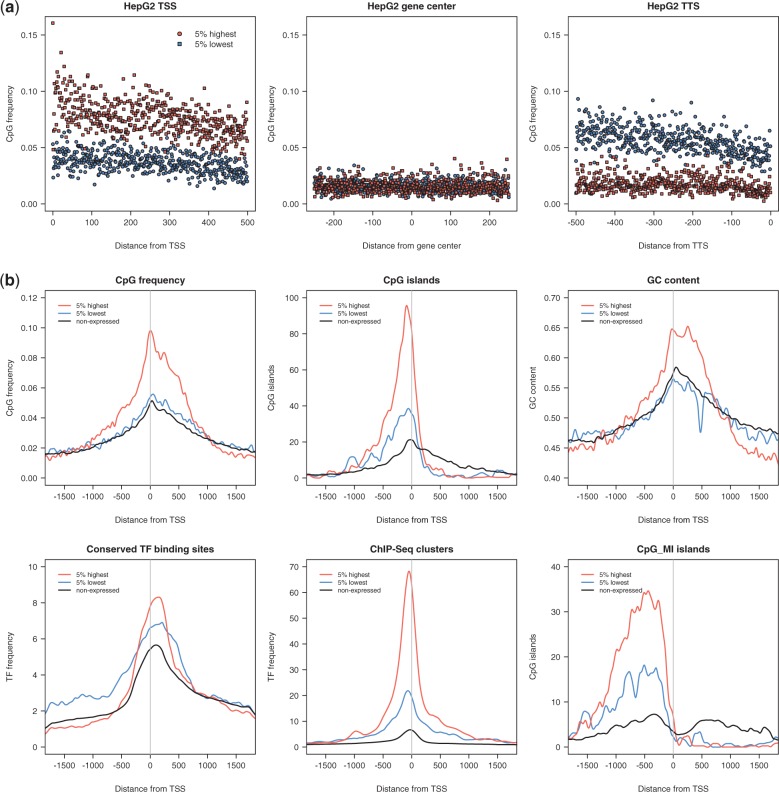
CpG dinucleotides are known to play a crucial role in regulatory domains, affecting gene expression in their natural context. Here, we demonstrate that intragenic CpG frequency and distribution impacts transgene and genomic gene expression levels in mammalian cells. As shown for the Macrophage Inflammatory Protein 1α, de novo RNA synthesis correlates with the number of CpG dinucleotides, whereas RNA splicing, stability, nuclear export and translation are not affected by the sequence modification. Differences in chromatin accessibility in vivo and altered nucleosome positioning in vitro suggest that increased CpG levels destabilize the chromatin structure. Moreover, enriched CpG levels correlate with increased RNA polymerase II elongation rates in vivo. Interestingly, elevated CpG levels particularly at the 5' end of the gene promote efficient transcription. We show that this is a genome-wide feature of highly expressed genes, by identifying a domain of ∼700 bp with high CpG content downstream of the transcription start site, correlating with high levels of transcription. We suggest that these 5' CpG domains are required to distort the chromatin structure and to increase gene activity.


Figures

Figure 1.
Figure 1.
Influence of intragenic CpG content on mMIP-1α expression by different promoters and in different mammalian cell lines. Quantification of mMIP-1α levels by ELISA in the cell culture supernatants of (a) CHO Flp-In cells—mMIP-1α expression controlled by the CMV promoter; (b) CHO Flp-In cells—mMIP-1α expression controlled by the EF-1α promoter; and (c) HEK 293 Flp-In cells—mMIP-1α expression controlled by the CMV promoter. Protein levels were expressed as percentage of the codon optimized mMIP-13. Standard deviations are indicated by error bars and result from duplicates each (a, b, c). pcDNA5 without insert served as negative control. (d) Expression of mMIP-1α variants controlled by the CMV promoter in stably transfected CHO Flp-In cells was monitored over the period of 2 years.
Figure 2.
Figure 2.
Influence of intragenic CpG content on post-transcriptional mechanisms and translational efficiency (a) mMIP-1α quantification by ELISA of the supernatant of 293T cells infected with MVA-T7 and transfected with pT7-mMIP-wt, −13, −0 and −42. Standard deviations indicate the mean of three independent experiments. Statistics were calculated by unpaired two-tailed t-test, P < 0.05. (b) Northern blot analysis of mmip-1α variants stably expressed in CHO Flp-In cells. ß-actin was used as loading control. One representative experiment is shown. (c) Influence of intragenic CpG content on RNA half-live. Stably transfected CHO Flp-In cell lines were incubated with Actinomycin D and total RNA was isolated and quantified by RT-qPCR. The mean and standard deviation of three measurements is shown. (d) Influence of CpG content on steady state RNA levels. Cytoplasmic and nuclear RNA fractions prepared from stably transfected CHO Flp-In cells were subjected to RT-qPCR. The amount of mmip-1α-specific transcripts was normalized to hph. The mean and standard deviation of triplicates is shown. (e) Influence of CpG content on de novo synthesis of mmip-1α transcripts as quantified by a nuclear run-on assay. The mean and standard deviation of two independent experiments is shown.
Figure 3.
Figure 3.
Influence of intragenic CpG content on nucleosome positioning and chromatin accessibility. (a) Nucleosome positioning of mmip-wt, mmip-0 and mmip-42 in vitro. Fluorescently labeled PCR fragments of mmip-wt (DY550), mmip-0 (DY550) and mmip-42 (DY647) were reconstituted to mononucleosomes by salt dialysis, followed by PAGE and detection by fluorescence imaging. One representative reconstitution is shown. (b) Chromatin accessibility of mmip-1α variants stably expressed in HEK 293 Flp-In cells as analysed by FAIRE. Enrichment for nucleosome-depleted chromatin by FAIRE extraction was quantified by qPCR at the TSS and 3′ UTR of mmip-1α variants relative to rdna and normalized to mmip-wt. Data are presented as the ratio of DNA recovered from cross-linked cells divided by the amounts of the same DNA in the corresponding non-cross-linked samples. The mean and standard deviation of three independent FAIRE preparations each is shown. Statistics were calculated by one-way ANOVA Tukey’s multiple comparison test, P < 0.05).
Figure 4.
Figure 4.
RNAP II (a) and Ser2P RNAP II (b) binding at the promoter and 3′ UTR of mmip-1α variants analysed by ChIP. ChIP was performed by cross-linking of HEK 293 Flp-In cells stably expressing mmip-1α variants, sonication, incubation with the appropriate antibody and collection of bound DNA by sepharose A beads. Precipitated DNA was quantified at the promoter and 3′ UTR of mmip-wt, mmip-0 and mmip-42. The first exon–intron-junction of gapdh was used as internal control. Results were expressed as input to output ratio. Polyclonal rabbit Anti-FLAG antibody served as a negative control. The mean and standard deviation of three independent experiments each is shown.
Figure 5.
Figure 5.
Expression levels of mmip-1α chimera. Expression of mmip-1α chimera in stably transfected CHO Flp-In cells was analysed by ELISA. The mean and standard deviation of triplicates is shown. Statistics were calculated by unpaired two-tailed t-test, *P < 0.05; **P < 0.005.
Figure 6.
Figure 6.
Genome-wide correlation of CpG frequency and expression levels. (a) CpG frequency of the 5% highest and 5% lowest expressed genes in HepG2 cells. Frequencies are exemplarily displayed within the first 500 bp, starting from the TSS, +/– 250 bp around the gene center and the last 500 bp of all genes, ending with the TTS. Every symbol indicates the CpG frequency at the corresponding position. At the TSS, the CpG frequency of high expressed genes is up to 2-fold higher compared to low expressed genes. The occurrence of CpG dinucleotides decreases toward the gene center and stays at a low level for highly expressed genes, whereas low expression correlates to increased CpG values around the TTS. (b) Frequency of CpG dinucleotides, CpG islands, GC content, conserved binding sites for TFs and actual binding of TFs as determined by ChIP-Seq (ChIP-Seq clusters) of the 5% highest, the 5% lowest and all non-expressed genes in HeLa cells. Displayed are regions of +/– 1700 bp around the TSS and frequencies are calculated in 10 bp intervals. Tracks for sequence elements were downloaded from the ENCODE consortium. CpG islands were additionally classified by the CpG_MI algorithm (35).

References

    1. Welch M, Villalobos A, Gustafsson C, Minshull J. Designing genes for successful protein expression. Methods Enzymol. 2011;498:43–66. - PubMed
    1. Maertens B, Spriestersbach A, von Groll U, Roth U, Kubicek J, Gerrits M, Graf M, Liss M, Daubert D, Wagner R, et al. Gene optimization mechanisms: a multi-gene study reveals a high success rate of full-length human proteins expressed in Escherichia coli. Protein Sci. Publ. Protein Soc. 2010;19:1312–1326. - PMC - PubMed
    1. Sharp PM, Li WH. The codon Adaptation Index–a measure of directional synonymous codon usage bias, and its potential applications. Nucleic Acids Res. 1987;15:1281–1295. - PMC - PubMed
    1. Fath S, Bauer AP, Liss M, Spriestersbach A, Maertens B, Hahn P, Ludwig C, Schäfer F, Graf M, Wagner R. Multiparameter RNA and codon optimization: a standardized tool to assess and enhance autologous mammalian gene expression. PLoS ONE. 2011;6:e17596. - PMC - PubMed
    1. Satchwell SC, Drew HR, Travers AA. Sequence periodicities in chicken nucleosome core DNA. J. Mol. Biol. 1986;191:659–675. - PubMed

Publication types

MeSH terms

Substances