. 2014 Mar;80(6):1821-31.
doi: 10.1128/AEM.03280-13. Epub 2014 Jan 10.

Model organisms retain an "ecological memory" of complex ecologically relevant environmental variation

Affiliations

Model organisms retain an "ecological memory" of complex ecologically relevant environmental variation

Karlyn D Beer et al. Appl Environ Microbiol. 2014 Mar.

Abstract

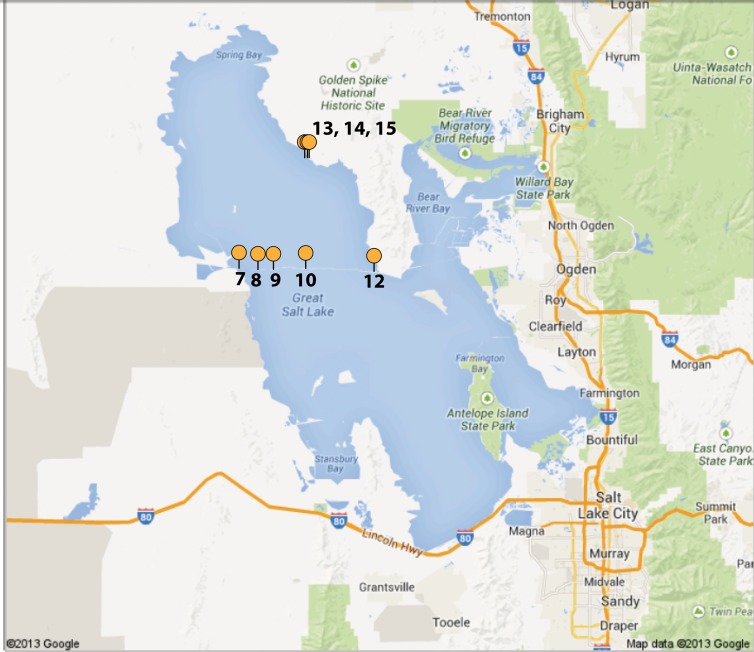
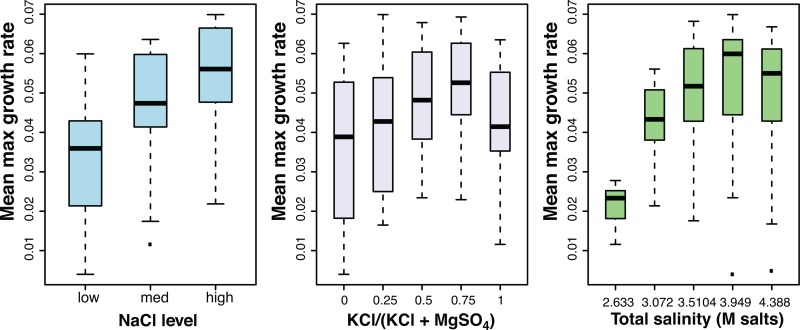
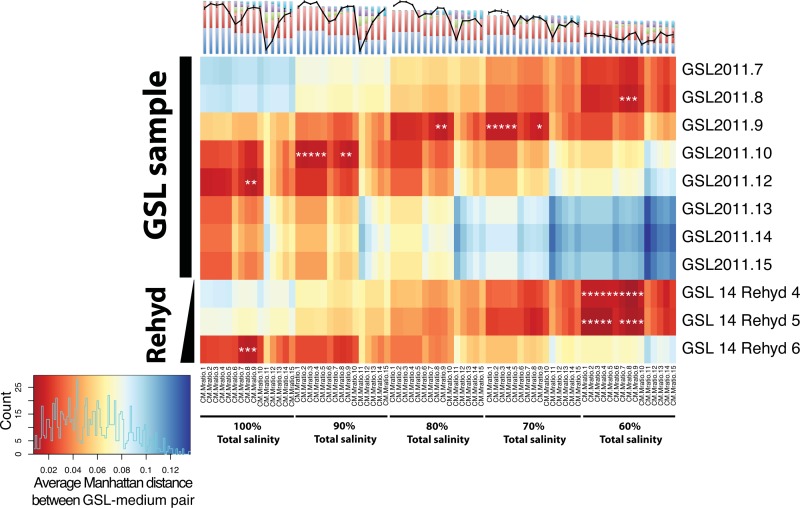
Although tractable model organisms are essential to characterize the molecular mechanisms of evolution and adaptation, the ecological relevance of their behavior is not always clear because certain traits are easily lost during long-term laboratory culturing. Here, we demonstrate that despite their long tenure in the laboratory, model organisms retain "ecological memory" of complex environmental changes. We have discovered that Halobacterium salinarum NRC-1, a halophilic archaeon that dominates microbial communities in a dynamically changing hypersaline environment, simultaneously optimizes fitness to total salinity, NaCl concentration, and the [K]/[Mg] ratio. Despite being maintained under controlled conditions over the last 50 years, peaks in the three-dimensional fitness landscape occur in salinity and ionic compositions that are not replicated in laboratory culturing but are routinely observed in the natural hypersaline environment of this organism. Intriguingly, adaptation to variations in ion composition was associated with differential regulation of anaerobic metabolism genes, suggesting an intertwined relationship between responses to oxygen and salinity. Our results suggest that the ecological memory of complex environmental variations is imprinted in the networks for coordinating multiple cellular processes. These coordination networks are also essential for dealing with changes in other physicochemically linked factors present during routine laboratory culturing and, hence, retained in model organisms.


Figures

FIG 1
FIG 1
Map of all GSL sampling sites. Map of the Great Salt Lake in Utah, with orange markers indicating sampling sites. Marker locations were made with GPS coordinates in Table 1. Water data and metadata were collected from each site and recorded, and sites were selected to capture the chemical and ecological diversity within GSL.
FIG 2
FIG 2
Salinity fitness curves. (A) Fitness curves plotting the maximum growth rate over the medium composition show how the salinity niche is shaped by three factors (total salinity, [NaCl], and [K]/[Mg] ratio). Black lines connect the mean maximum growth rate (μ; h−1) from 4 to 8 replicate experiments in each growth medium. Error bars show standard deviations. (B) A three-dimensional landscape representation of the data in panel A. Colors represent growth medium total salinity (purple, 100%; blue, 90%; green, 80%; orange, 70%; red, 60%). Growth media are ordered 1 to 15, as in panel A. The bar height indicates the mean μ. Total salinity is given as the ion concentration, in molar (M ions).
FIG 3
FIG 3
The mean maximum growth rate varies by total salinity, [NaCl] level, and [K]/[Mg] ratio. Box plots indicate the median (black bar in each box) and 1st and 3rd quartiles of μ (bottom and top edges of each box, respectively) within each level of each factor. Whiskers extend to 1.5 times the interquartile range, and individual points lie outside this range. [K]/[Mg] is represented as the potassium fraction of total potassium plus magnesium.
FIG 4
FIG 4
Pairwise Manhattan distances between GSL sample and growth medium salinities. The salinity compositions of GSL samples (y axis) and 75 growth media (x axis) were compared by calculating the average Manhattan distance. The average Manhattan distance is the sum of the absolute differences in each salinity attribute (total salinity, Na, Cl, Mg, SO4, and K, in molar) divided by the total number of attributes (six). Colors indicate the magnitude of the distance, with red indicating the smallest differences and blue indicating the largest differences. Differences in the smallest 5% by cumulative distribution function are indicated with white asterisks. GSL samples are distinguished from sample GSL2011.14 rehydration (Rehyd) time course samples on the left-hand y axis. GSL samples shown are those with differences in total salinity from the total salinity of the most closely matching growth medium of no greater than 1.6 M. The key at the lower left indicates the scale and distribution of distances among sample pairs. The colors denoting the ion compositions of the growth media (top x axis) are defined in Fig. 2A. The CM.Mratio labels distinguish each of the 75 media. The final number in the CM.Mratio name indicates the ion composition (1 to 15). For media from series of less than 100% salinity, the number following “Mratio” represents the dilution (90, 80, 70, or 60%). See Table S1 in the supplemental material.
FIG 5
FIG 5
Great Salt Lake sample compositions map to those of the growth media that produce peak fitness. GSL samples (blue and yellow dots numbered with GSL sample numbers) are superimposed onto a three-dimensional landscape of H. salinarum NRC-1 fitness, where each colored bar represents the maximum growth rate in 1 of 75 growth media. Dots are located on the individual medium compositions that were best matched to GSL sample salinity by Manhattan distance (yellow) or nested pairwise comparison (blue). The colors in the three-dimensional bar plot indicate growth medium total salinity (purple, 100%; blue, 90%; green, 80%; orange, 70%; red, 60%), and media within a single total salinity (TS) level are numbered 1 to 15 from left to right. Bar height measures indicate the maximum growth rate (in hours−1). See Fig. 2A for standard deviations around the mean. Samples with an “R” prefix in the sample number were rehydrated.

References

    1. Oren A. 2001. The bioenergetic basis for the decrease in metabolic diversity at increasing salt concentrations: implications for the functioning of salt lake ecosystems. Hydrobiologia 466:61–72. 10.1023/A:1014557116838 - DOI
    1. Oren A. 1999. Bioenergetic aspects of halophilism. Microbiol. Mol. Biol. Rev. 63:334–348 - PMC - PubMed
    1. Csonka LN, Hanson AD. 1991. Prokaryotic osmoregulation: genetics and physiology. Annu. Rev. Microbiol. 45:569–606. 10.1146/annurev.mi.45.100191.003033 - DOI - PubMed
    1. Csonka LN. 1989. Physiological and genetic responses of bacteria to osmotic stress. Microbiol. Rev. 53:121–147 - PMC - PubMed
    1. Tietge JE, Hockett JR, Evans JM. 1997. Major ion toxicity of six produced waters to three freshwater species: application of ion toxicity models and TIE procedures. Environ. Toxicol. Chem. 16:2002–2008. 10.1002/etc.5620161004 - DOI

Publication types

MeSH terms

Associated data