. 2014;40(1):191-212.
doi: 10.3233/JAD-131031.

Optical and SPION-enhanced MR imaging shows that trans-stilbene inhibitors of NF-κB concomitantly lower Alzheimer's disease plaque formation and microglial activation in AβPP/PS-1 transgenic mouse brain

Affiliations

Optical and SPION-enhanced MR imaging shows that trans-stilbene inhibitors of NF-κB concomitantly lower Alzheimer's disease plaque formation and microglial activation in AβPP/PS-1 transgenic mouse brain

Nathan O Solberg et al. J Alzheimers Dis. 2014.

Abstract

Alzheimer's disease (AD) is associated with a microglia-dependent neuroinflammatory response against plaques containing the fibrous protein amyloid-β (Aβ). Activation of microglia, which closely associate with Aβ plaques, engenders the release of pro-inflammatory cytokines and the internalization of Aβ fibrils. Since the pro-inflammatory transcription factor NF-κB is one of the major regulators of Aβ-induced inflammation, we treated transgenic amyloid-β protein protein/presenilin-1 (AβPP/PS1) mice for one year with a low dose (0.01% by weight in the diet) of either of two trans-stilbene NF-κB inhibitors, resveratrol or a synthetic analog LD55. The 3D distribution of Aβ plaques was measured ex vivo in intact brains at 60 μm resolution by quantitative magnetic resonance imaging (MRI) using blood-brain barrier-permeable, anti-AβPP-conjugated superparamagentic iron oxide nanoparticles (SPIONs). The MRI measurements were confirmed by optical microscopy of thioflavin-stained brain tissue sections and indicated that supplementation with either of the two trans-stilbenes lowered Aβ plaque density in the cortex, caudoputamen, and hippocampus by 1.4 to 2-fold. The optical measurements also included the hippocampus and indicated that resveratrol and LD55 reduced average Aβ plaque density by 2.3-fold and 3.1-fold, respectively. Ex vivo measurements of the regional distribution of microglial activation by Iba-1 immunofluorescence of brain tissue sections showed that resveratrol and LD55 reduced average microglial activation by 4.2- fold and 3.5-fold, respectively. Since LD55 lacked hydroxyl groups but both resveratrol and LD55 concomitantly reduced both Aβ plaque burden and neuroinflammation to a similar extent, it appears that the antioxidant potential of resveratrol is not an important factor in plaque reduction.

Keywords: LD55; NF-κB; SPIONs; magnetic resonance imaging; microglia; neuroinflammation; resveratrol; transgenic mice.


Figures
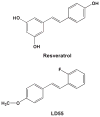
Fig. 1
Fig. 1
Comparison of the chemical structures of the trans-stilbene based inhibitors of NF-κB used in this study. Resveratrol, ((E)-3,5,4′-trihydroxystilbene), and the novel NF-κB inhibitor, LD55, ((E)-2-fluoro-4′-methoxystilbene).
Fig. 2
Fig. 2
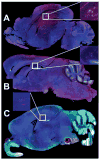
Fluorescence microscopy of AβPP/PS1 Tg AD mouse brain in sagittal cross-section. A) A control AβPP/PS-1 transgenic stained for plaques with Thioflavin-S (Green), with anti-Iba-1 to show activated microglia (Red), and DAPI (Blue) to show the cell nuclei. B) A whole brain from an AβPP/PS-1 Tg AD mouse treated with resveratrol (stained as in A). C) A whole brain from an AβPP/PS-1 Tg AD mouse treated with LD55 (stained as in A). Note the reduction in plaque (Green) and activated microglia (Red) in B & C, which is particularly evident in the insets.
Fig. 3
Fig. 3
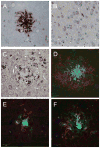
Histological examination of the effects of resveratrol and LD55 on plaque formation and microglial activation. A) Optical microscopic image of a brain section from a control AD mouse, without drug treatment, immunohistochemically stained for Aβ. Note the central plaque and the Aβ fibrils. The scale bar is 20 μm long. B) Optical microscopic image of a healthy, non-AD control mouse without drug treatment immunohistochemically stained for Aβ showing no plaque formation. The scale bar is 10 μm long. C) Optical microscopic image of a control AβPP/PS-1 Tg AD mouse brain (as in A) immunohistochemically stained for Iba-1 showing the activated microglia surrounding an Aβ plaque. The scale bar is 10 μm long. D) Confocal microscopic image of a brain section from an AD mouse without drug treatment, stained as in Fig. 2A–C. Note the clustering of the activated microglia around the Aβ plaque and how their processes penetrate into the plaque and surround it. Amyloid is visible in the cytoplasm of the microglia. The scale bar is 10 μm long. E) Confocal microscopic image of a brain section (stained as in D) from an AD mouse treated with resveratrol. The scale bar is 10 μm long. F) Confocal microscopic image of a brain section (stained as in D) from an AD mouse treated with LD55. Note the smaller plaque radius (Green) and the attenuation of microglial activation (Red) in both E and F as compared with D. The scale bar is 10 μm long.
Fig. 4
Fig. 4
Effect of drug treatment on plaque density in SPION-enhanced 9.4 T MRI of the brains of AβPP/PS-1 transgenic AD mice. A) MRI of control, untreated brain showing 16 plaques in this slice. B) Image of the brain from an animal treated with resveratrol showing four plaques in this slice. C) MRI of a control, untreated brain from an animal injected with anti-AβPP conjugated SPIONs showing 32 plaques in this slice. D) Image from the brain of an animal treated with LD55 and injected with anti-AβPP conjugated SPIONs showing four plaques in this slice.
Fig. 5
Fig. 5
Three-dimensional distribution of SPION-enhanced, MRI-detected plaques in the brains of AβPP/PS-1 transgenic AD mice: Effect of drug treatment. A) Control 3D distribution of plaques in the brain of a mouse without drug treatment showing 327 plaques. B) 3D distribution of plaques in the brain of a mouse treated with resveratrol showing 55 plaques. C) Anti-AβPP SPION-enhanced 3D MRI distribution of plaques in the brain of a mouse without drug treatment showing 668 plaques. D) Anti-AβPP SPION-enhanced 3D MRI distribution of plaques in the brain of a mouse treated with LD55 showing 214 plaques. The size and color of each sphere is set in a rainbow scale and is proportional to the Zscore of the plaque located at that set of (x, y, z) coordinates measured from the MR images. Red corresponds to Z = 2.5, while purple codes Z = 20. The diameter of each sphere gives its Z-score in these coordinates. Note how drug treatment led to a 3–6-fold reduction in MRI detected plaques and SPION treatment markedly increased the conspicuity of the plaques.
Fig. 6
Fig. 6
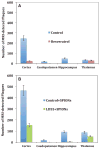
Regional distribution of SPION-enhanced, MRI-detected plaques in the brains of AβPP/PS-1 transgenic AD mice: Effect of drug treatment. A) MRI data from brains without SPION enhancement revealed both control plaques (Blue bars) and the decrease in plaque number upon treatment with resveratrol (Red bars). Shown are the means and standard errors of the means (n = 6). B) Anti-AβPP SPION-enhanced MRI of the control, untreated mouse brains revealed large numbers of plaques (Blue bars) in the cortex, caudoputamen, and thalamus, which markedly decreased upon treatment of the mice with LD55 (Green bars).
Fig. 7
Fig. 7
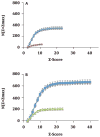
Effect of drug treatment on the integral distribution of Z-scores from SPION enhanced MRI of brains from the AβPP/PS-1 Tg transgenic AD mice. A) Integral frequency distribution of the MRI Z-score data in the absence of SPION injection. Blue diamonds indicate data from control mice without drug treatment; Red squares denote the data from mice treated with resveratrol. Drug treatment lowers both the number of plaques (see text) and their maximum Z score from 24 to 12. B) Integral frequency distribution of the MRI Z-score data from mice injected with antihuman AβPP conjugated SPIONs. Blue squares indicate data from mice injected with anti-human AβPP conjugated SPIONs, but without drug treatment; Green triangles reflect treatment with both LD55 and anti-human AβPP conjugated SPIONs. Note how drug treatment led to a 3–6-fold reduction in MRI detected plaques and SPION treatment increased the conspicuity of the plaques; the SPION injected mice displayed twice as many lesions (B; Blue squares) as the control mice (A; Blue diamonds).
Fig. 8
Fig. 8
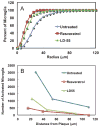
Frequency distributions of plaque radii and the distances from the center of a plaque to the center of an activated microglial cell in cortical brain sections from AβPP/PS-1 transgenic AD mice. A) The blue points are the measured frequencies of plaque radii for a total of 1243 cortical plaques fitted to a Gaussian distribution with a mean of 8.5 μm and a width of 5 μm (Table 2). The red points are the measured distances from an activated microglia to the plaque center, while the red curve is a Gaussian fit with three components whose parameters are summarized in Table 2. The individual Gaussians are shown in green, while the residual of the fit is shown in purple. These and the following measurements were taken from 80 optical histology sections each, like those shown in Fig. 3D–F. B) A 3D model of the radial distribution of microglia (rainbow colored rings) surrounding a plaque (the central green peak) derived from the measurements in A, showing the physical association of proximal, medial, and distal populations of microglia to the plaque. The model parameters were derived from the measurements in (A) and are summarized in Table 2. C) Frequency distributions from mice treated with resveratrol; the colors and meanings are the same as in (A). The red curve is a Gaussian fit with three components summarized in Table 2. D) A 3D model of the radial distribution of microglia (rainbow colored rings) surrounding a plaque (the central green peak) derived from the measurements in C from animals treated with resveratrol. E) Frequency distributions from mice treated with LD55; the colors and meanings are the same as in (A). The red curve is a Gaussian fit with three components summarized in Table 2. F) A 3D model of the radial distribution of microglia (rainbow colored rings) surrounding a plaque (the central green peak) derived from the measurements in E from mice treated with LD55.
Fig. 9
Fig. 9
Effect of drug treatment on the radial distributions of activated cortical microglial cells in the brains of AβPP/PS-1 transgenic AD mice. A) Integral distribution of the percent of activated cortical microglia as a function of the distance from the center of a plaque in untreated, positive control AD mouse brain (Untreated: Blue diamonds; radius encompassing 50% of the total = 32 μm) and in the brains of AD mice treated with either resveratrol (Resveratrol: Red squares; 50% radius = 17 μm) or LD55 (LD55: Green triangles; 50% radius = 24 μm). Note that drug treatment reduces the proximal halo of activated microglia around the plaques. B) The number of microglia surrounding plaques as a function of distance from the nearest plaque in untreated, positive control AD mouse brain (Untreated: Blue diamonds) and in the brains of AD mice treated with either resveratrol (Resveratrol: Red squares) or LD55 (LD55: Green triangles). Data taken from the three integrals of the Gaussian fits shown in Fig. 4A, C, F. Note that drug treatment uniformly reduces the halo of activated microglia around the plaques.
Fig. 10
Fig. 10
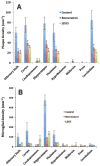
Effect of drug treatment on the regional distribution of plaque and activated microglial densities in the brains of AβPP/PS-1 transgenic AD mice. A) Plaque areal density and (B) Areal density of activated microglia, in control (Blue) Resveratrol-treated (Red) and LD55 treated (Green) AD mice. Shown are the means and standard errors for n = 5–8 mice (see methods).
Fig. 11
Fig. 11
Effect of drug treatment on the relationship between plaque and activated microglial areal density in the brains of AβPP/PS-1 transgenic AD mice. Blue diamonds: Control, untreated mice; Red squares: resveratrol-treated mice; and Green triangles: LD55 treated mice. Shown are the means and standard errors for n = 5–8 mice (see methods).

Similar articles

Cited by

References

    1. Alzheimer’s Association. Alzheimer’s disease facts and figures. Alzheimer’s Association; Washington, D.C: 2011. http://www.alz.org/downloads/facts_figures_2011.pdf. - PubMed
    1. Hebert LE, Scherr PA, Bienias JL, Bennett DA, Evans DA. Alzheimer’s disease in the U.S. population: Prevalence estimates using the 2000 census. Arch Neurol. 2003;60:1119–1122. - PubMed
    1. Fodero-Tavoletti AT, Villemagn VL, Rowe CC, Masters CL, Barnham KJ, Cappai R. Amyloid-β: The seeds of darkness. Int J Biochem Cell Biol. 2011;43:1247–1251. - PubMed
    1. McLean CA, Cherny RA, Fraser FW, Fuller SJ, Smith MJ, Beyreuther K, Bush AI, Masters CL. Soluble pool of Abeta amyloid as a determinant of severity of neurodegeneration in Alzheimer’s disease. Ann Neurol. 1999;46:860–866. - PubMed
    1. Liu Z, Condello C, Schain A, Harb R, Grutzendler J. CX3CR1 in microglia regulates brain amyloid deposition through selective protofibrillar amyloid-β phagocytosis. J Neurosci. 2010;30:17091–17101. - PMC - PubMed

Publication types

MeSH terms