. 2014;40(2):297-308.
doi: 10.3233/JAD-132081.

Alzheimer's disease: evidence for the expression of interleukin-33 and its receptor ST2 in the brain

Affiliations

Alzheimer's disease: evidence for the expression of interleukin-33 and its receptor ST2 in the brain

Zhi Xiong et al. J Alzheimers Dis. 2014.

Abstract

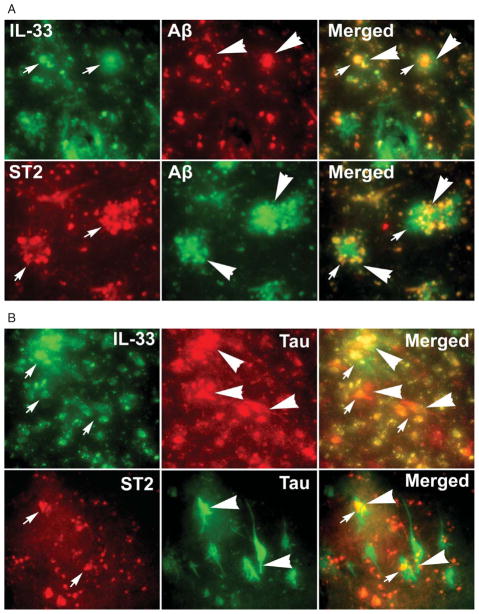
Inflammatory responses are increasingly implicated in the pathogenesis of neurodegenerative diseases such as in Alzheimer's disease (AD). Interleukin-33 (IL-33), a member of IL-1 family, is constitutively expressed in the central nervous system and thought to be an important mediator of glial cell response to neuropathological lesions. Proinflammatory molecules are highly expressed at the vicinity of amyloid plaques (APs) and neurofibrillary tangles (NFTs), the hallmarks of AD pathology. We have investigated the expression of IL-33 and ST2 in relation to APs and NFTs in human AD and non-AD control brains by immunohistochemistry. Sections from the entorhinal cortex, where APs and NFTs appear in early stages of AD, were used for immunohistochemistry. Mouse primary astrocytes were cultured and incubated with amyloid-β1-42 (Aβ1-42), component of plaque for 72 h and analyzed for the expression of IL-33 by flow cytometry. We found strong expression of IL-33 and ST2 in the vicinity of Aβ and AT8 labelled APs and NFTs respectively, and in the glial cells in AD brains when compared to non-AD control brains. IL-33 and ST2 positive cells were also significantly increased in AD brains when compared to non-AD brains. Flow cytometric analysis revealed incubation of mouse astrocytes with Aβ1-42 increased astrocytic IL-33 expression in vitro. These results suggest that IL-33, an alamin cytokine, may induce inflammatory molecule release from the glial cells and may play an important role in the pathogenesis of AD.

Keywords: Alzheimer's disease; IL-33; ST2; amyloid plaques; glia maturation factor; neurofibrillary tangles.


Figures

Fig. 1
Fig. 1
Representative photomicrograph showing the entorhinal cortex from non-AD (A) and AD (B) brains immunostained for tau (NFTs, brown color) with AT8 antibody to detect AD pathology. C) Brain sections were also immunostained with 6E10 antibody to detect APs in the entorhinal cortex (boxed areas) of AD and non-AD brains. The number of APs was counted in 5–10 non-overlapping visual fields under the microscope using high power objectives and averaged for each case. AD (n = 10) brains entorhinal cortex showed significantly increased (p = <0.05, t test) number of APs when compared to non-AD (n = 6) brain entorhinal cortex. We have used brain sections from these AD and non-AD cases to immunostain for IL-33 or ST2.
Fig. 2
Fig. 2
Immunohistochemical analysis of IL-33 and its receptor, ST2, expression and their co-localization with APs of entorhinal cortex in human AD (n = 10) and non-AD brains (n = 6). We performed immunohistochemistry using DAB substrate (brown color) for IL-33 (A, C) and ST2 expression (B, D) in AD brains, and non-AD brains (E, F). Thioflavin-S fluorescence (green color) staining was used to detect APs in the brain (A-F). A) IL-33 expression was co-localized with the APs in the entorhinal cortex. IL-33 and ST2 expression was also seen in glial cells (black arrows) surrounding the plaques (white arrows heads). ST2 (black arrows) receptor expression was also co-localized and seen within lesion (white arrow heads) but more concentrated around the APs in the affected entorhinal cortex of AD brain. C and D show lower magnification along with Isotype matched IgG as staining control from AD brains, and E and F are from non-AD brains. Merged images show co-localization of IL-33 or ST2 with APs in AD brains. Original magnification A, B = 400×; C, D, E, F = 200×. ThioS, Thioflavin S.
Fig. 3
Fig. 3
IL-33 and ST2 expression is increased in the entorhinal cortex of AD brain. We have counted IL-33-positive and ST2 positive cells in the entorhinal cortex of AD (n = 10) and non-AD (n = 6) brains using the immunohistochemistry slides. The counting was performed under the microscope using high magnification objectives at five different fields in the section and then averaged. The data were presented as the number of IL-33 or ST2-positive cells/95 = mm2. The data were presented as mean ± SEM, *p<0.05, t test.
Fig. 4
Fig. 4
A) Immunofluorescence analysis of IL-33 and ST2 expression and their co-localization with plaques and tangles in affected entorhinal cortex of human AD brain (n = 10). We have first performed immunofluorescence staining of IL-33 or ST2 and then performed Thioflavin-S fluorescence to detect APs (arrows) and NFTs (arrowheads). The sections were stained with monoclonal IL-33 and goat anti-mouse IgG Alexa Fluor conjugated 568 (red color). Sections were also stained with ST2 and goat anti-rabbit IgG Alexa fluor conjugated 568 (red color). Following these IL-33 or ST2 staining, thioflavin–S staining (green color) was performed in these sections. Both IL-33 and ST2 expression was co-localized at the vicinity of APs (arrows) and NFTs (arrowheads) in the AD brain as shown in the merged picture (yellow color). Original magnification = 200×. B) In high magnification using brain from another patient, IL-33 expression was co-localized and also found concentrated near the center of APs in AD brain (top panel). ST2 expression was concentrated at the periphery of the plaques in AD brain (bottom panel). Both IL-33 and ST2 were co-localized with APs in the AD brain as shown in the merged picture (yellow color). Original magnification = 400×.
Fig. 5
Fig. 5
IL-33 and ST2 were co-localized with Aβ and AT8 labelled APs and NFTs, respectively by double immunofluorescence staining in the entorhinal cortex of AD brains (n = 10). A) Double immunofluorescence staining of IL-33 (green, arrows) or ST2 (red, arrows) with amyloid plaques labeled with Aβ antibody (red or green arrowheads) staining in the AD brain. Co-localization of IL-33 or ST2 with APs is shown by the yellow color in merged images. Original magnifications = ×400. B) Double immunofluorescence staining of IL-33 (green, arrows) or ST2 (red, arrows) with phosphorylated tau with AT8 antibody (red or green, arrowheads) for NFTs antibody in AD brain. Co-localization of IL-33 or ST2 with NFTs is shown by the yellow color in merged images. Original magnification = ×400.
Fig. 6
Fig. 6
Immunofluorescence localization of IL-33 in relation to astrocytes and microglia in the affected entorhinal cortex of human AD brain (n = 10). Sections were incubated with IL-33 primary antibody and then either with Iba-1 or GFAP antibody for the detection of microglia and astrocytes, respectively. Then these sections were incubated with secondary antibodies, Alexa Fluor 488 goat anti-rabbit IgG or Alexa Fluor 488 goat anti-mouse IgG. IL-33 expression (arrow heads) was seen at the lesional area of the entorhinal cortex. Upregulated expression of IL-33 (green) was localized in two patterns, dense and diffuse, similar to plaques. Upper panel: Monoclonal IL-33 antibody labeling shows the lesion infiltrated by hypertrophic microglia expressing Iba-1 (upper panel, red color, arrows). Areas of overlaps appear yellow color as shown in the merged figure. Lower panel: Polyclonal IL-33 antibody labeling shows the dense structure surrounded by a ring of astrocytes. Note the thickened processes of the activated astrocytes (arrows), which express high levels of GFAP (lower panel, red color, arrows). Original magnification = 400×.
Fig. 7
Fig. 7
1–42 induces the expression of IL-33 in mouse primary astrocytes. Astrocytes were incubated with Aβ1–42 (1 μM) for 72 h at 37°C in vitro. Then the expression of IL-33 was determined by flow cytometry using monoclonal anti-IL-33 phycoerythrin conjugated antibody (n = 3). Representative histograms show that Aβ1–42 increased the expression of IL-33 in the astrocytes when compared to untreated control astrocytes.

References

    1. Farfara D, Lifshitz V, Frenkel D. Neuroprotective and neurotoxic properties of glial cells in the pathogenesis of Alzheimer’s disease. J Cell Mol Med. 2008;12:762–780. - PMC - PubMed
    1. Paris D, Ganey NJ, Laporte V, Patel NS, Beaulieu-Abdelahad D, Bachmeier C, March A, Ait-Ghezala G, Mullan MJ. Reduction of beta-amyloid pathology by celastrol in a transgenic mouse model of Alzheimer’s disease. J Nuroinflammation. 2010;7:17. - PMC - PubMed
    1. Carter MD, Simms GA, Weaver DF. The development of new therapeutics for Alzheimer’s disease. Clin Pharmacol Ther. 2010;88:475–486. - PubMed
    1. Korczyn AD. Why have we failed to cure Alzheimer’s disease? J Alzheimers Dis. 2012;29:275–282. - PubMed
    1. Thangavel R, Stolmeier D, Yang X, Anantharam P, Zaheer A. Expression of glia maturation factor in neuropathological lesions of Alzheimer’s disease. Neuropathol Appl Neurobiol. 2011;38:572–581. - PMC - PubMed

Publication types

MeSH terms