. 2014 Feb;46(2):116-25.
doi: 10.1038/ng.2874. Epub 2014 Jan 12.

RAG-mediated recombination is the predominant driver of oncogenic rearrangement in ETV6-RUNX1 acute lymphoblastic leukemia

Affiliations

RAG-mediated recombination is the predominant driver of oncogenic rearrangement in ETV6-RUNX1 acute lymphoblastic leukemia

Elli Papaemmanuil et al. Nat Genet. 2014 Feb.

Abstract

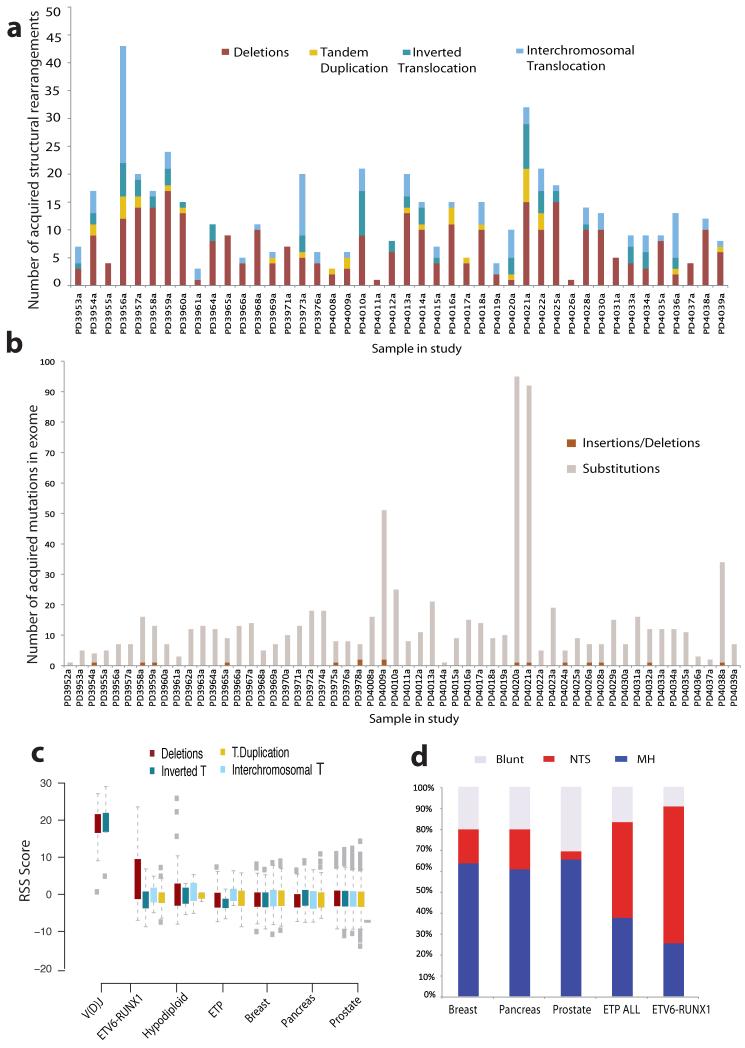
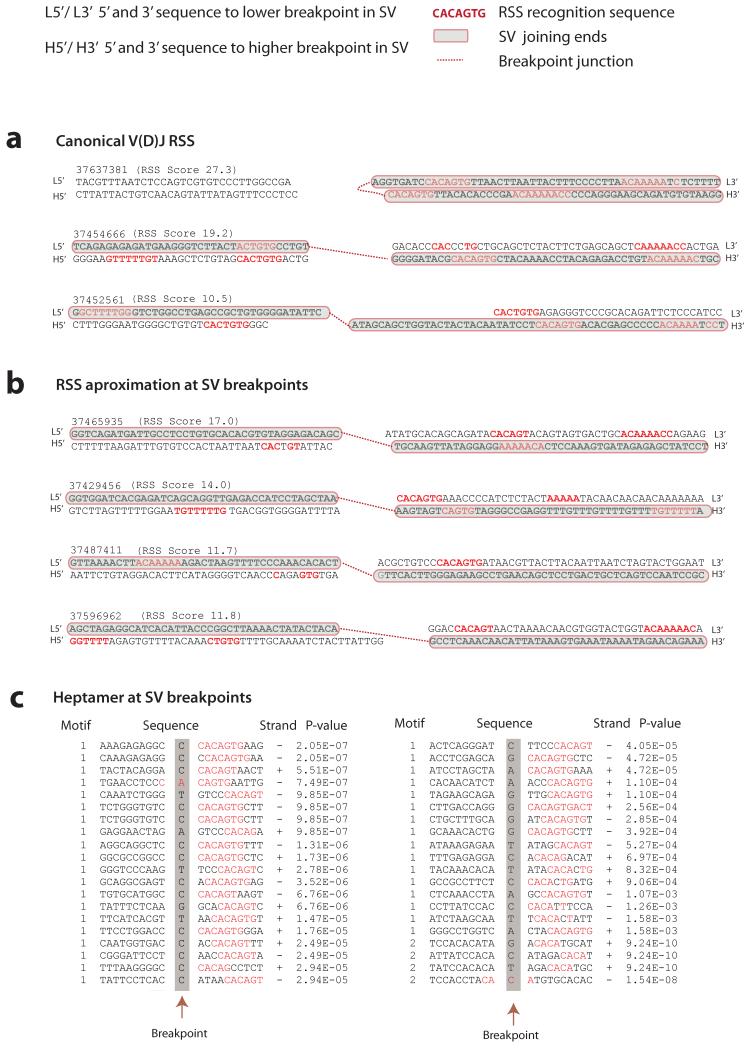
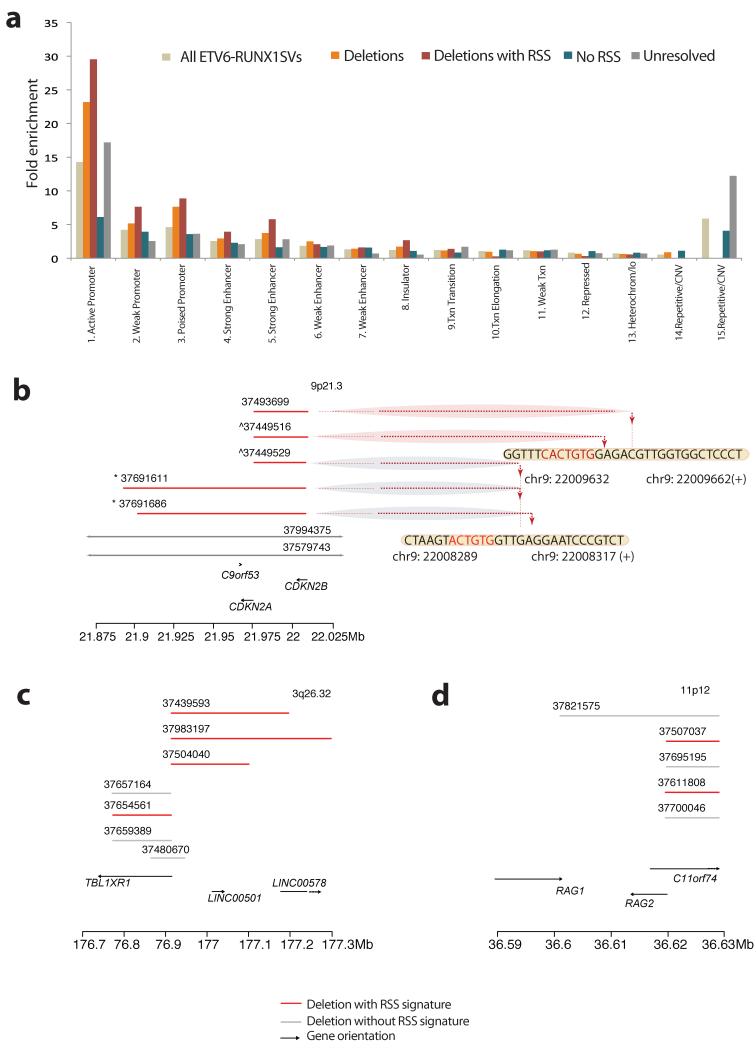
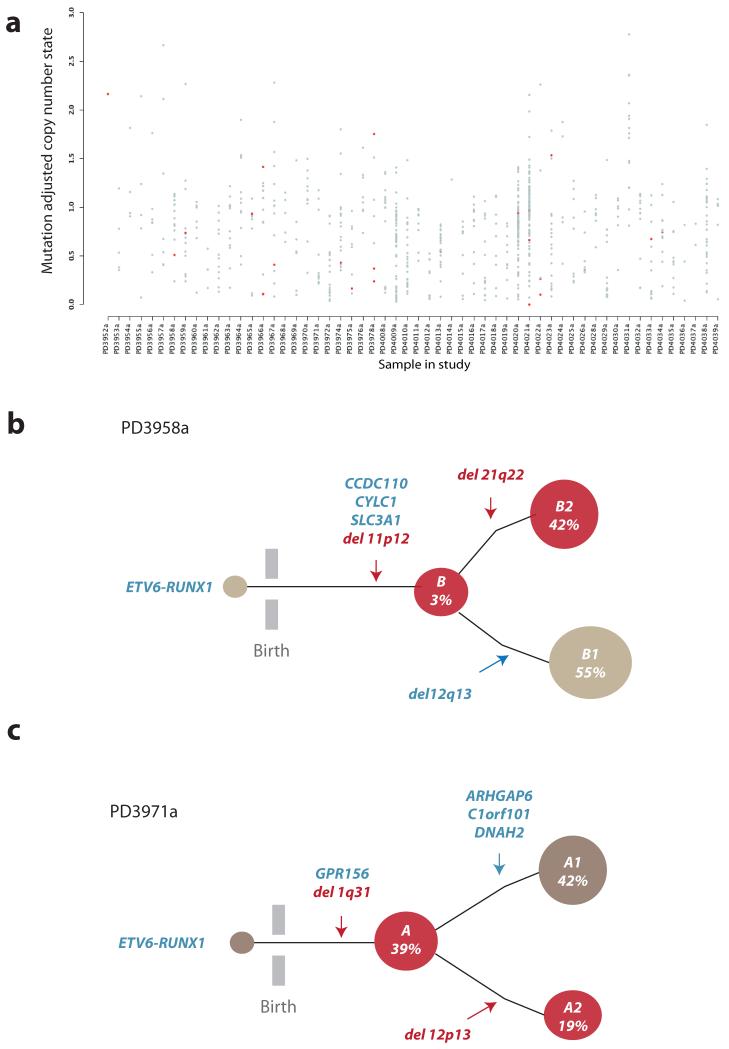
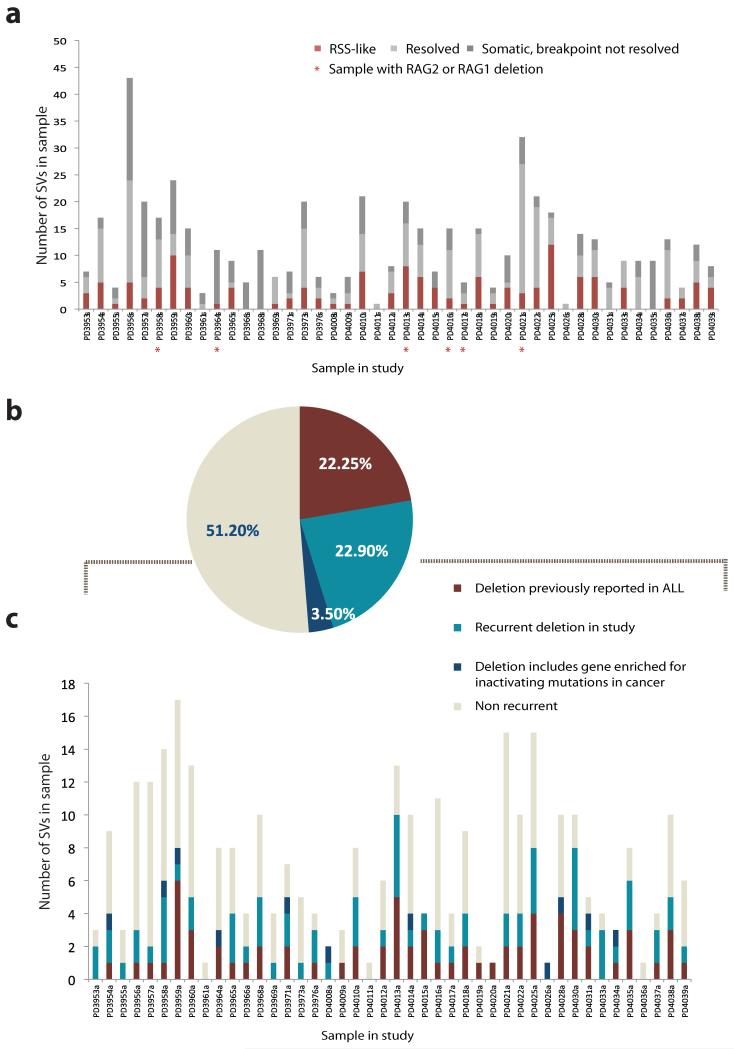
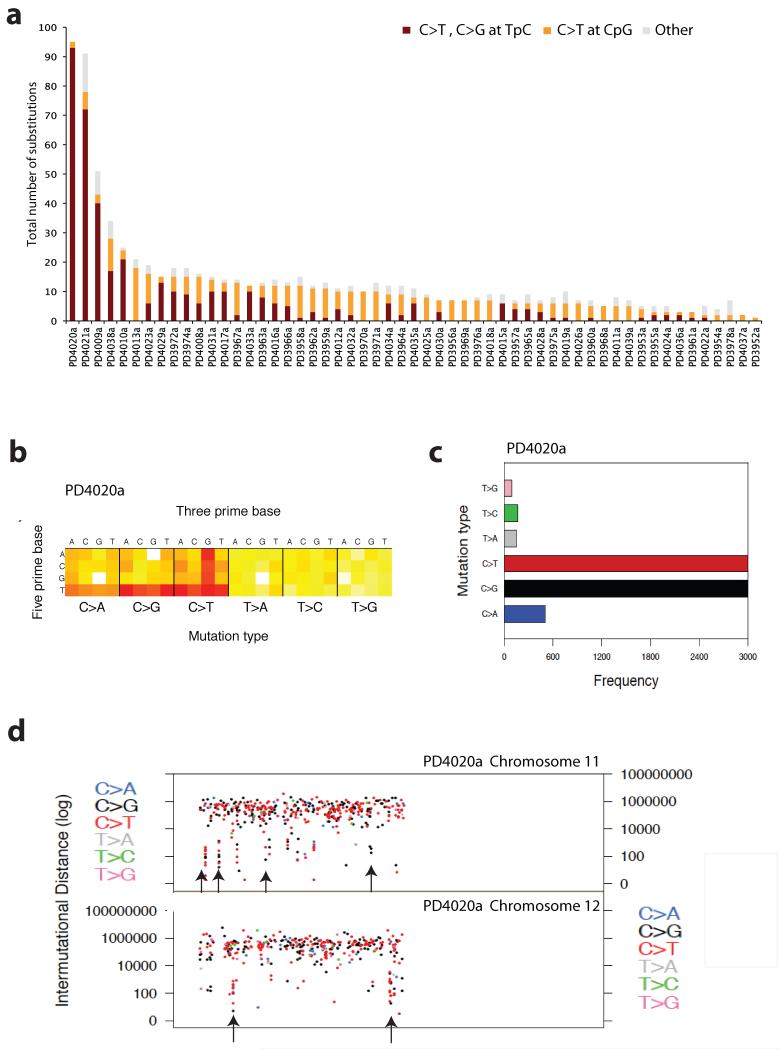
The ETV6-RUNX1 fusion gene, found in 25% of childhood acute lymphoblastic leukemia (ALL) cases, is acquired in utero but requires additional somatic mutations for overt leukemia. We used exome and low-coverage whole-genome sequencing to characterize secondary events associated with leukemic transformation. RAG-mediated deletions emerge as the dominant mutational process, characterized by recombination signal sequence motifs near breakpoints, incorporation of non-templated sequence at junctions, ∼30-fold enrichment at promoters and enhancers of genes actively transcribed in B cell development and an unexpectedly high ratio of recurrent to non-recurrent structural variants. Single-cell tracking shows that this mechanism is active throughout leukemic evolution, with evidence of localized clustering and reiterated deletions. Integration of data on point mutations and rearrangements identifies ATF7IP and MGA as two new tumor-suppressor genes in ALL. Thus, a remarkably parsimonious mutational process transforms ETV6-RUNX1-positive lymphoblasts, targeting the promoters, enhancers and first exons of genes that normally regulate B cell differentiation.


Figures

Figure 1
Figure 1. Acquired mutations in ETV6-RUNX1 ALL
(A) Structural variation in ETV6-RUNX1 ALL. Bar plots representing distribution of genomic rearrangement events in 44 samples (x-axis) with confirmed somatic SVs. Deletions are shown in burgundy, tandem duplications in yellow, inverted intrachromosomal in deep blue and inverted interchromosomal in light blue. All patients harbored the t(12;21) translocation which is not included in the bar plots. (B) Distribution of coding mutations as identified by exome sequencing across each patient in the study. Each sample is represented by a bar on the x-axis and the number of confirmed somatic substitutions and indels by the height of each bar plot on the y-axis. (C) RAG recognition sequence score enrichment in ETV6-RUNX1 deletions. RSS score for each SV class (Deletions, Inverted intrachromosomal rearrangements, Tandem Duplications and Interchromosomal Translocations) in the control V(D)J breakpoints and structural variants in ETV6-RUNX1 ALL, Hypodiploid ALL, ETP-ALL, breast cancer, pancreatic and prostate cancer. An RSS Score of 8.55 corresponds to FDR < 0.01. (D) Breakpoint resolution in ETV6-RUNX1 ALL. Bar charts showing the proportion of resolved breakpoint sequences with non-templated sequence insertion at the breakpoint junction (NTS), evidence of microhomology (MH) between the two ends of the breakpoint or clean blunt-ends at the breakpoint junctions in ETV6-RUNX1 ALL compared to the proportion of each breakpoint class in sets of confirmed rearrangements in Early T progenitor ALL (ETP), breast, pancreatic and prostate cancer.
Figure 2
Figure 2. Evaluation of V(D)J recombination motifs
RSS heptamer and nonamer sequences are shown in red, spacing annotates position of breakpoint. Retained sequence flanking the breakpoint junction is shown in bold black, shaded in grey with red borders. Genomic sequence is annotated 5′ to 3′ as presented in the reference genome (+) strand. For each rearrangement, the first line indicates the sequence flanking the lower breakpoint, the second line corresponds to the sequence flanking the higher breakpoint. The RSS Score for each rearrangement is shown in parenthesis. A dotted red line annotates the breakpoint junction. For more detailed annotation please refer to Supplementary Figure 1. (A) Rearrangements at the V(D)J locus showing examples of canonical V(D)J recombination signal sequences (in red) in close proximity to the breakpoint junctions. (B) Close approximation to RSS sequence motifs near the breakpoint junction of confirmed structural variants in ETV6-RUNX1 ALL. Represented in this figure are sequence motifs spanning the breakpoints for TBL1XR1 (RgID 37439593); FAF1 and CDKN2C (RgID 37429456); BTG1 (RgID 37487411) and RgID 37596962 showing chr1:190,815,392-190,815,481 joining to chr1:190,926,946-190,927,035. (C) Heptamer sequences identified by agnostic motif search analysis using MEME. A representation of 40 of the 164 breakpoints identified to harbor heptamer like motifs within 20bp of the breakpoint junction. In red, the bases contributing to the motif identification in the ETV6-RUNX1 ALL dataset. Heptamer p values are annotated as calculated by MEME.
Figure 3
Figure 3. Chromatin segmentation of all somatic SVs in ETV6-RUNX1
(A) Bar plot of SVs identified in ETV6-RUNX1 ALL that map in one of the 15 chromatin states defined by the ENCODE project from lymphoblastoid cell line GIM12878 genome segmentation. The heights of the bars reflect the fold-enrichment of each SV category for the 15 chromatin states (Supplementary Table 10). ETV6-RUNX1 SVs show significantly different SV distribution from that expected by chance (Goodness of fit test; p<2.2×10⁻¹⁶)(B-D) Clustering of deletion breakpoints (Supplementary Table 12). Red lines represent deletions with resolved breakpoints with either an RSS Score ≥ 8.55 or a heptamer within 20 bp of the breakpoint junction. Grey lines indicate deletions with resolved breakpoints without significant RSS motif scores at their breakpoint junctions. Arrows indicate genes and orientation of transcription. Dotted lines point towards the precise base-pair involved at the breakpoint junction. (B) Clustering of deletions at the CDKN2A locus (9p21.3) with evidence of re-iterated deletions in 2 samples. The signs ^ and * indicate that SVs were identified in the same sample (Supplementary Table 10). (C) Clustering of deletions at the TBL1XR1 locus (9p21.3) and (D) the RAG1/2 locus (11p12).
Figure 4
Figure 4. Clonal heterogeneity in ETV6-RUNX1 ALL
(A) X-axis represents each sample, y-axis the adjusted copy number of each mutation taking into account variant allele fraction and tumor cellularity. Grey dots are all acquired substitutions and indels identified from the exome study. Red dots represent previously characterized oncogenic mutations in cancer (Supplementary Table 6). (B) PD3958a clonal architecture. Acquired mutations are shown in blue whilst SVs with an RSS or RSS-like sequence at the breakpoint junction are shown in red. 139 single cells were positive for the ETV6-RUNX1 fusion gene, the three missense mutations in CCDC110, CYLC1 and SLC3A1, as well as the deletion on 11p12. The remaining two deletions on 12q13 and 21q22.12, were present in 55% and 42% of the cells respectively and were mutually exclusive. Both 11p12 and 21q22.12 deletions contained RSS sequence motifs at the junction. (C) Schematic representation of clonal structure for PD3971a. Acquired mutations are shown in blue whilst SVs with an RSS or RSS-like sequence at the breakpoint junction are shown in red. ETV6-RUNX1 was present in all 130 cells, as were a heterozygous mutation in GPR156 and the deletion mapping to 1q31. Mutations on ARHGAP6, C1orf10 and DNAH2 co-occur within a distinct clonal branch (in grey) representing 39% of the cells whereas the 12p12-13 deletion, which affects ETV6, is present in 19% cells, identifying a distinct subclone (in red).
Figure 5
Figure 5. Characterization of structural variation in ETV6-RUNX1 ALL
(A) Distribution of structural variant categories identified in each sample in the study. In red, the SVs with resolved breakpoints and evidence of RSS or heptamer motifs adjacent the breakpoint junction(n = 140), in light grey SVs with resolved breakpoint junctions that did not reach the criteria for the RSS motif assignment (n=214). In dark grey the proportion of confirmed SVs to be somatically acquired that failed resolution of the breakpoint junction (n=169). Red stars indicate samples with confirmed deletions spanning the RAG locus (B) Annotation of SVs in ETV6-RUNX1 ALL study showing deletions that have been previously reported in ALL (n=69, 22%), deletions that are recurrent in the study (n=71, 23%) or deletions that include genes enriched for inactivating mutations in cancer (n=11, 3.5%). Non-recurrent events are shown in light grey (n=159, 51%). (C) Same SV distribution by sample.
Figure 6
Figure 6. Acquired somatic events in ETV6-RUNX1 ALL
(A) Each column represents a sample. The first row indicates the patients with exome sequencing data, the second row depicts samples with whole-genome sequencing data for rearrangements. In the ETV6-RUNX1 row, purple boxes indicate the automated detection of the fusion genes in the samples that whole-genome sequencing was performed. First panel concentrates on genes that are predominantly affected by genomic rearrangement. Second panel annotates previously characterized cancer genes that are recurrently mutated in the present study. Crosses indicate homozygote events and mixed colors indicate occurrence of more than one type of event in the same sample. (B) Independent deletion of ATF7IP. Copy number plot showing a focal deletion of ATF7IP in PD4028a, RgID HS20_6248:31106.
Figure 7
Figure 7. Mutational signatures in ETV6-RUNX1 ALL
(A) Sequence context of point mutations identified in exome study. In burgundy all point mutations that correspond to a C>T or C>G at a TpC locus, in orange all C>T changes at CpG loci and in grey all remaining acquired substitutions. (B) Heatmap representation of all the mutations identified by whole-genome sequencing in PD4020a. The heatmap is separated into six boxes representing each mutation type(C>A, C>G, C>T, T>A, T>C and T>G). For each mutation type, 16 possible combinations of a 5′ preceding base as shown on the Y axis followed by one of 4 nucleotide basis on the X axis. Red indicates high number of mutations, yellow few and white no such mutations observed. (C) Barplot showing the mutation spectrum across all point mutations identified in the genome for PD4020a. (D) Scatter plot showing mutations clusters in chromosomes 11 and 12 identified by whole-genome sequencing of PD4020a. Each dot represents a mutation type, in blue C>A, black C>G, red C>T, grey T>A, green T>C and pink T>C. The order of the mutations along the x-axis reflects their position in the genome but not the precise chromosome coordinate i.e. mutation 1 followed by mutation 2, etc. The height of each subsequent mutation reflects the distance from the preceding mutation on a log scale i.e. 100bp, 1000bp or 1 MB. Mutation trickles are seen where localized clusters of hypermutation are observed, mostly comprised of C>G or C>T mutations (Supplementary Table 18).

Comment in

Similar articles

Cited by

References

    1. Bhojwani D, et al. ETV6-RUNX1-positive childhood acute lymphoblastic leukemia: improved outcome with contemporary therapy. Leukemia: official journal of the Leukemia Society of America, Leukemia Research Fund, U.K. 2012;26:265–270. - PMC - PubMed
    1. Greaves MF, Wiemels J. Origins of chromosome translocations in childhood leukaemia. Nature reviews. Cancer. 2003;3:639–649. - PubMed
    1. Mori H, et al. Chromosome translocations and covert leukemic clones are generated during normal fetal development. Proceedings of the National Academy of Sciences of the United States of America. 2002;99:8242–8247. - PMC - PubMed
    1. Bateman CM, et al. Acquisition of genome-wide copy number alterations in monozygotic twins with acute lymphoblastic leukemia. Blood. 2010;115:3553–3558. - PubMed
    1. Mullighan CG, et al. Genome-wide analysis of genetic alterations in acute lymphoblastic leukaemia. Nature. 2007;446:758–764. - PubMed

Publication types

MeSH terms