. 2014 Feb;46(2):136-143.
doi: 10.1038/ng.2870. Epub 2014 Jan 12.

Pancreatic islet enhancer clusters enriched in type 2 diabetes risk-associated variants

Affiliations

Pancreatic islet enhancer clusters enriched in type 2 diabetes risk-associated variants

Lorenzo Pasquali et al. Nat Genet. 2014 Feb.

Abstract

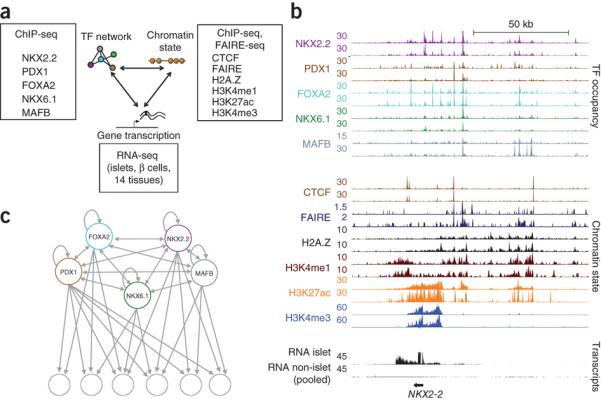
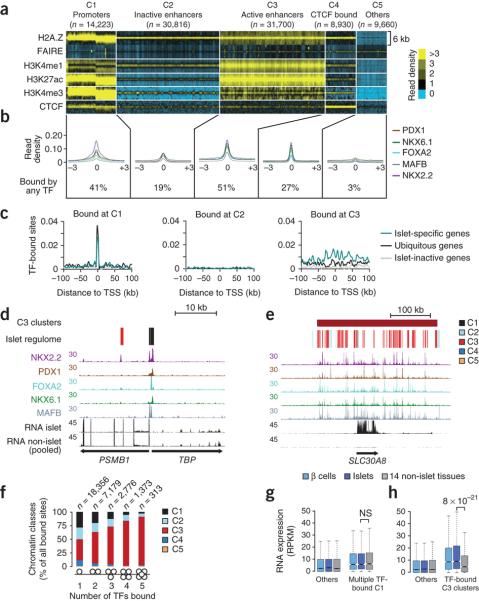
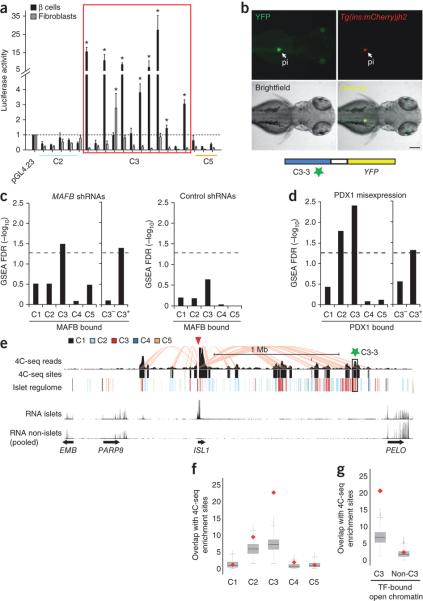
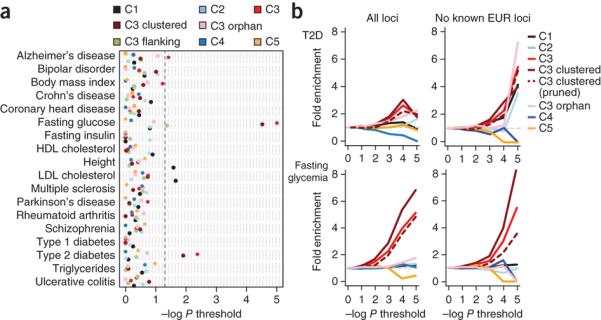
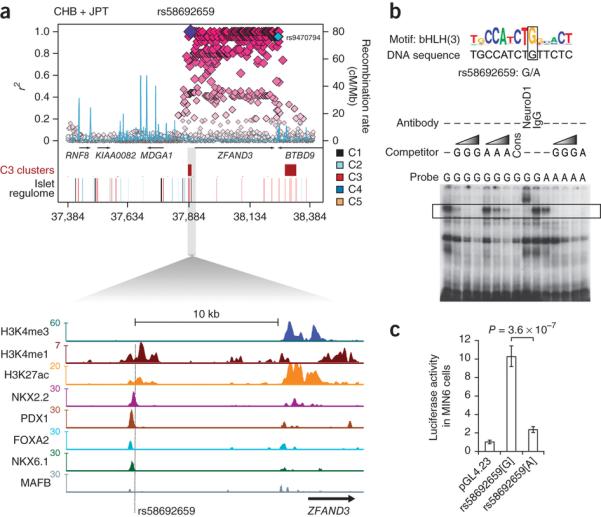
Type 2 diabetes affects over 300 million people, causing severe complications and premature death, yet the underlying molecular mechanisms are largely unknown. Pancreatic islet dysfunction is central in type 2 diabetes pathogenesis, and understanding islet genome regulation could therefore provide valuable mechanistic insights. We have now mapped and examined the function of human islet cis-regulatory networks. We identify genomic sequences that are targeted by islet transcription factors to drive islet-specific gene activity and show that most such sequences reside in clusters of enhancers that form physical three-dimensional chromatin domains. We find that sequence variants associated with type 2 diabetes and fasting glycemia are enriched in these clustered islet enhancers and identify trait-associated variants that disrupt DNA binding and islet enhancer activity. Our studies illustrate how islet transcription factors interact functionally with the epigenome and provide systematic evidence that the dysregulation of islet enhancers is relevant to the mechanisms underlying type 2 diabetes.


Figures

Figure 1
Figure 1. Integrative regulatory maps of human pancreatic islet cells
(a) transcription factor binding, active chromatin, and gene transcription maps in human islet cells. (b) Integrative map of the NKX2.2 locus. transcription factor binding and chromatin state profiles are shown for duplicate human islet samples. RNA-Seq tracks correspond to human islets or pooled data from 14 non-pancreatic tissues to highlight islet-specific transcripts. (c) Network topology diagram illustrating that all 5 islet transcription factors show direct auto- and cross-regulatory interactions, and frequently target adjacent genomic sites (see also Supplementary Fig. 2).
Figure 2
Figure 2. transcription factor networks establish distinct types of interactions with the epigenome
(a) k-medians clustering of 95,329 islet accessible chromatin sites (defined by FAIRE and/or H2A.Z-enrichment in two samples) shows 5 subclasses of accessible chromatin (C1-C5) that we refer to as promoter, inactive enhancer, active enhancer, CTCF-bound sites or other, based on previously defined patterns of histone modifications and CTCF binding- (See also Supplementary Fig. 3a). Histone and CTCF reads were calculated in 100 bp bins across 6 Kb windows centered on merged FAIRE/H2A.Z-enriched sites. (b) Average transcription factor binding signal distribution relative to the center of each accessible chromatin class, and percentage of sites in each class bound by at least one transcription factor. Non quantile-normalized reads were processed as described for the panel above. (c) Density of C1, C3 or C3 accessible chromatin sites bound by two or more transcription factors in the sites surrounding the TSSs of 1,000 most islet-specific genes, 1,000 ubiquitously active genes, or 1,000 islet inactive genes. (d,e) Examples of islet-specific transcription factors binding to the 5′ end of ubiquitously active genes TBP and PSMB1, or to the islet-specific T2D susceptibility gene SLC30A8. The regulome track depicts color-coded C1-C5 chromatin states. (f) Co-binding by multiple transcription factors is more common in C3 (active-enhancer) chromatin. The numbers of transcription factor-bound sites consistent in two samples for each category are shown above. (g) Co-binding by three or more transcription factors at C1 (promoter) chromatin is not associated with islet-specific activity of the adjacent gene. (h) Genes located <25 Kb from clusters of C3 sites that are highly bound by transcription factors show enriched expression in islets and β-cells relative to 14 non-islet tissues. Boxes show interquartile range (IQR), notches are 95% confidence intervals of the median, and whiskers extend to either 1.5 times the IQR or to extreme values. Gene expression data from non-pancreatic tissues from panels g and h is broken down by individual tissues in Supplementary Figs. 5d and 7b. P-values were calculated with the Wilcoxon rank-sum test.
Figure 3
Figure 3. Enhancer clusters form functional 3D chromatin domains
(a) Luciferase assays in mouse MIN6 β-cells and 3T3 fibroblasts show that 8/12 transcription factor-bound C3 sites, but not transcription factor-bound C2 and C5 sites, confer cell-specific expression to a minimal promoter (*t-test P < 0.005, compared with empty vector, n =3 transfections per condition). (b) C3-3, a C3 element in a cluster >1 Mb from ISL1, shows selective enhancer activity in pancreatic islet (pi) of zebrafish 70 hpf embryos. The enhancer transgene (YFP) was injected into a transgenic line that exhibits fluorescence (mCherry) in insulin+ cells. (c) MAFB knockdown in human EndoC-βH1 β cells causes downregulation of genes bound by MAFB at clustered (C3+) rather than orphan (C3−) MAFB-bound enhancers. The bar-plot illustrates Gene Set Enrichment Analysis (GSEA) False Detection Rates (FDR) for different MAFB-bound gene sets amongst genes that are downregulated after infecting two shRNAs for MAFB (MAFB KD) vs. 4 non-targeting shRNAs (NT). As a control we repeated the analysis using the same number of arrays but comparing sets of different NT control shRNAs. The horizontal dashed line signals FDR = 0.05 as a reference. See also Supplementary Fig. 9a-e. (d) Misexpression of PDX1 with MAFA and NGN3 in HEK293 cells preferentially activates genes associated to PDX1-bound clustered (C3+) enhancers, but not genes bound by PDX1 at promoter accessible chromatin sites or those associated with orphan (C3−) PDX1-bound enhancers. The number of transcription factor-bound genes for C1-C5 is reported in methods. (e) 4C-Seq analysis shows selective interactions between clustered transcription factor-bound enhancers and cell-specific promoters. Note, for example, interactions between the ISL1 promoter and the C3-3 enhancer tested in zebrafish transgenics and located >1 Mb away (green star). The red triangle indicates the ISL1 promoter viewpoint, pink lines highlight interactions between ISL1 and other sites. The track labeled “4C-Seq” shows aligned sequences, and “4C-Seq sites” are significant interaction sites. (f) 4C-Seq analysis of nine loci shows that C3 sites interact more often than expected with nearby promoters, in contrast with other accessible chromatin classes. The red diamonds depict the mean overlap of different accessible chromatin sites with viewpoint-interacting sites, whereas the grey box plot shows the overlap of randomized accessible chromatin (C1-C5) sites after 1,000 iterations in the same loci. (g) transcription factor-bound C3, but not other transcription factor-bound C-sites, establish frequent interactions with nearby promoters. The boxes show IQR and whiskers extend to 1.5 times the IQR.
Figure 4
Figure 4. Known and novel transcription factor motifs are enriched in clustered islet enhancers
Examples of sequence motifs that are enriched in clustered enhancers at P < 1 × 10−60 (HOMER). Several motifs match known islet transcription factor recognition sequences, whereas others are candidate binding sites for novel regulators. IEF = Islet Enriched Factor. Supplementary Table 3 shows a complete list of motifs that showed enrichment at P < 1 × 10−60 (HOMER).
Figure 5
Figure 5. Islet enhancers are enriched in T2D and FG level-associated loci
(a) Loci associated with complex traits were tested for enrichment of overlap with classes of islet sites (C1-C5, clustered C3, orphan C3) compared to matched background loci. T2D and FG-associated loci were enriched for islet active enhancer sites (C3) but not for directly flanking sites (C3 flank) or for other islet classes. The enrichment of C3 sites for both T2D and FG level was stronger when considering clustered rather than orphan (non-clustered) enhancers. The most significant enrichment for other complex diseases was C1 sites for LDL cholesterol (P = 0.022) and height (P = 0.026) and C3 sites for Alzheimer’s disease (P = 0.038). No significant enrichment of variants associated with other complex traits was seen in clustered C3 enhancers. (b) Enrichment of islet regulome sites in T2D and FG genome wide association data. We determined the number of variants overlapping sites from each islet accessible chromatin class that surpassed a series of association significance thresholds for T2D and FG. We then calculated fold-enrichment values at each threshold by comparing to the number of matched background variants significant at that threshold. C3 sites and clustered C3 sites were more enriched for T2D and FG association at increasing p value thresholds (left panel), even after removing known European T2D/FG loci (right panel). Patterns in C3 and clustered C3 sites were maintained when pruning variants to retain a single variant in each LD block (r2 > 0.2). In all such analyses, clustered C3 sites displayed significant enrichment relative to the null distribution of permuted counts for T2D and FG association P values <0.001 (P values for these analyses are given in the text).
Figure 6
Figure 6. A T2D risk variant at ZFAND3 disrupts islet enhancer activity
(a) Regional plot of 1000 Genomes variants and islet accessible chromatin elements at the ZFAND3 locus associated with T2D in East Asian individuals (r2 values based on 1KG CHB/JPT LD with rs58692659); rs9470794 (in cyan) at this locus shows strongest T2D association from Cho et al. The SNP rs58692659 maps to a C3 site >10 Kb upstream of ZFAND3 bound by PDX1, FOXA2, NKX2.2, and NKX6.1 and (b) disrupts an islet-enriched bHLH-like motif that matches the NEUROD1 recognition site, a known key islet transcription factor. Electrophoretic mobility shift assay shows that the minor allele A at this variant abolishes binding of a protein complex that is supershifted by an anti-NEUROD1 antibody. Competition gradients identified by the grey triangle correspond to 5, 50, and 100-fold excess of cold probe. (c) Luciferase assay shows reduced enhancer activity of allele A compared to G of rs58692659 in MIN6 β-cells. The data are presented as mean ± s.d. Three independent experiments were performed in triplicate. P values were calculated by a two-sided t-test.

Comment in

References

    1. Rada-Iglesias A, et al. A unique chromatin signature uncovers early developmental enhancers in humans. Nature. 2011;470:279–83. - PMC - PubMed
    1. Heintzman ND, et al. Histone modifications at human enhancers reflect global cell-type-specific gene expression. Nature. 2009;459:108–12. - PMC - PubMed
    1. Creyghton MP, et al. Histone H3K27ac separates active from poised enhancers and predicts developmental state. Proc Natl Acad Sci U S A. 2010;107:21931–6. - PMC - PubMed
    1. Bonn S, et al. Tissue-specific analysis of chromatin state identifies temporal signatures of enhancer activity during embryonic development. Nat Genet. 2012;44:148–56. - PubMed
    1. Gaulton KJ, et al. A map of open chromatin in human pancreatic islets. Nat Genet. 2010;42:255–9. - PMC - PubMed

Publication types

MeSH terms