. 2014 Jul 1;522(10):2299-318.
doi: 10.1002/cne.23535.

Calretinin and calbindin distribution patterns specify subpopulations of type I and type II spiral ganglion neurons in postnatal murine cochlea

Affiliations

Calretinin and calbindin distribution patterns specify subpopulations of type I and type II spiral ganglion neurons in postnatal murine cochlea

Wenke Liu et al. J Comp Neurol. .

Abstract

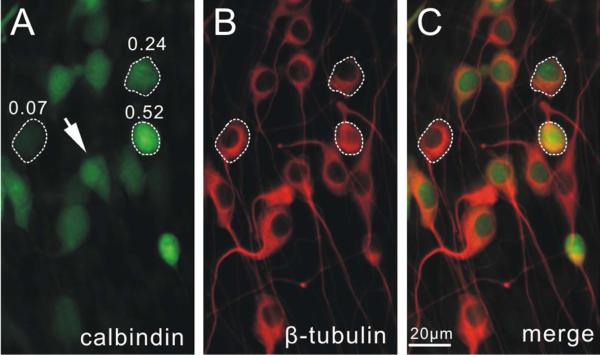
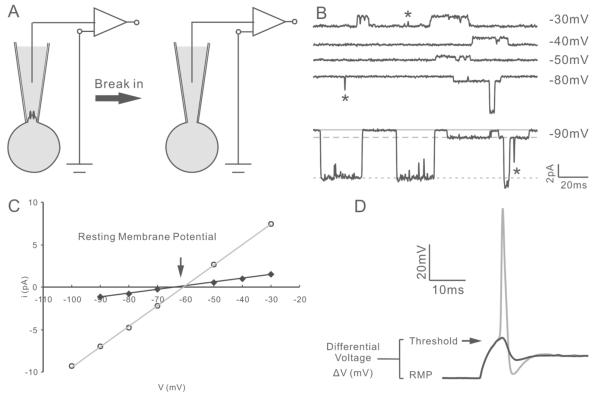
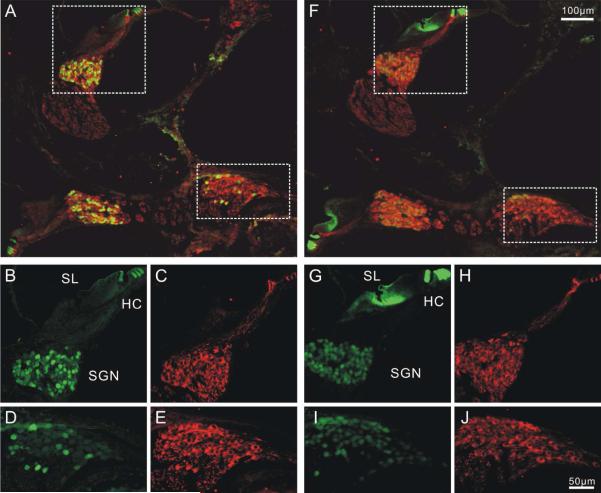
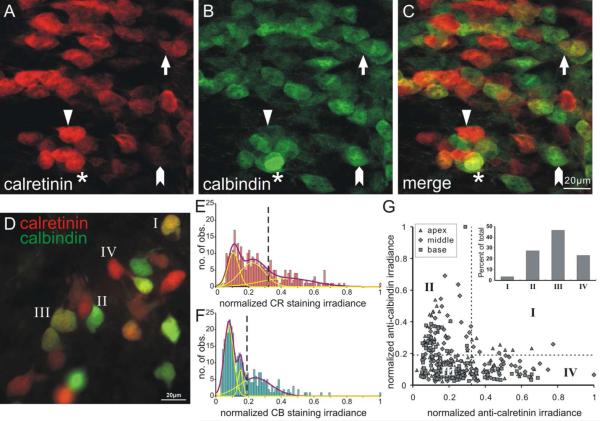
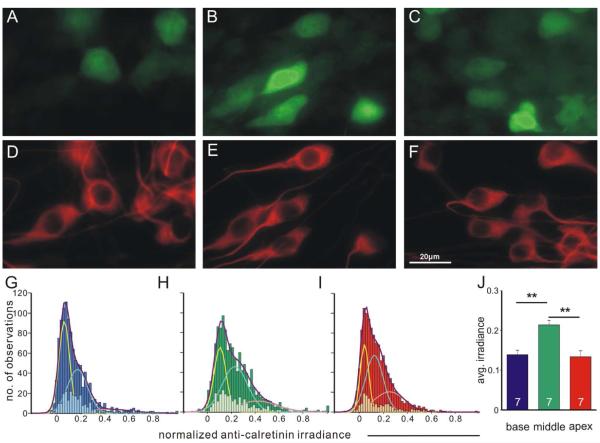
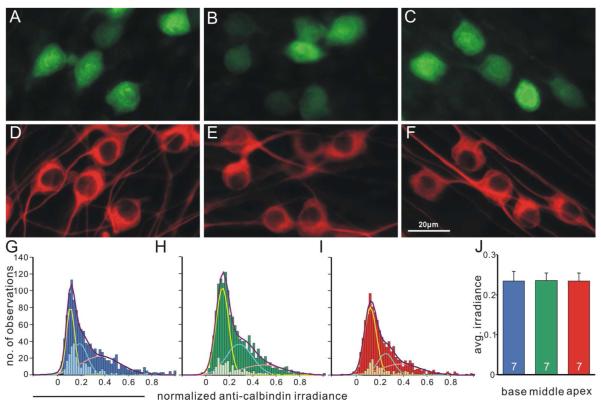
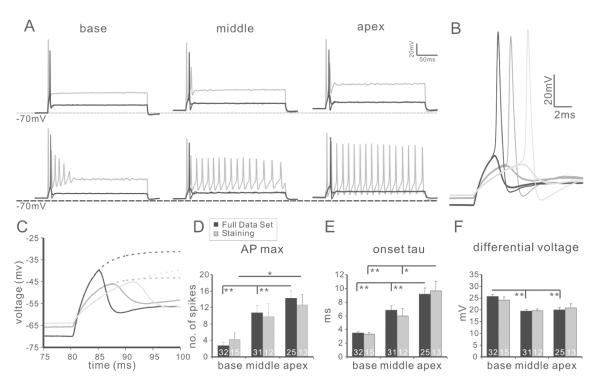
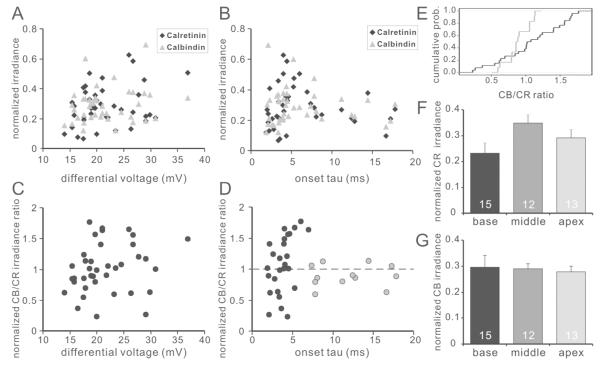
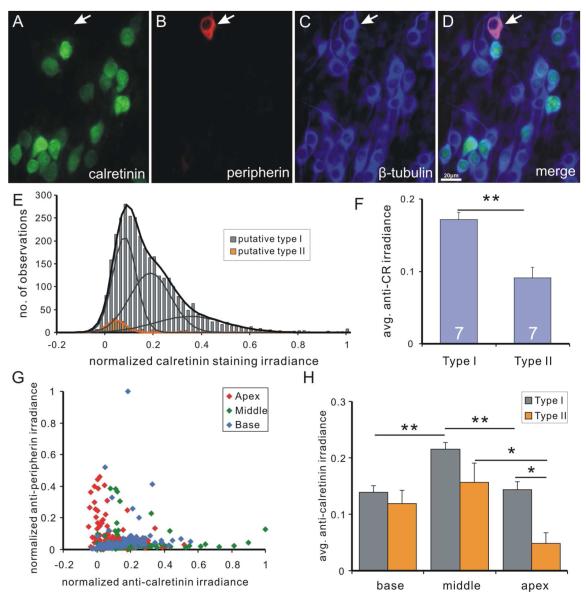
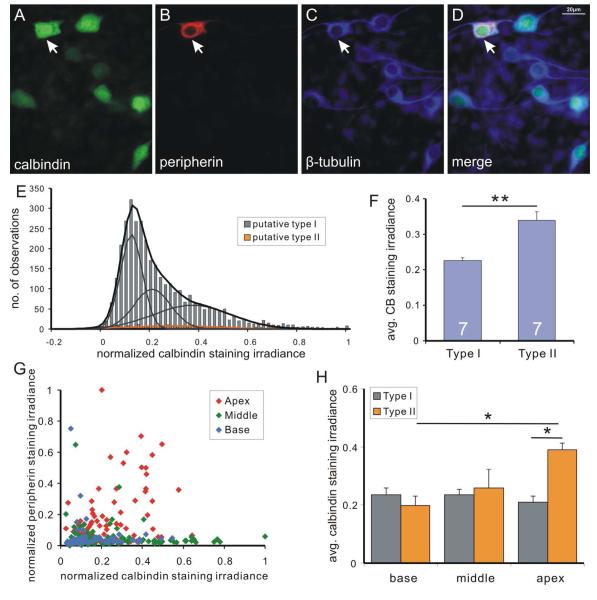
As the first neural element in the auditory pathway, neurons in the spiral ganglion shape the initial coding of sound stimuli for subsequent processing. Within the ganglion, type I and type II neurons form divergent and convergent innervation patterns, respectively, with their hair cell sensory receptors, indicating that very different information is gathered and conveyed. Layered onto these basic innervation patterns are structural and electrophysiological features that provide additional levels of processing multifaceted sound stimuli. To understand the nature of this additional complexity of signal coding, we characterized the distribution of calretinin and calbindin, two regulators of intracellular calcium that serve as markers for neuronal subpopulations. We showed in acute preparations and in vitro that calretinin and calbindin staining levels were heterogeneous. Immunocytochemical analysis of colocalization further showed that high levels of staining for the two molecules rarely overlapped. Although varied amounts of calbindin and calretinin were found within each tonotopic location and neuronal type, some distinct subdistributions were noted. For example, calretinin levels were highest in neurons innervating the midcochlea region, whereas calbindin levels were similar across the entire ganglion. Furthermore, we noted that apical type II neurons, identified by antiperipherin labeling, had significantly lower levels of calretinin and higher levels of calbindin. We also established that the endogenous firing feature of onset tau of the subthreshold response showed a pattern related to quantified calretinin and calbindin staining levels. Taken together, our results suggest an additional dimension of complexity within the spiral ganglion beyond that currently categorized.

Keywords: calbindin; calretinin; spiral ganglion.


Figures

Figure 1
Figure 1. Subcellular distribution and characterization of immunostaining levels
Representative double immune-stained images of neuronal cultures using anti-calbindin (A) and anti-β-tubulin (B) antibodies. C, merged image. Note that calbindin staining was heterogeneous while β-tubulin staining level was relatively uniform in all cells. Arrow, a neuron stained with anti-calbindin antibody showed brighter spots in the nuclei, suggesting differential staining levels within different sub-cellular compartments. Three cells with high, intermediate and low levels were circled with dashed line, and the normalized calbindin staining irradiance values was indicated on top of each cell in A. A magenta-green version of this figure is available as supplementary materials.
Figure 2
Figure 2. Non-invasive measurement of resting membrane potential
A, diagram of the recording procedure. Cell-attached single channel recording was used to non-invasively assess the resting membrane potential (left). Additional suction was applied to break-in for subsequent whole-cell current clamp recording (right). B, single channel traces at the indicated test potentials from −60mV holding potential. Based on relative amplitude, two types of channel openings with small and large amplitudes could be observed. Solid line, closed state; dashed line, opening of the small-conductance channel; dotted line, opening of the large-conductance channel. Transient currents (asterisk) were due to incomplete channel opening events and were not used for the analysis of conductance. C, I-V relation of two channels plotted from the recordings in B. The two channels exhibited distinctive conductances (43.7pS and 240.6pS) but comparable reversal potentials (−63.5mV and −60.3mV, respectively). D, superimposed exemplary traces showing sub-threshold (black) and threshold (gray) measurements of voltage threshold and differential voltage. The cell was held at the endogenous resting membrane potential calculated on-line from cell-attached recording.
Figure 3
Figure 3. Distribution patterns of calretinin and calbindin in P6 mouse cochlea
Two cochlear sections in close proximity were stained with anti-calretinin (A-E) and anti-calbindin antibodies (F-J) respectively. Both anti-calretinin and anti-calbindin antibody staining showed heterogeneous patterns in the spiral ganglion. HC, hair cell. SGN, spiral ganglion. SL, spiral limbus. A, Low magnification image of cochlear sections double labeled with anti-β-tubulin (red) and anti-calretinin (green) antibodies B-E, High magnification images of middle (B-C) and basal (D-E) neuronal regions enclosed by dotted line in A. F, low magnification image of a cochlear section showing double labeling of anti-calbindin (green) and anti-β-tubulin (red) antibodies. Prominent calbindin staining was also observed in the spiral limbus G-J, High magnification image of the middle (G, H) and basal (I,J) regions as squared in F. Scale bar in F applies to A, F. Scale bar in J applied to B-E, G-J. A magenta-green version of this figure is available as supplementary materials.
Figure 4
Figure 4. Calretinin and calbindin exhibited differential distribution patterns in murine spiral ganglion
A-C, The mid-cochlear region of a whole-mount preparation of P7 mouse spiral ganglion labeled with mouse anti-calretinin (A) and rabbit anti-calbindin (B) antibodies. C, The merged image of A and B. Most cells were labeled by mainly calretinin (triangle), mainly calbindin (arrowhead), or a low level of both (arrow). Only a few neurons possessed a high level of both staining (asterisk). Scale bar in C (20μm) applies to A-C. D, Superimposed image of in vitro culture shows heterogeneous distribution pattern of calretinin and calbindin that range from mainly calretinin-staining cells (red) to mainly calbindin staining cells (green) similar to A-C. Example cells were labeled according to the four categories in G. Frequency histograms of normalized calretinin staining irradiance (E) and normalized calbindin staining irradiance (F) were constructed from measurements of the same single experiment as shown in D (total number of measurements = 320). Both histograms were composed of multiple populations with distinct staining irradiance levels which could be fit by the sum of three Gaussians with discrete means. The vertical dashed lines (E and F, respectively) delineate the mid points between high and medium means of Gaussian fits of normalized calretinin (0.32) and normalized calbindin (0.19) staining irradiance used in G inset. G, scatter plot of normalized calretinin and calbindin staining measurements in each neuron. Inset, Cells were divided into four categories to highlight relative irradiance patterns based on both x and y cutoffs (dotted lines in E-F).
Figure 5
Figure 5. Calretinin staining irradiance is heterogeneous in all tonotopic regions and shows higher average values in the middle region
A-C, Cultured neurons isolated from base, middle and apex respectively, labeled with polyclonal anti-calretinin antibody. D-F, same neurons in A-C labeled with neuron-specific anti-β-tubulin antibody. Scale bar in D applies to A-F. G-I, Frequency histograms of all data in the seven individual experiments pooled for base (G, dark blue bars, total No. of measurements, 1057), middle (H, dark green bars, total No. of measurements, 1262) and apex (I, dark red bars, total No. of measurements, 1162), fitted by the sum (purple curves) of three Gaussians (yellow, cyan and pink curves) with distinct means, indicating the presence of multiple populations with different calretinin staining levels within each region. Measurements from one representative individual experiment shown as subsets of the pooled data (G, light blue bars; H, light green bars; I, light red bars) displayed similar heterogeneity in all tonotopic positions. j, Average calretinin staining irradiance is significantly higher (p<0.01) in the middle (n=7).
Figure 6
Figure 6. Calbindin staining pattern displays local heterogeneity but is generally even across different tonotopic regions
A-C, Cultured neurons isolated from base, middle and apex respectively, labeled with polyclonal anti-calbindin antibody. D-F, Same neurons in A-C labeled with neuron-specific anti-β-tubulin antibody. Scale in F applies to A-F. G-I, Frequency histograms of normalized calbindin staining irradiance measurements from seven combined experiments were best fitted by the sum (purple curves) of three Gaussians (yellow, cyan and pink curves) with distinct means for base (G, dark blue bars, total No. of measurements, 1156), middle (H, dark green bars, total No. of measurements, 1463) and apex (I, dark red bars, total No. of measurements, 1018). Data points obtained from a single experiment exhibited as subsets of the full data set in each region and displayed heterogeneity. J, average calbindin staining irradiance is comparable in each region (n=7).
Figure 7
Figure 7. Characterization of spiral ganglion neuron firing properties
A, example traces from base (left panel), middle (middle panel) and apex (right panel) neurons. Both rapidly (upper traces) and slowly (bottom traces) accommodating types of neurons were observed in each region. For each recording, sub-threshold (thick black line), threshold (thin black line) and APmax (gray line) traces are shown as overlay. B, overlay of just sub-threshold (thick line) and threshold (thin line) traces from base (black), middle (dark gray) and apex (light gray). C, Sub-threshold traces in B could be fitted with double exponential functions (dotted line). D-F, Tonotopic variation of representative intrinsic firing features. Consistent with previous reports, the accommodation of neuronal firing characterized by AP max (D) and the kinetics-related parameter time constant (E) was graded linearly from base to apex while excitability-related parameter differential voltage (F) showed a non-linear trend across different regions. The full data set (D-F, black bars) and a subset of recordings associated with immunostaining measurements (D-F, gray bars) showed the same tonotopic trend. *, p<0.05; **, p<0.01.
Figure 8
Figure 8. Normalized calbindin/calretinin staining irradiance ratio correlates with action potential kinetics
A-B, relation of calretinin (black diamond) and calbindin (gray triangle) staining irradiance with differential voltage (A) and threshold onset time course (B). Each data point represents a single recording from one neuron. Neither calretinin nor calbindin staining irradiance correlate with the tested neuronal intrinsic firing properties. C-D, Relationship between the ratio of normalized calbindin to calretinin staining irradiance with differential voltage (C) and onset tau (D). Data from neurons with fast (onset tau< 7.0ms) and slow (onset tau>7.0ms) kinetics were color coded in black and gray, respectively. E, Cumulative probability of the normalized calbindin/calretinin staining irradiance of fast (black curve) and slow (gray curve) neurons shown in D; two sample Kolomgorov-Smirnov test, p<0.05. F-G, average calretinin (F) and calbindin (G) staining irradiance of recorded neurons from different tonotopic regions show a similar trend as in Fig. 4 and Fig. 5.
Figure 9
Figure 9. Calretinin staining irradiance is consistently low in putative type II spiral ganglion neurons
A-D, spiral ganglion neurons in a neuronal culture triple-labeled with polyclonal anti-calretinin (A), anti-peripherin (B) and anti-β-tubulin (C) antibodies (D, merged image). Calretinin staining irradiance is undetectable in a putative type II neuron (arrow) with high peripherin staining irradiance. E, frequency histogram of calretinin staining irradiance measurements from seven pooled experiments. Cells with the highest 5% of peripherin staining irradiance (relative to the total number of neurons) were defined as putative type II neurons. Putative type I neurons (gray bars) are best fitted by the sum (black curve) of three Gaussians (gray curves) and histogram of putative type II neurons (orange bars) is best fitted by a single Gaussian (orange curve). F, average calretinin staining irradiance of type I neurons in an entire experiment is significantly higher than that of type II neurons (p<0.01, n=7). G, scatter plot of normalized calretinin staining irradiance and normalized peripherin staining irradiance from the same experiment as in E. H, Average calretinin staining irradiance level for type I (gray bars) and type II (orange bars) in different tonotopic regions. *, p<0.05, **, p<0.01.
Figure 10
Figure 10. Heterogeneous and generally higher levels of calbindin staining irradiance were observed in type II spiral ganglion neurons
A neuronal culture triple-labeled with polyclonal anti-calbindin (A), anti-peripherin (B), and anti-β-tubulin (C) antibodies (D, merged). In contrast to calretinin staining, a putative type II neuron (arrowhead) with high peripherin staining irradiance also had high calbindin staining irradiance. Highest 5% peripherin labeled cells were defined as putative type II neurons. E, frequency histogram of calbindin staining irradiance data from seven pooled experiments. Putative type I neurons (gray bars) is best fitted by sum (black curve) of three Gaussians (gray curves) and histogram for putative type II neurons (orange bar) is best fitted by a single Gaussian (orange curve). F, average calbindin staining irradiance of type I neurons across all experiments is significantly lower than that of type II neurons (p<0.01, n=7). G, scatter plot of normalized calbindin and peripherin staining irradiance from an example experiment. H, average calbindin staining irradiance level for type I (gray bars) and type II (orange bars) in different tonotopic regions. *, p<0.05, **, p<0.01.

Similar articles

Cited by

References

    1. Adamson CL, Reid MA, Mo Z-L, Bowne-English J, Davis RL. Firing features and potassium channel content of murine spiral ganglion neurons vary with cochlear location. J Comp Neurol. 2002;447:331–350. - PubMed
    1. Airaksinen MS, Eilers J, Garaschuk O, Thoenen H, Konnerth A, Meyer M. Ataxia and altered dendritic calcium signaling in mice carrying a targeted null mutation of the calbindin D28k gene. Proc Natl Acad Sci U S A. 1997;94:1488–1493. - PMC - PubMed
    1. Angelo K, Rancz EA, Pimentel D, Hundahl C, Hannibal J, Fleischmann A, Pichler B, Margrie TW. A biophysical signature of network affiliation and sensory processing in mitral cells. Nature. 2012;488:375–378. - PMC - PubMed
    1. Baizer JS, Broussard DM. Expression of calcium-binding proteins and nNOS in the human vestibular and precerebellar brainstem. J Comp Neurol. 2010;518:872–895. - PubMed
    1. Bizley JK, Walker KMM. Sensitivity and selectivity of neurons in auditory cortex to the pitch, timbre, and location of sounds. Neuroscientist. 2010;16:453–469. - PubMed

Publication types