. 2014 Feb 15;120(4):579-88.
doi: 10.1002/cncr.28555. Epub 2014 Jan 10.

EWS-FLI-1 regulates the neuronal repressor gene REST, which controls Ewing sarcoma growth and vascular morphology

Affiliations

EWS-FLI-1 regulates the neuronal repressor gene REST, which controls Ewing sarcoma growth and vascular morphology

Zhichao Zhou et al. Cancer. .

Abstract

Background: RE1-silencing transcription factor (REST), a neuronal repressor gene, regulates neuronal stem cell differentiation. Ewing sarcoma may originate from neural crest cells. In the current study, the authors investigated whether REST plays a role in the growth of this tumor.

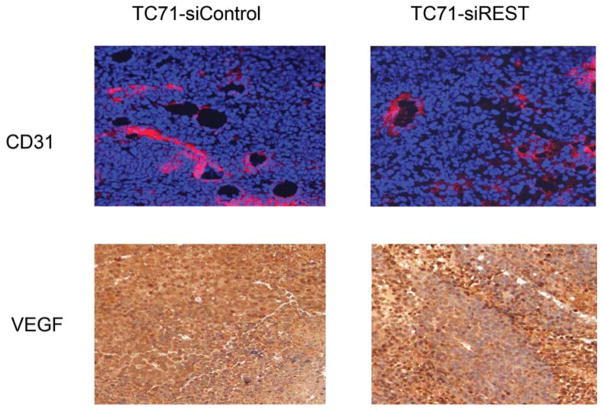
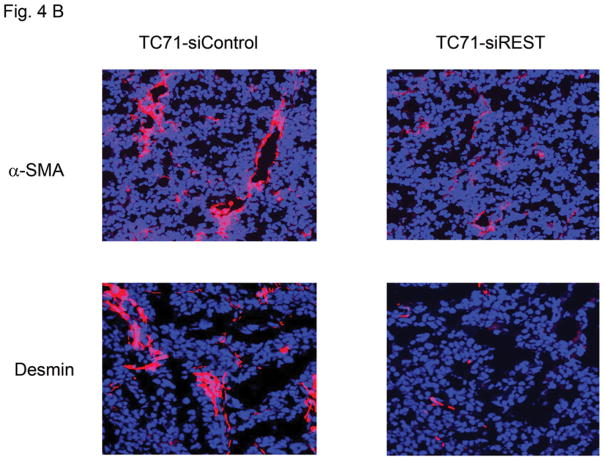
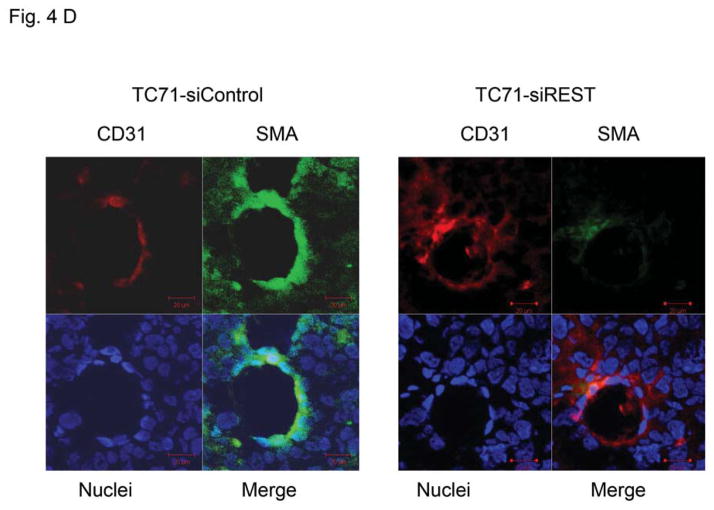
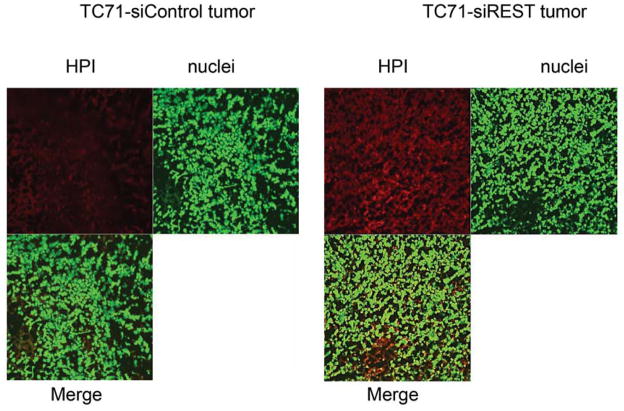
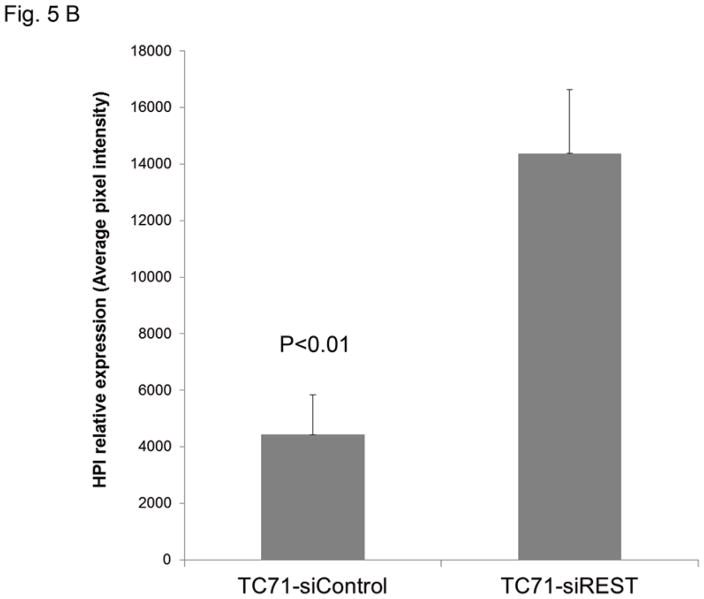
Methods: REST expression was determined by Western blot analysis and reverse transcription-polymerase chain reaction in 3 human Ewing sarcoma cell lines and 7 patient tumor samples. The role of REST in tumor growth and tumor vascular morphology was determined using a Ewing sarcoma xenograft model. Immunofluorescence staining, Hypoxyprobe, and terminal deoxynucleotidyl transferase-mediated dUTP nick end labeling (TUNEL) assays were performed to investigate the impact of REST on pericyte marker expression, hypoxia, and apoptosis in vivo.

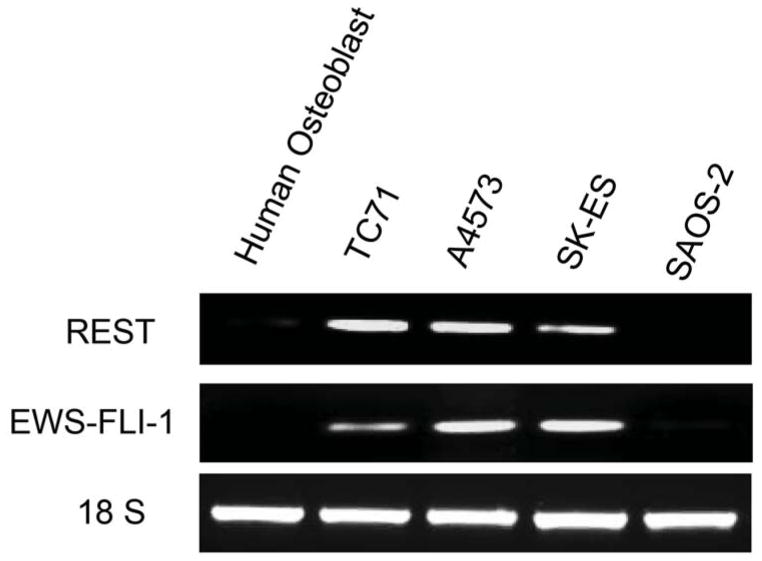
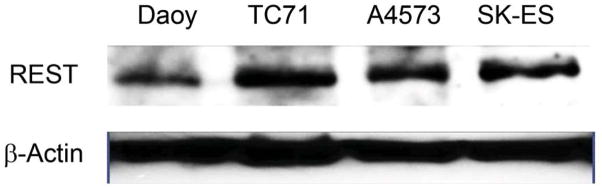
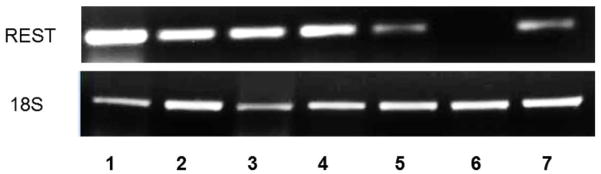
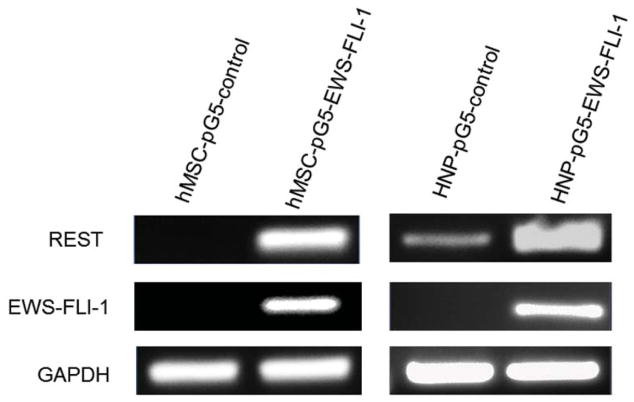
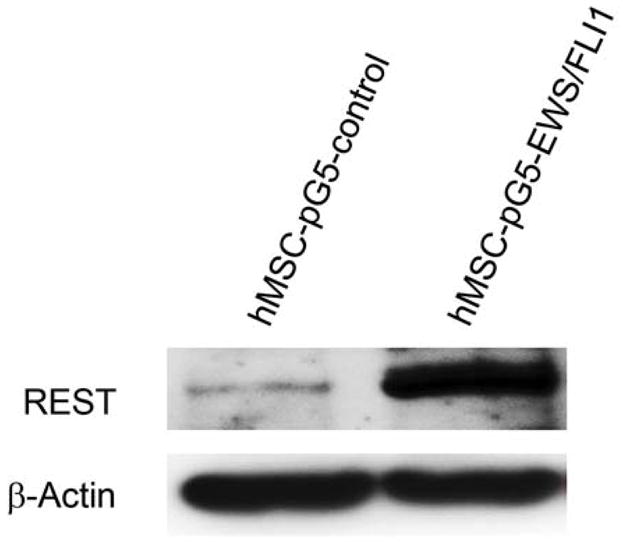
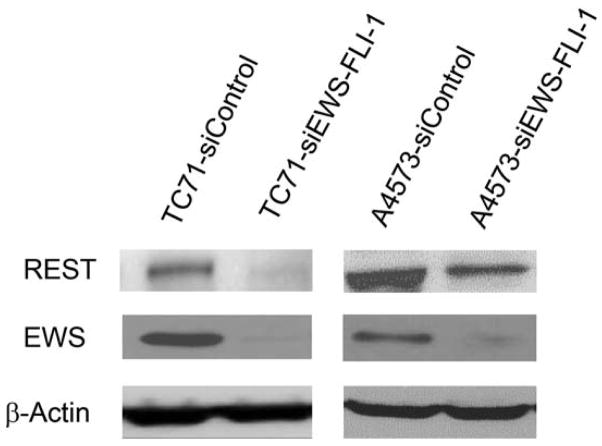
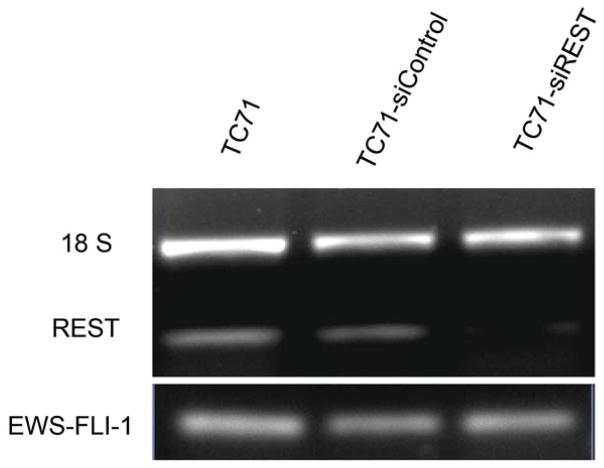
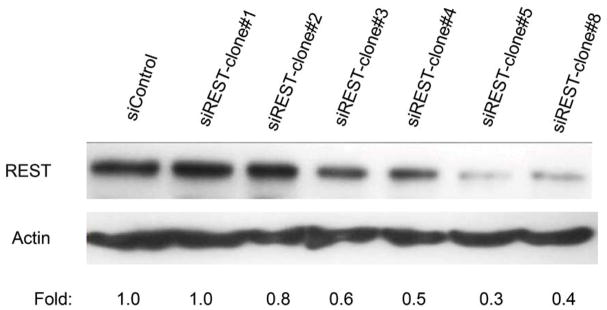
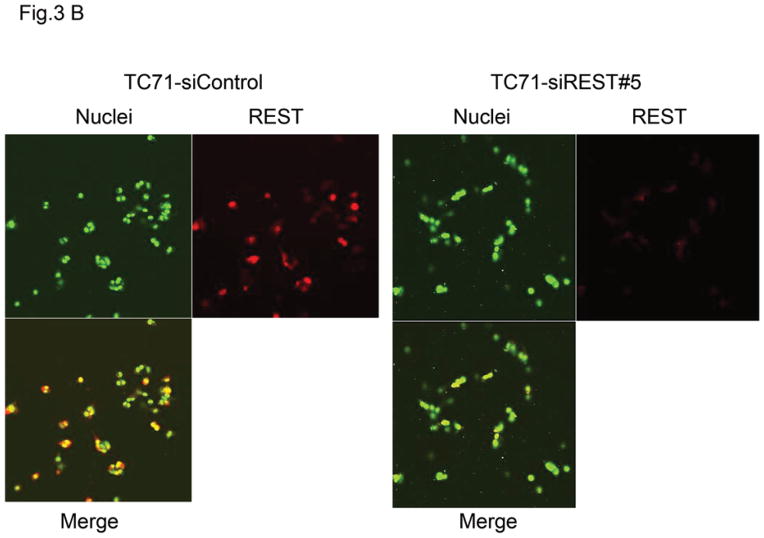
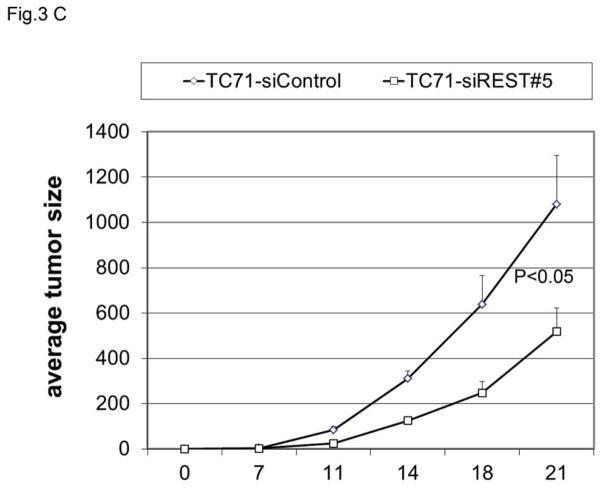
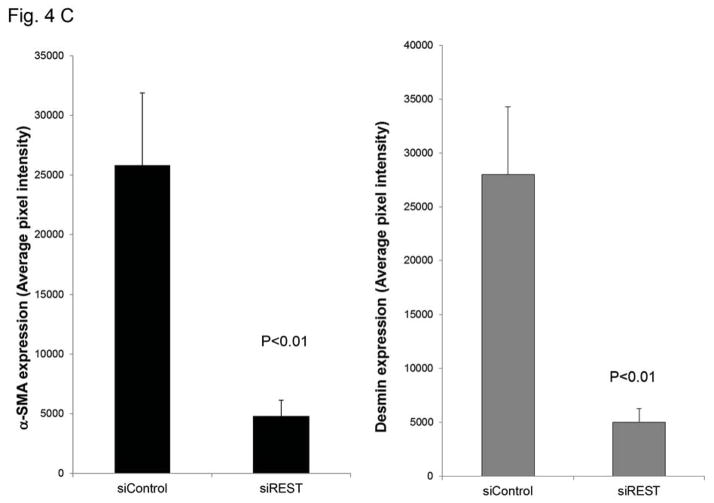
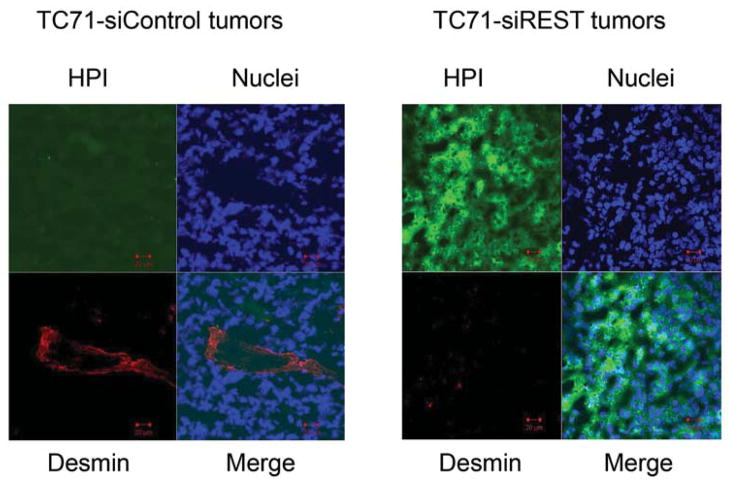
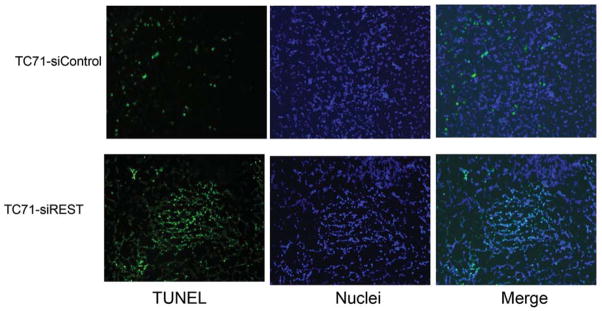
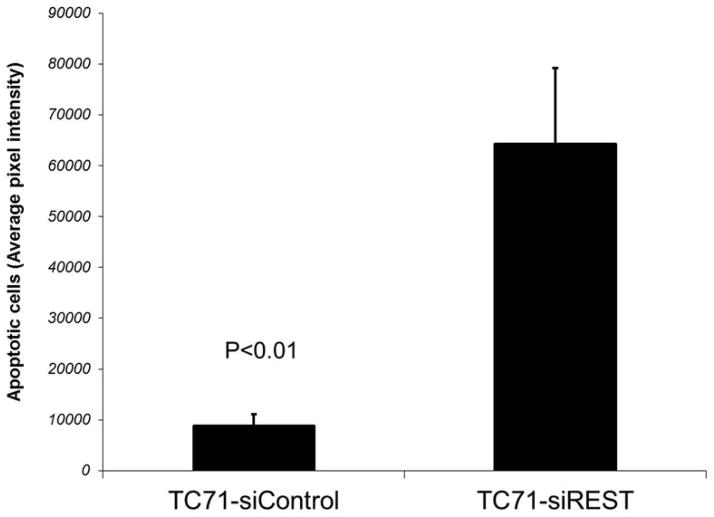
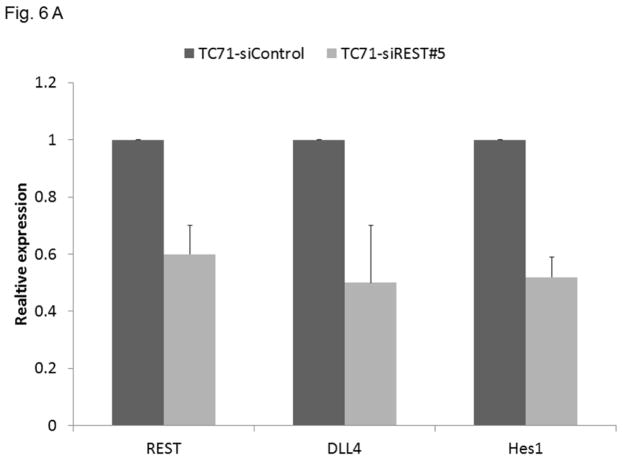
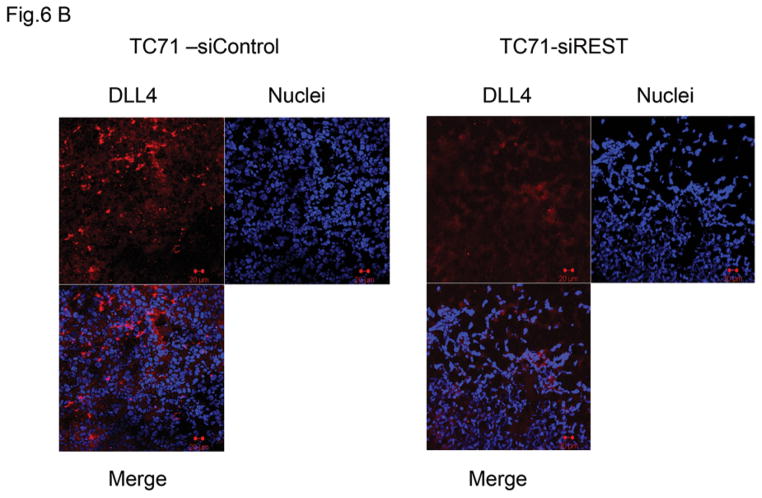
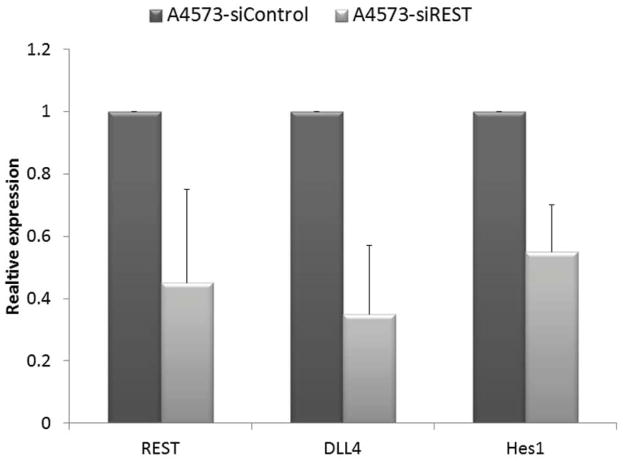
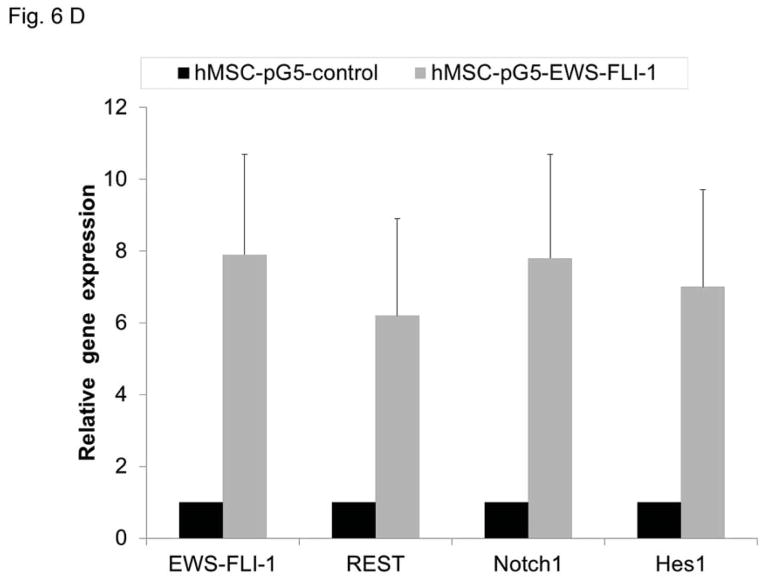
Results: High levels of REST were expressed in all 3 human Ewing sarcoma cell lines and in 6 of the 7 patient tumor samples. Overexpression of EWS-FLI-1 in human mesenchymal stem cells and human neural progenitor cells was found to increase REST expression. Inhibition of EWS-FLI-1 using small interfering RNA decreased REST expression in human Ewing sarcoma cells. Inhibition of REST did not affect EWS-FLI-1, but significantly suppressed tumor growth in vivo, reduced the tumor vessel pericyte markers α- smooth muscle actin (SMA) and desmin, increased hypoxia and apoptosis in tumor tissues, and decreased the expression of delta-like ligand 4 (DLL4) and Hes1.

Conclusions: Inhibition of REST suppressed tumor growth, inhibited pericyte marker expression, and increased tumor hypoxia and apoptosis. Because tumor vessel function has been linked to tumor growth and metastases, REST may be a new therapeutic target in patients with Ewing sarcoma.

Keywords: EWS-FLI-1; Ewing sarcoma; RE1-silencing transcription factor (REST); tumor growth; tumor vasculature.


Conflict of interest statement

Conflict of interest disclosures: All authors declare no financial disclosure.

Figures

Figure 1
Figure 1. Expression of REST in human Ewing sarcoma cell lines and patient tumor samples
A. REST and EWS-FLI-1 expression levels were determined by RT-PCR in TC71, A4573, and SK-ES cells; normal human osteoblasts and SAOS-2 human osteosarcoma cells. The 18S primer was used as the internal control. B. REST protein expression in TC71, A4573, SK-ES Ewing sarcoma cells and SAOS-LM7 osteosarcoma cells was examined by Western blot. Daoy human medulloblastoma cells served as the positive control. β-Actin was used as the internal control. C. REST expression was detected by RT-PCR in seven Ewing sarcoma patient tumor samples. The18S primer was used as the internal control.
Figure 2
Figure 2. EWS-FLI-1 regulated REST expression in hMSC, HNP and TC71 cells
A. hMSC (left panel) and HNP( right panel) cells were transfected with pG5-EWS-FLI-1 or a control plasmid. REST and EWS-FLI-1 expression levels were determined by RT-PCR. GAPDH was used as the internal control. B. hMSC were transfected with pG5-EWS-FLI-1 or a control plasmid. REST protein expression was detected by Western blot. β-Actin was used as the internal control. C. TC71 and A4573 human Ewing sarcoma cells were transfected with siEWS-FLI-1 or siControl vector. EWS and REST protein levels were determined by Western blot. β-Actin was used as the internal control. D. TC71 cells were transfected with siREST or the siControl vector. EWS-FLI-1 and REST levels were determined by RT-PCR. The 18S primer was used as the internal control.
Figure 3
Figure 3. Effect of REST inhibition on tumor growth in vivo
A. TC71 cells were transfected with siREST or the siControl vector. Transfected cell clones were screened for REST protein levels by Western blot. Relative REST protein expression levels were determined by densitometry and adjusted by β-actin. B. REST expression (red) was examined by immunofluorescent staining in TC71–siREST clone #5 and TC71–siControl cells. Cell nuclei were stained by Sytox Green. C. TC71–siREST#5 cells or siControl cells were subcutaneously injected into nude mice (n=10). Tumor size was measured twice a week, and average tumor size was calculated (bar: standard error). The difference in tumor size between the two cell types was statistically significant (P<0.05).
Figure 4
Figure 4. Inhibition of REST reduced vessel pericyte marker Desmin and α-SMA expression but not the expression of CD31 or VEGF in tumor tissues
A. CD31 and VEGF were detected by immunofluorescent and immunohistochemical staining in TC71–siREST and siControl tumors, respectively. B. Tumors were analyzed for the pericyte markers α-SMA and desmin (red) by immunofluorescent staining. C. α-SMA and desmin expression levels were quantified by Simple PCI software in at least five random microscope fields from different samples, and group averages were calculated. The differences in expression levels between the two groups were statistically significant (P< 0.01). D. Double immunofluorescent staining for CD31 (red) and α-SMA (green) was performed in TC71–siREST clone#5 and TC71–siControl tumor samples. α-SMA, but not CD31, expression was lower in TC71–siREST clone#5 tumor tissues than that in TC71–siControl tumor tissues.
Figure 5
Figure 5. Suppression of REST increased hypoxia and apoptosis in TC71 tumor tissues
A. Hypoxyprobe (HPI) was injected into mice 150 min before sacrifice. Tumor tissues were analyzed using anti-hypoxyprobe antibody to detect HPI expression (red) in TC71–siREST and TC71–siControl tumors. B. HPI expression was quantified by microscopy software Simple PCI in at least five random microscopy fields from different samples, and averages were calculated. The difference between the two groups was statistically significant (P<0.01). C. HPI (green) and desmin (red) double immunofluorescent staining was performed. HPI expression levels were higher and desmin expression levels were lower in TC71–siREST tumor samples than those in TC71–siControl samples. D. TUNEL assay was performed to detect apoptotic cells (green) in TC71–siREST and TC71-siControl tumor samples. E. Apoptotic cells were quantified by Simple PCI in at least five random microscopy fields, and group averages were calculated. The difference between the two groups was statistically significant (P<0.01).
Figure 6
Figure 6. Inhibition of REST suppressed DLL4 and Hes1 expression in TC71 and A4573 cells, EWS-FLI-1 up-regulated REST, Notch1, and Hes1 expression in hMSC
A. RNA was extracted from TC71–siREST#5 or TC71–siControl cells. REST, DLL4 and Hes1 levels were quantified by real-time PCR, and the mean for three independent experiments was calculated. Bars represent standard deviations. B. DLL4 expression (red) was examined by immunofluorescent staining in TC71–siREST and TC71–siControl tumor tissues. C. REST, DLL4 and Hes1 expressions were determined by real-time PCR in A4573-siREST and A4573-siControl cells. The averages for three independent experiments were determined. The difference between the two cell types was statistically significant (P < 0.01). The bar represents standard deviation. D. hMSC were transfected with pG5-EWS-FLI-1 or pG5-control vector. EWS-FLI-1, REST, Notch1 and Hes1 expression levels were detected by real-time PCR in these cells.

References

    1. Riggi N, Stamenkovic I. The Biology of Ewing sarcoma. Cancer Lett. 2007;254:1–10. - PubMed
    1. Barker LM, Pendergrass TW, Sanders JE, Hawkins DS. Survival after recurrence of Ewing's sarcoma family of tumors. J Clin Oncol. 2005;23:4354–4362. - PubMed
    1. Miser JS, Krailo MD, Tarbell NJ, et al. Treatment of metastatic Ewing's sarcoma or primitive neuroectodermal tumor of bone: evaluation of combination ifosfamide and etoposide--a Children's Cancer Group and Pediatric Oncology Group study. J Clin Oncol. 2004;22:2873–2876. - PubMed
    1. Rorie CJ, Thomas VD, Chen P, Pierce HH, O'Bryan JP, Weissman BE. The Ews/Fli-1 fusion gene switches the differentiation program of neuroblastomas to Ewing sarcoma/peripheral primitive neuroectodermal tumors. Cancer Res. 2004;64:1266–1277. - PubMed
    1. von Levetzow C, Jiang X, Gwye Y, et al. Modeling initiation of Ewing sarcoma in human neural crest cells. PLoS One. 2011;6:e19305. - PMC - PubMed

Publication types

MeSH terms

Substances

LinkOut - more resources