. 2014 Feb 27;123(9):1341-52.
doi: 10.1182/blood-2013-03-488114. Epub 2014 Jan 10.

Differentiation therapy for the treatment of t(8;21) acute myeloid leukemia using histone deacetylase inhibitors

Affiliations

Differentiation therapy for the treatment of t(8;21) acute myeloid leukemia using histone deacetylase inhibitors

Michael Bots et al. Blood. .

Abstract

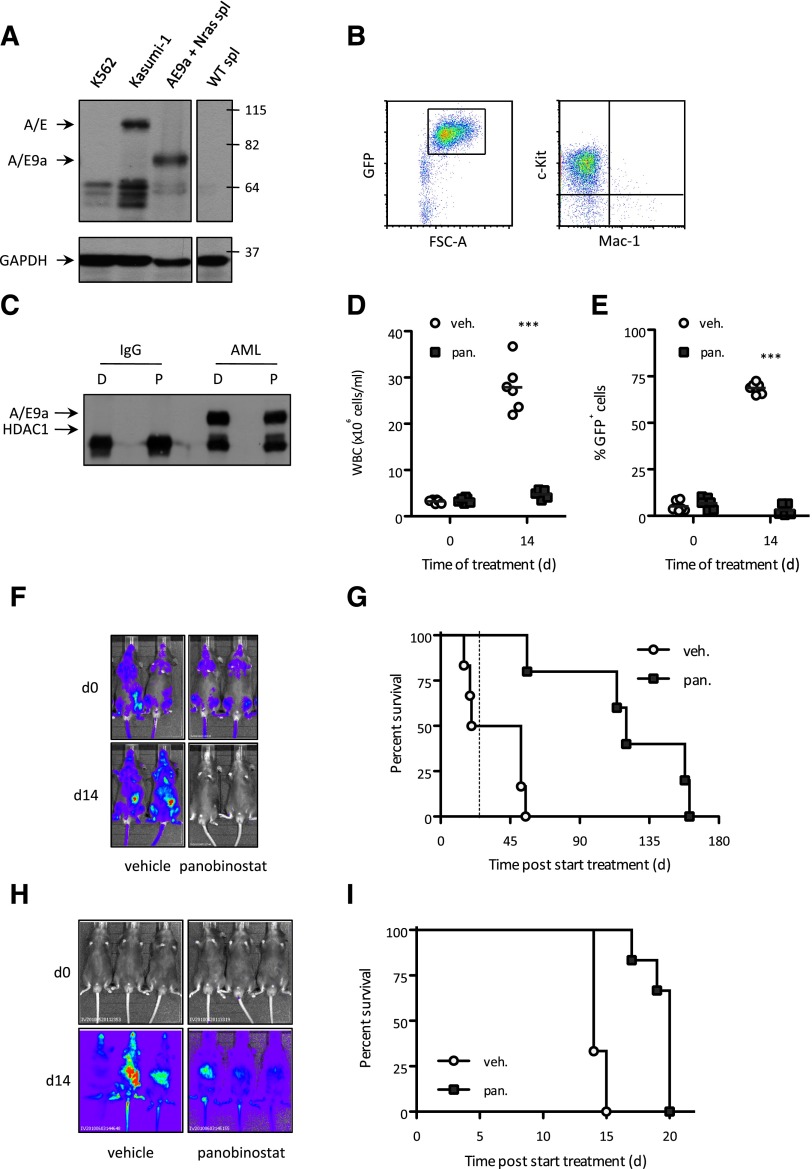
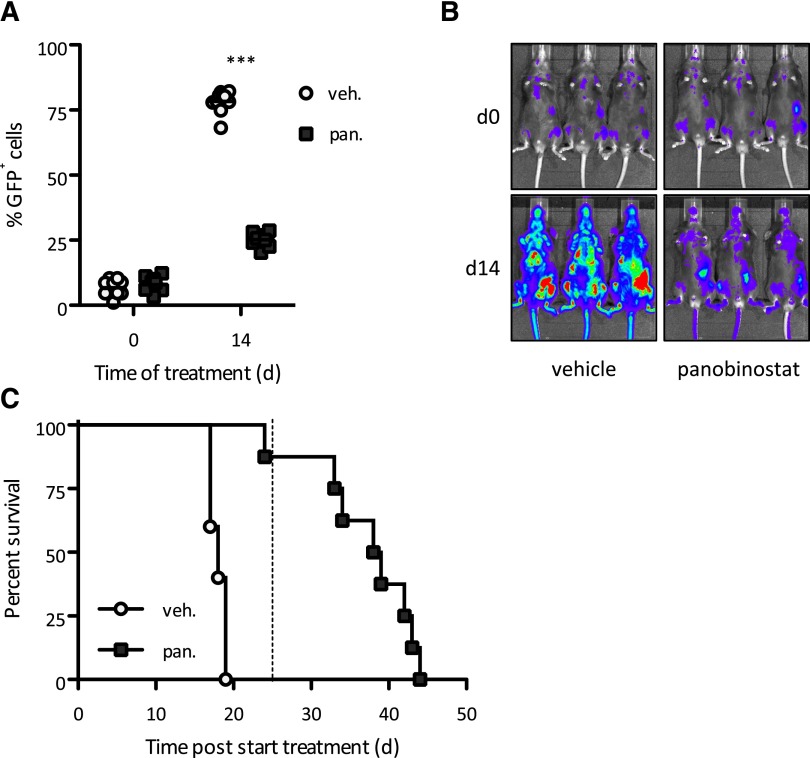
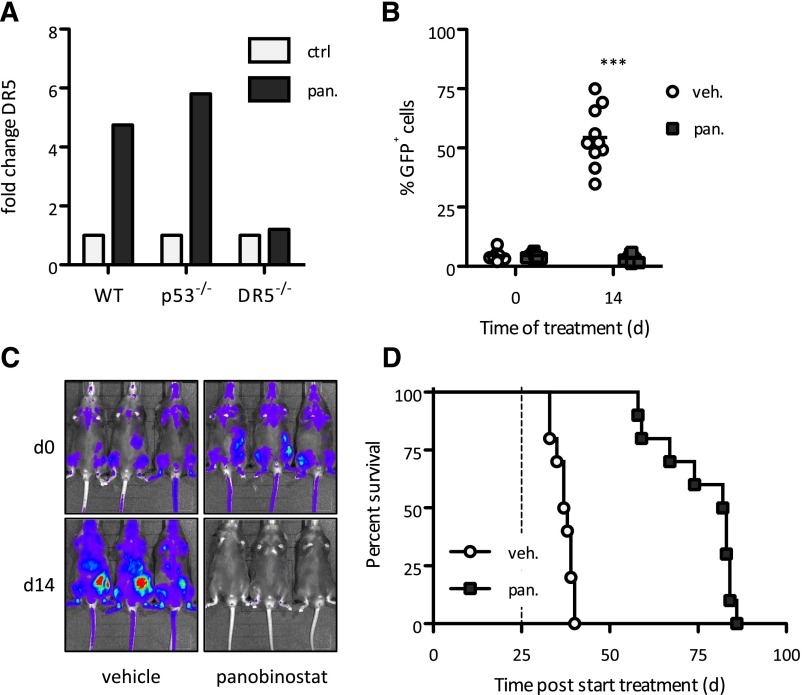
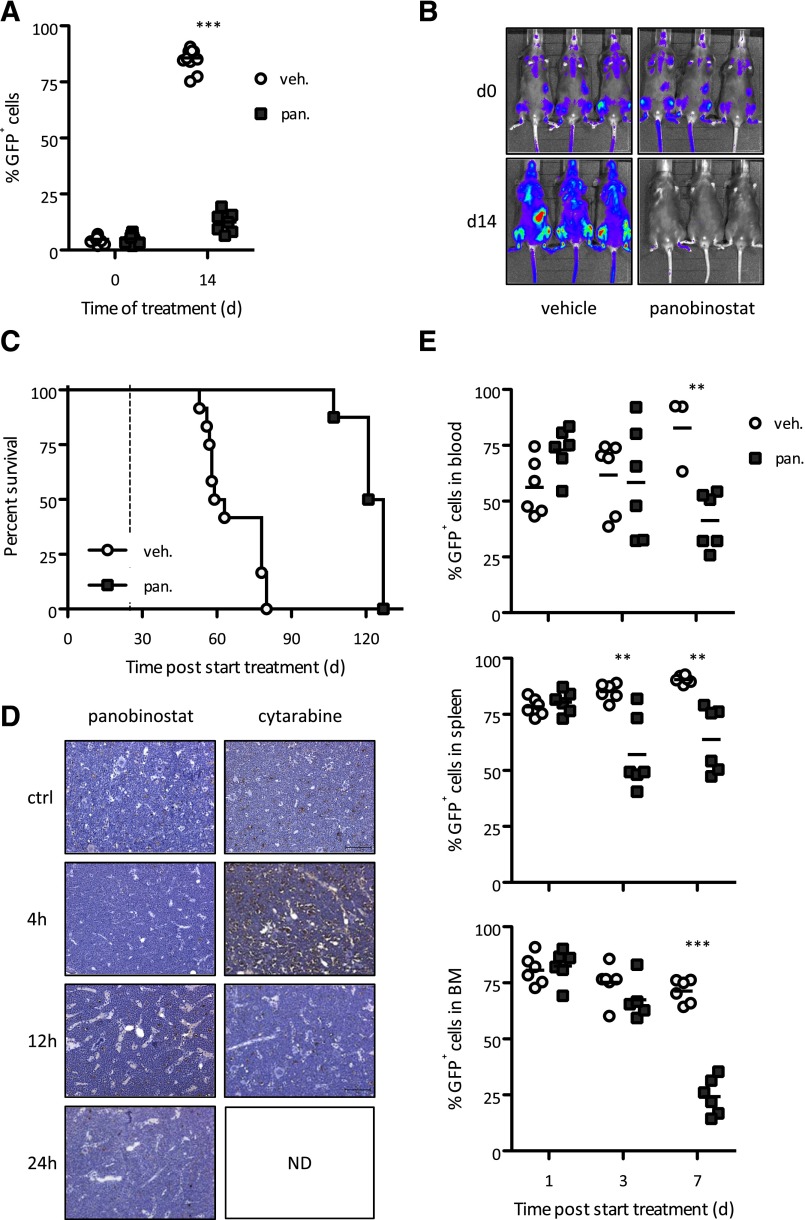
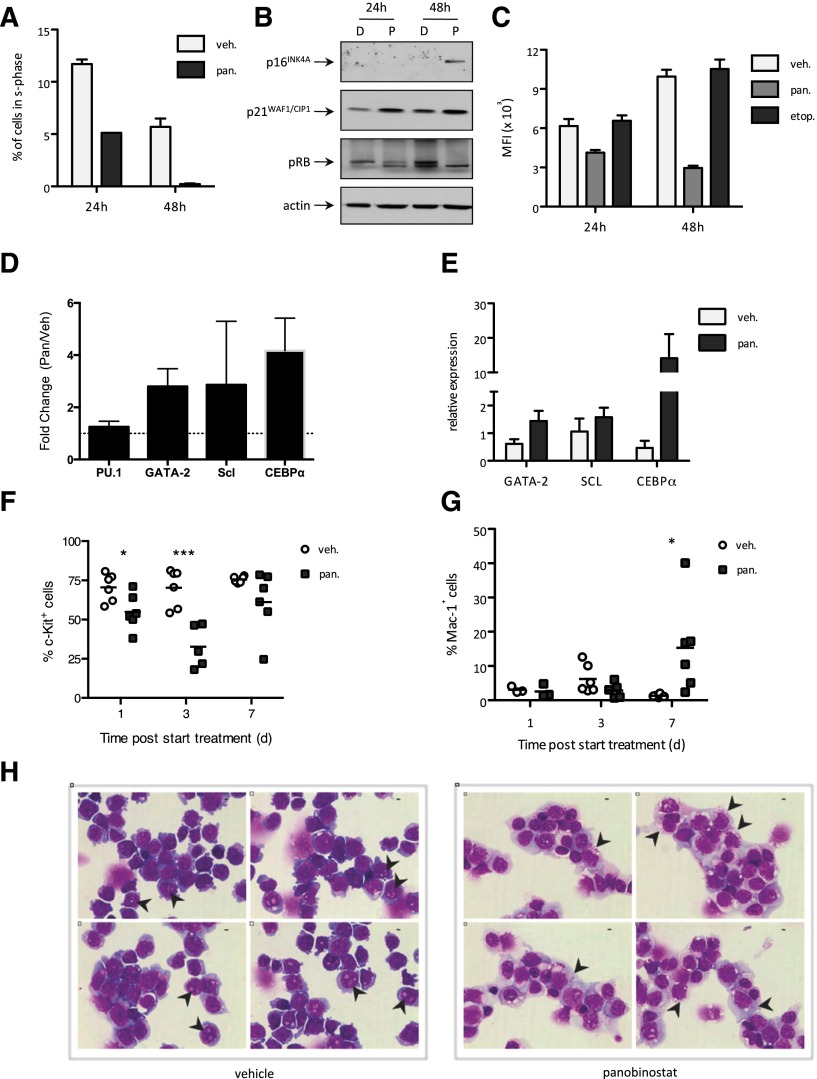
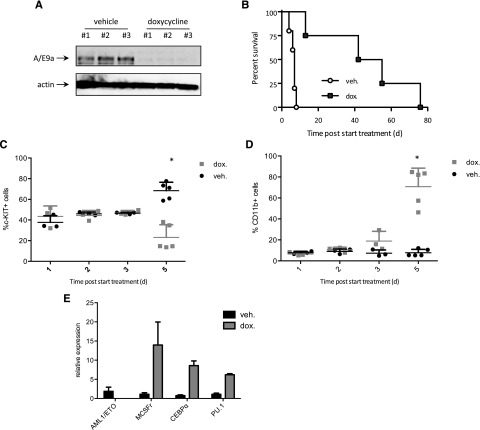
Epigenetic modifying enzymes such as histone deacetylases (HDACs), p300, and PRMT1 are recruited by AML1/ETO, the pathogenic protein for t(8;21) acute myeloid leukemia (AML), providing a strong molecular rationale for targeting these enzymes to treat this disease. Although early phase clinical assessment indicated that treatment with HDAC inhibitors (HDACis) may be effective in t(8;21) AML patients, rigorous preclinical studies to identify the molecular and biological events that may determine therapeutic responses have not been performed. Using an AML mouse model driven by expression of AML1/ETO9a (A/E9a), we demonstrated that treatment of mice bearing t(8;21) AML with the HDACi panobinostat caused a robust antileukemic response that did not require functional p53 nor activation of conventional apoptotic pathways. Panobinostat triggered terminal myeloid differentiation via proteasomal degradation of A/E9a. Importantly, conditional A/E9a deletion phenocopied the effects of panobinostat and other HDACis, indicating that destabilization of A/E9a is critical for the antileukemic activity of these agents.


Figures

Figure 1
Figure 1
The HDACi panobinostat demonstrates therapeutic efficacy in a mouse model of A/E9a;NrasG12D-driven but not M/E;NrasG12D-driven AML. (A) Western blot analysis of whole-cell lysates prepared from cell lines K562 and Kasumi-1 and spleen cells (spl) isolated from a WT and an A/E9a;NrasG12D leukemia recipient mouse using an antibody to AML1 (upper panel). Membrane was stripped and reprobed for glyceraldehyde-3-phosphate dehydrogenase (GAPDH) as loading control (bottom panel). (B) Flow cytometry analysis of c-Kit and Mac-1 expression in GFP-positive spleen cells isolated from an A/E9a;NrasG12D leukemia recipient mouse. A representative flow cytometry plot is shown. (C) Immunoprecipitation/western blot analysis of the interaction between A/E9a and HDAC1 in A/E9a;NrasG12D leukemic cells treated with DMSO (D) or 16 nM panobinostat (P) for 6 hours. A control mouse immunoglobulin G (IgG) and antibody to AML1 (AML) were used for immunoprecipitation; antibodies to HDAC1 and AML1 were used for western blotting. The results shown are representative of 3 independent experiments. (D-F) Total white blood cells (WBC), flow cytometry analysis of leukemic cells in peripheral blood, and BLI of C57BL/6 mice bearing A/E9a;NrasG12D tumors treated with panobinostat or vehicle using the standard treatment regimen. In panels D and E, each data point represents an individual mouse, and horizontal bars represent mean value. ***P < .0001. (G) Kaplan-Meier survival curves of treated A/E9a;NrasG12D leukemia recipient mice following initiation of therapy (n = 6 for vehicle, n = 5 for panobinostat; median survival benefit 84 days, P = .0006). Dotted line indicates final day of treatment. (H) BLI of M/E;NrasG12D leukemia recipient mice treated with panobinostat or vehicle using the standard treatment regimen. (I) Kaplan-Meier survival curves of treated M/E;NrasG12D leukemia recipient mice following initiation of therapy (n = 6 for vehicle, n = 6 for panobinostat; median survival benefit 6 days, P = .0015).
Figure 2
Figure 2
Response to panobinostat is independent of a functional p53 pathway. (A-B) Flow cytometry analysis of leukemic cells in peripheral blood and BLI of A/E9a;NrasG12D/p53−/− leukemia recipient mice treated with panobinostat or vehicle using the standard treatment regimen. In panel A, each data point represents an individual mouse, and horizontal bars represent mean value. ***P < .0001. (C) Kaplan-Meier survival curves of treated A/E9a;NrasG12D/p53−/− leukemia recipient mice following initiation of therapy (n = 10 for vehicle, n = 8 for panobinostat; median survival benefit 21 days, P < .0001). Dotted line indicates final day of treatment.
Figure 3
Figure 3
Extrinsic apoptotic pathway is dispensable for therapeutic response of panobinostat. (A) Quantitative real-time PCR of Dr5 messenger RNA (mRNA) levels in spleen cells (>80% GFP-positive cells) isolated from A/E9a;NrasG12D leukemia recipient mice treated with panobinostat (25 mg/kg) or vehicle (D5W) for 4 hours. Mean value of 2 individual samples is shown. (B-C) Flow cytometry analysis of leukemic cells in peripheral blood and BLI of A/E9a;NrasG12D/DR5−/− leukemia recipient mice treated with panobinostat or vehicle using the standard therapy regimen. In panel B, each data point represents an individual mouse, and horizontal bars represent mean value. ***P < .0001. (D) Kaplan-Meier survival curves of treated A/E9a;NrasG12D/DR5−/− leukemia recipient mice following initiation of therapy (n = 10 for vehicle, n = 10 for panobinostat; median survival benefit 45 days, P < .0001). Dotted line represents final day of treatment.
Figure 4
Figure 4
Intrinsic apoptotic pathway is dispensable for therapeutic response to panobinostat. (A-B) Flow cytometry analysis of leukemic cells in peripheral blood and BLI of A/E9a;NrasG12D/Bcl-2 leukemia recipient mice treated with panobinostat or vehicle using the standard therapy regimen. In panel A, each data point represents an individual mouse, and horizontal bars represent mean value. ***P < .0001. (C) Kaplan-Meier survival curves of treated A/E9a;NrasG12D/Bcl-2 leukemia recipient mice following initiation of therapy (n = 12 for vehicle, n = 8 for panobinostat; median survival benefit 63 days, P < .0001). Dotted line represents final day of treatment. (D) Analysis of apoptotic cells via TUNEL staining. Staining was performed on bone marrow isolated from A/E9a;NrasG12D leukemia recipient mice treated with panobinostat (25 mg/kg) or cytarabine (100 mg/kg) for the indicated time. Sections are representative of 3 (panobinostat) or 2 (cytarabine) mice per time point. Dark brown cells indicate TUNEL-positive cells. (E) Flow cytometry analysis of GFP-positive leukemic cells in indicated tissue isolated from A/E9a;NrasG12D leukemia recipient mice treated with panobinostat (25 mg/kg) or vehicle (D5W, 250 µL) for 3 days. Data are combined from 2 individual experiments. Each data point represents an individual mouse, and horizontal bars represent mean value. **P = .004 (blood); **P = .0022 and P = .0012, respectively (spleen); ***P < .0001 (bone marrow).
Figure 5
Figure 5
Panobinostat treatment of A/E9a;NrasG12D leukemic cells triggers differentiation. (A) Cell cycle analysis of A/E9a;NrasG12D leukemic cells treated in vitro with vehicle or 16 nM panobinostat for the indicated time. Percentage of cells in S phase (EdU positive) was determined by flow cytometry. Mean values of 2 independent experiments are shown; error bars represent standard deviation (SD). (B) Western blot analysis of whole-cell lysates prepared from A/E9a;NrasG12D leukemic cells treated in vitro with vehicle (D) or 16 nM panobinostat (P) for the indicated time using antibodies to p16INK4A, p21WAF1/CIP1, and phosphorylated RB. β-actin served as loading control. The results shown are representative of 3 independent experiments. (C) Flow cytometry analysis of c-Kit expression in A/E9a;NrasG12D leukemic cells treated in vitro with 16 nM panobinostat for the indicated time. Mean values of 3 independent experiments are shown; error bars represent SD. (D) Quantitative real-time PCR of relative mRNA levels of target genes in A/E9a;NrasG12D leukemic cells treated in vitro with 16 nM panobinostat for 24 hours. Results were normalized to HPRT mRNA. Mean value of 3 to 6 individual experiments is shown, and error bars represent SD. (E) Quantitative real-time PCR of relative mRNA levels of target genes in GFP-positive splenocytes isolated from A/E9a;NrasG12D leukemia recipient mice 72 hours after initiation of treatment with panobinostat (25 mg/kg) or vehicle (D5W). Results were normalized to HPRT mRNA. Mean value of 3 to 5 individual samples is shown, and error bars represent standard error of the mean. (F-G) Flow cytometry analysis of c-Kit (F) and Mac-1 (G) expression in GFP-positive bone marrow cells isolated from A/E9a;NrasG12D leukemia recipient mice treated with panobinostat (25 mg/kg) or vehicle (D5W) for 3 days. Data are combined from 2 individual experiments. Each data point represents an individual mouse, and horizontal bars represent mean value. (F) *P = .0248; ***P = .0009. (G) *P = .0292. (H) Light microscopy of May-Grunwald/Giemsa–stained bone marrow cells isolated from A/E9a;NrasG12D leukemia recipient mice cells treated with panobinostat (25 mg/kg) or vehicle (D5W, 250 µL) for 5 days. Imaging was performed with a ×60 objective. Representative images of 5 biological replicates are shown (bars represent 10 µm). GFP-positive cells isolated from 5-day vehicle-treated mice (left panel) demonstrate immature blast morphology, including a fine rim of agranular basophilic cytoplasm with a round to oval nucleus containing “open chromatin” and 1 or more prominent nucleoli (arrowheads). In contrast, GFP-positive cells from 5-day panobinostat-treated mice (right panel) show features of maturation including a reduction in the nuclear:cytoplasmic ratio, condensation of nuclear chromatin, and infrequent nucleolation. Frequent coarse azurophilic cytoplasmic granules (arrowheads) indicate myeloid differentiation.
Figure 6
Figure 6
Panobinostat induces degradation of A/E9a and A/E. (A) Western blot analysis of whole-cell lysates prepared from A/E9a;NrasG12D leukemic cells treated in vitro with DMSO vehicle (D) or 16 nM panobinostat (P) for the indicated time using antibodies to AML1, GFP, and acetylated histone H3. β-actin served as loading control. The results shown are representative of at least 3 independent experiments. (B) Western blot analysis of whole-cell lysates prepared from Kasumi cells treated in vitro with DMSO vehicle (D) or 8 nM panobinostat (P) for the indicated time using antibodies to AML1 and acetylated histone H3. Total histone H3 and β-actin served as loading controls. The results shown are representative of at least 3 independent experiments. (C) Western blot analysis of whole-cell lysates prepared from primary t(8;21) AML cells treated in vitro with DMSO (D) or indicated concentrations (nM) of panobinostat (P) for 6 hours using an antibody to AML1 (upper panel). Membrane was stripped and reprobed for p42 as loading control (bottom panel). (D) Western blot analysis of whole-cell lysates prepared from a different primary t(8;21) AML sample as that shown in panel C treated in vitro with DMSO (D) or 8 nM panobinostat (P) for the indicated time using an antibody to AML1 (upper panel). Membrane was stripped and reprobed for anti–acetyl-tubulin antibody (bottom panel). (E) Western blot analysis of whole-cell lysates prepared from A/E9a;NrasG12D leukemic cells treated in vitro with DMSO vehicle (D) or 16 nM panobinostat (P) for 24 hours with addition of 5 µM MG132 for the final 4 hours (lanes 1 and 2) using antibodies to AML1, acetylated histone H3, ubiquitin, and GFP. The results shown are representative of at least 3 independent experiments. (F) Western blot analysis of whole-cell lysates prepared from A/E9a;NrasG12D leukemic cells treated in vitro with vehicle (D), 16 nM panobinostat (P), or 100 nM of the Hsp90 inhibitor 17-AAG for 24 hours using antibodies to AML1. β-actin served as loading control. The results shown are representative of at least 3 independent experiments. (G) Western blot analysis of the interaction between A/E9a and Hsp90 in A/E9a;NrasG12D leukemic cells treated with vehicle (D) or 16 nM panobinostat (P) for 4 hours. A control mouse immunoglobulin G (IgG) and antibody to Hsp90 were used for immunoprecipitation; antibodies to AML1 and Hsp90 were used for western blotting. The results shown are representative of at least 3 independent experiments.
Figure 7
Figure 7
Inducible deletion of A/E9a phenocopies the effect of panobinostat. (A) Western blot analysis of whole-cell lysates prepared from GFP-positive spleen cells isolated from Tet-off A/E9a;NrasG12D leukemia recipient mice 72 hours after initiation of treatment with doxycycline or vehicle using an antibody to AML1. β-actin served as loading control. The results shown are representative of 2 independent experiments. (B) Kaplan-Meier survival curves of treated Tet-off A/E9a;NrasG12D leukemia recipient mice following initiation of therapy (n = 5 for vehicle, n = 4 for doxycycline; median survival benefit 42 days, P = .0051). (C-D) Flow cytometry analysis of c-Kit and CD11b expression in donor GFP-positive spleen cells isolated from Tet-off A/E9a;NrasG12D leukemia recipient mice at the indicated time after initiation of treatment with doxycycline (2 mg/kg) or vehicle. Each data point represents an individual mouse, and the mean value ± standard error from 2 separate experiments is shown. *P < .001. (E) Mice bearing Tet-off A/E9a;NrasG12D leukemias were treated with vehicle or doxycycline (dox) for 5 days. Tumors were harvested, and expression of the indicated genes was determined by quantitative real-time PCR. Results (mean and standard error of the mean) shown are from tumors harvested from 5 individual recipient mice for each treatment regimen.

References

    1. Kouzarides T. Chromatin modifications and their function. Cell. 2007;128(4):693–705. - PubMed
    1. Arrowsmith CH, Bountra C, Fish PV, Lee K, Schapira M. Epigenetic protein families: a new frontier for drug discovery. Nat Rev Drug Discov. 2012;11(5):384–400. - PubMed
    1. Lee KK, Workman JL. Histone acetyltransferase complexes: one size doesn’t fit all. Nat Rev Mol Cell Biol. 2007;8(4):284–295. - PubMed
    1. Yang X-J, Seto E. The Rpd3/Hda1 family of lysine deacetylases: from bacteria and yeast to mice and men. Nat Rev Mol Cell Biol. 2008;9(3):206–218. - PMC - PubMed
    1. Yang X-J, Seto E. Lysine acetylation: codified crosstalk with other posttranslational modifications. Mol Cell. 2008;31(4):449–461. - PMC - PubMed

Publication types

MeSH terms