Meta-Analysis
. 2014 Apr;58(8):1130-9.
doi: 10.1093/cid/cit937. Epub 2014 Jan 10.

Long-term immune responses to vaccination in HIV-infected patients: a systematic review and meta-analysis

Affiliations
Free PMC article
Meta-Analysis

Long-term immune responses to vaccination in HIV-infected patients: a systematic review and meta-analysis

Solen Kernéis et al. Clin Infect Dis. 2014 Apr.
Free PMC article

Abstract

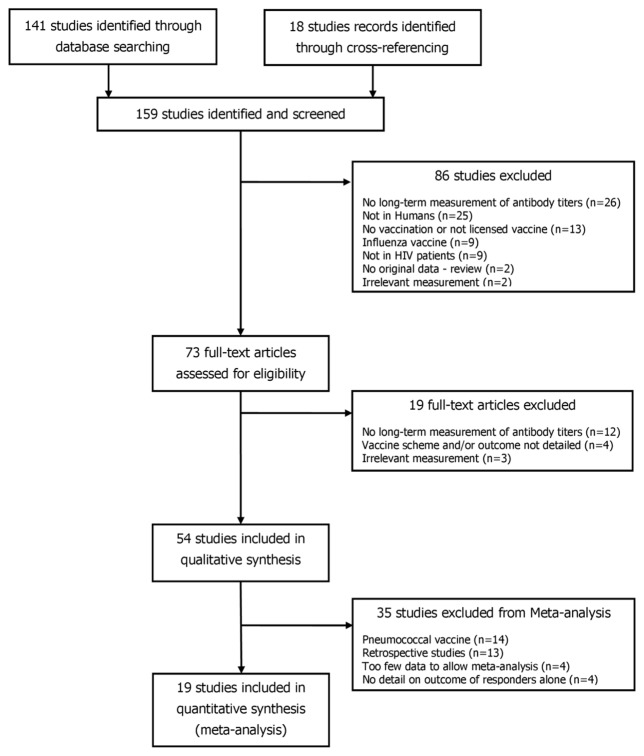
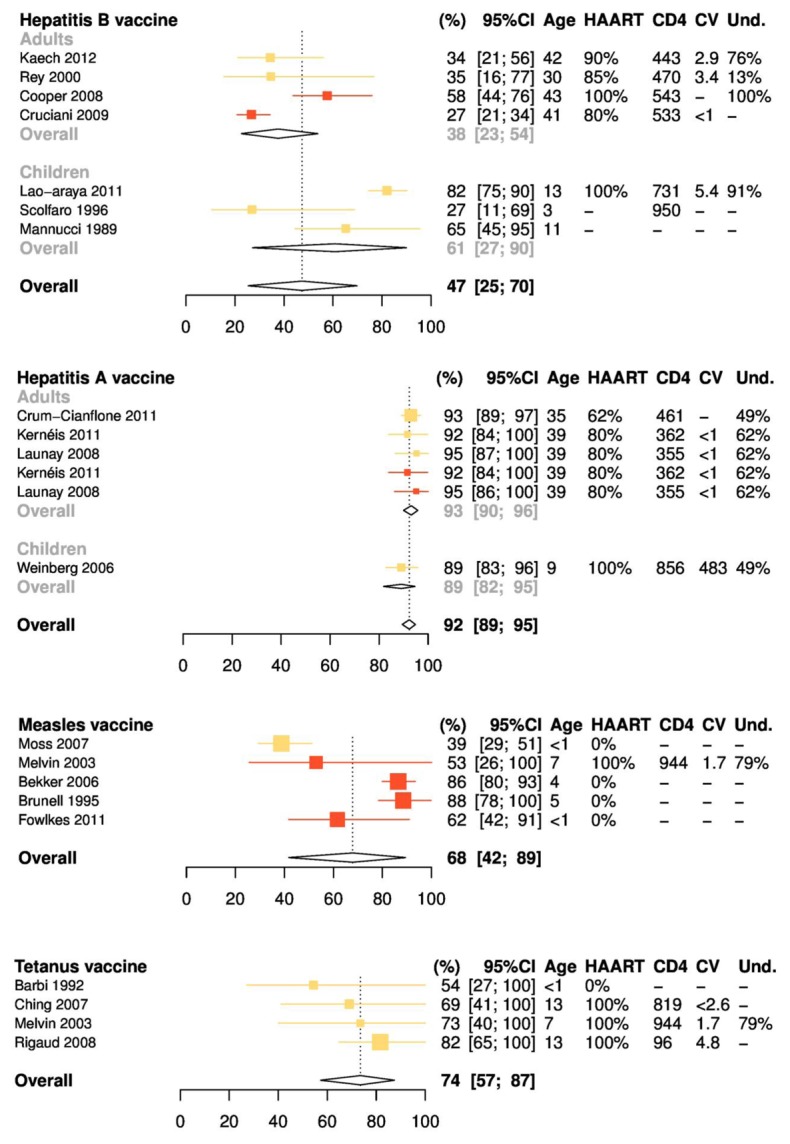
Vaccine-induced antibodies may wane more quickly in persons living with human immunodeficiency virus (HIV) than in healthy individuals. We reviewed the literature on vaccines routinely recommended in HIV-infected patients to estimate how seroprotection decreases over time in those who initially responded to immunization. For each study retrieved from the literature, the decrease of seroprotection was modeled with a log binomial generalized linear model, and data were pooled in a meta-analysis to provide estimates of seroprotection 2 and 5 years after the last vaccine administration. Our analyses confirmed that the duration of seroprotection was shorter in HIV-infected patients and that with current guidelines, a substantial proportion of patients would have lost protective antibodies before a booster was proposed. We therefore discuss the implications for the monitoring of antibody levels and timing of revaccination in these patients.

Keywords: HIV; meta-analysis; vaccination.


Conflict of interest statement

Conflicts of interest

SK, CT, FB, and PYB declare no conflicts of interest.

OL, TH reported not having shares or paid employment with pharmaceutical companies, being investigators on studies sponsored by different pharmaceutical companies.

Figures

Figure 1
Figure 1
PRISMA flow diagram of the search strategy.
Figure 2
Figure 2. Data retrieved from the literature (2A–E) and graphical illustration of the statistical modeling for hepatitis B (2F)
Each symbol represents a percentage of individuals with protective antibody concentrations in relation with time (in years) elapsed since immunization, among those who initially responded to the vaccine, except for tetanus, where overall percentages of seroprotection are presented (responders and non-responders pooled together). The size of points is proportional to the sample sizes of studies. Symbols are colour-coded according to the vaccination scheme. Figure 2F shows the principle of modeling for hepatitis B vaccine: symbols represent the percentages of seroprotection retrieved from the literature and lines show extrapolations of the model at two and five years. Estimates of seroprotection (black symbols) are provided by the model at two and five years.
Figure 3
Figure 3
Meta-analysis of the percentages of seroprotection 2 years after the last vaccine dose, by vaccine antigen. Columns on right detail characteristics of study participants at the time of immunization, including mean or median age, percentage receiving highly active antiretroviral therapy (HAART), mean or median CD4 cell count (per microliter), mean or median human immunodeficiency virus (HIV) load (log copies per milliliter), and percentage with undetectable HIV loads. Colors represent vaccination protocols. For hepatitis B, yellow symbols represent 3 intramuscular 10-μg doses (Lao-Araya et al [13] and Scolfaro et al [18]) or 3 subcutaneous 5-μg doses (Mannucci et al [14]) in children or 3 intramuscular 20-μg doses in adults (Kaech et al [12] and Rey et al [17]). Red symbols represent 3 intramuscular 40-μg doses (Cooper et al [10] and Cruciani et al [8]). Heterogeneity: Q = 121.9; P < .001; I2 = 95% [92%–97%]. For hepatitis A, yellow symbols represent 1 dose (Weinberg et al [24], Crum-Cianflone et al [21], Kernéis et al [22], and Launay et al [23]); red symbols, 2 doses (Kernéis et al [22] and Launay et al [23]). Heterogeneity: Q = 2.9; P = .71; I2 = 0% [0%–57%]. For measles, yellow symbols represent 1 dose (Moss et al [31]); red symbols, 2 doses (Melvin and Mohan [30], Bekker et al [26], Brunell et al [27], and Fowlkes et al [29]). Heterogeneity: Q = 25.6; P < .001; I2 = 84% [65%–93%]. For tetanus, yellow symbols represent 2–5 doses plus boosters, according to local practices. Heterogeneity: Q = 2.5; P = .48; I2 = 0% [0%–81.3%].
Figure 4
Figure 4
Meta-analysis of the percentages of seroprotection 5 years after the last vaccine dose, by vaccine antigen. Columns on right detail characteristics of study participants at the time of immunization, including mean or median age, percentage receiving highly active antiretroviral therapy (HAART), mean or median CD4 cell count (per microliter), mean or median human immunodeficiency virus (HIV) load (log copies per milliliter), and percentage with undetectable HIV loads. Colors represent vaccination protocols. For hepatitis B, yellow symbols represent 3 intramuscular 10-μg doses (Lao-Araya et al [13] and Scolfaro et al [18]) or 3 subcutaneous 5-μg doses (Mannucci et al [14]) in children or 3 intramuscular 20-μg doses in adults (Kaech et al [12] and Rey et al [17]). Red symbols represent 3 intramuscular 40-μg doses (Cooper et al [10] and Cruciani et al [8]). Heterogeneity: Q = 87.7; P < .001; I2 = 93% [88%–96%]. For hepatitis A, yellow symbols represent 1 dose (Weinberg et al [24], Crum-Cianflone et al [21], Kernéis et al [22], and Launay et al [23]); red symbols, 2 doses (Kernéis et al [22] and Launay et al [23]). Heterogeneity : Q = 6.7; P = .25; I2 = 25% [0%–69%]. For measles, yellow symbols represent 1 dose (Moss et al [31]); red symbols, 2 doses (Melvin and Mohan [30], Bekker et al [26], Brunell et al [27], and Fowlkes et al [29]). Heterogeneity: Q = 47.8; P < .001; I2 = 92% [84%–96%]. For tetanus, yellow symbols represent 2–5 doses plus boosters, according to local practices. Heterogeneity : Q = 4.5; P = .22; I2 = 33% [0%–76%].

References

    1. Geretti AM, Doyle T. Immunization for HIV-positive individuals. Curr Opin Infect Dis. 2010;23:32–38. - PubMed
    1. Abzug MJ. Vaccination in the immunocompromised child: a probe of immune reconstitution. Pediatr Infect Dis J. 2009;28:233–236. - PubMed
    1. Siber GR, Chang I, Baker S, et al. Estimating the protective concentration of anti-pneumococcal capsular polysaccharide antibodies. Vaccine. 2007;25:3816–3826. - PubMed
    1. Abzug MJ, Song L-Y, Fenton T, et al. Pertussis booster vaccination in HIV-infected children receiving highly active antiretroviral therapy. Pediatrics. 2007;120:e1190–1202. - PubMed
    1. Gibb D, Giacomelli A, Masters J, et al. Persistence of antibody responses to Haemophilus influenzae type b polysaccharide conjugate vaccine in children with vertically acquired human immunodeficiency virus infection. Pediatr Infect Dis J. 1996;15:1097–1101. - PubMed

Publication types