

The free energy landscape of dimerization of a membrane protein, NanC
- PMID: 24415929
- PMCID: PMC3886892
- DOI: 10.1371/journal.pcbi.1003417
The free energy landscape of dimerization of a membrane protein, NanC
Abstract
Membrane proteins are frequently present in crowded environments, which favour lateral association and, on occasions, two-dimensional crystallization. To better understand the non-specific lateral association of a membrane protein we have characterized the free energy landscape for the dimerization of a bacterial outer membrane protein, NanC, in a phospholipid bilayer membrane. NanC is a member of the KdgM-family of bacterial outer membrane proteins and is responsible for sialic acid transport in E. coli. Umbrella sampling and coarse-grained molecular dynamics were employed to calculate the potentials of mean force (PMF) for a variety of restrained relative orientations of two NanC proteins as the separation of their centres of mass was varied. We found the free energy of dimerization for NanC to be in the range of -66 kJ mol(-1) to -45 kJ mol(-1). Differences in the depths of the PMFs for the various orientations are related to the shape of the proteins. This was quantified by calculating the lipid-inaccessible buried surface area of the proteins in the region around the minimum of each PMF. The depth of the potential well of the PMF was shown to depend approximately linearly on the buried surface area. We were able to resolve local minima in the restrained PMFs that would not be revealed using conventional umbrella sampling. In particular, these features reflected the local organization of the intervening lipids between the two interacting proteins. Through a comparison with the distribution of lipids around a single freely-diffusing NanC, we were able to predict the location of these restrained local minima for the orientational configuration in which they were most pronounced. Our ability to make this prediction highlights the important role that lipid organization plays in the association of two NanCs in a bilayer.
Conflict of interest statement
The authors have declared that no competing interests exist.
Figures
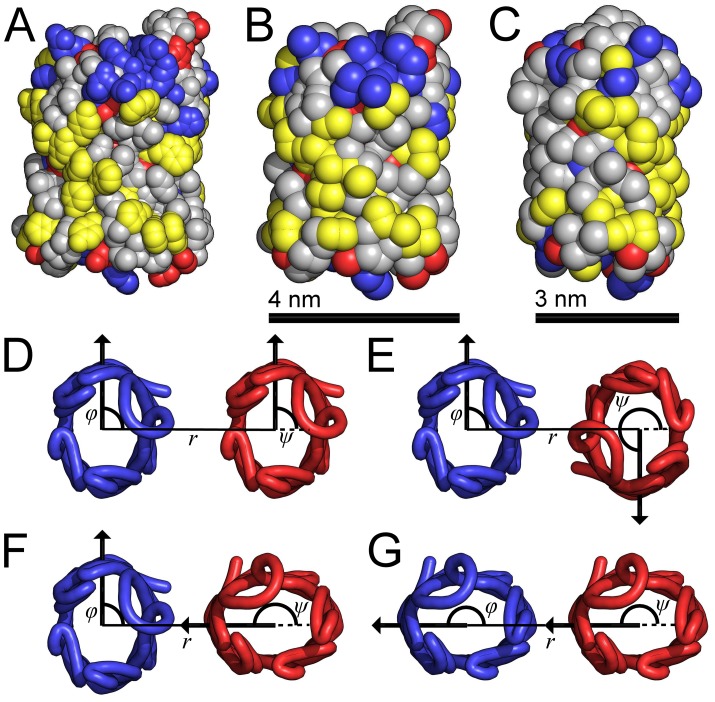
 rotation about the pore axis and with B being the equivalent orientation to A. The atoms/particles are represented by spheres with radii equal to their van der Waals radii. The atoms/particles from acidic residues shown in red, from basic residues in blue, from aromatic residues in yellow and from neutral residues in grey. (D–G) Four combinations of protein orientations as viewed from the extracellular side of the membrane. The
  traces of the NanC proteins illustrate their elliptical cross-sections. For each protein, the angle of orientation is measured between the line, which goes from the centre of mass of the blue protein through the centre of mass of the red protein, and the arrow, which goes from the protein's centre of mass through the
  of its isoleucine at residue 209. The orientational angle for each protein trace coloured blue is labelled
  and for each protein coloured red is labelled
  . The separation between the proteins' centres of mass is given by
  .
.
 ;
;  ;
;  ; and
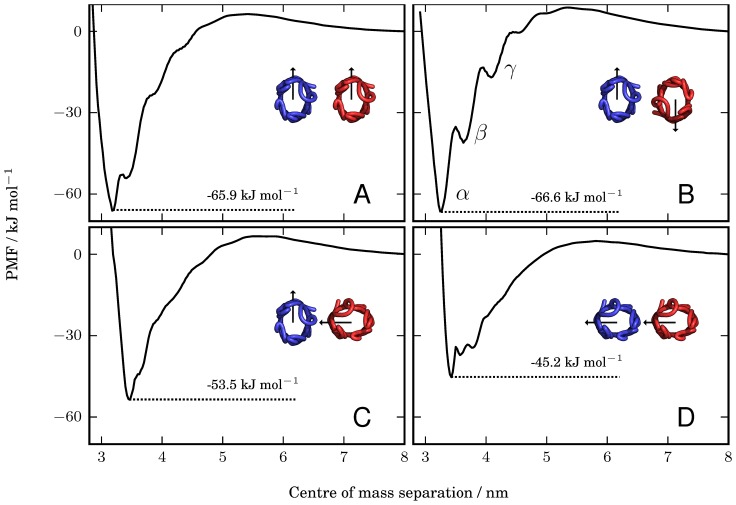
; and  (in A, B, C, and D, respectively). The PMFs have depths of
  (A);
(A);  (B);
(B);  (C); and
  (D). In B, the minimum, labelled
  , and the two local minima, labelled
  and
and  , correspond to inter-protein separations at which different numbers of lipids can optimally occupy the intervening region between the two proteins, as explained in the main text and illustrated in Figure 3.
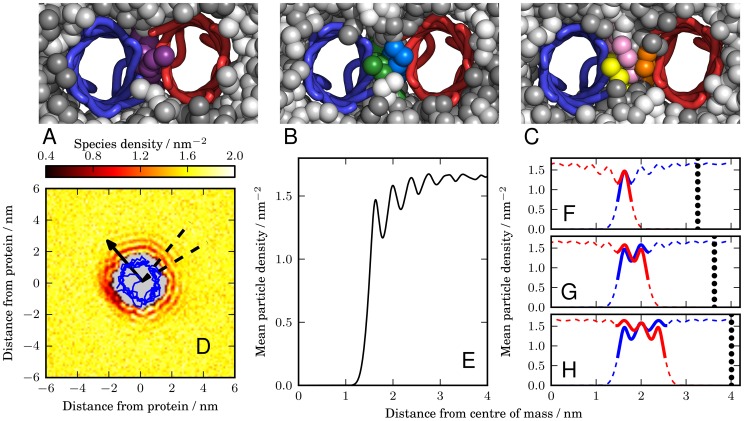
 at inter-protein separations of 3.3 nm, 3.6 nm, and 4.1 nm, respectively. These snapshots correspond to the local minima in Figure 2B, which are labelled
  ,
,  and
and  . The membrane is viewed from the periplasmic face, with the water and ions removed. The proteins are represented by traces through the
  particles of each residue, with one protein coloured blue and the other red. The lipid molecules are represented by spheres and are coloured by the lipid molecule, so that individual lipids can be identified. We see in the snapshot of state
  (A) that there is only one lipid between the two proteins, which is coloured purple. In the snapshot of state
  (B) there is room for two lipid molecules, coloured green and blue, to fit between the two proteins. In the snapshot of state
  (C) there is room for three lipids to fit between the two proteins, coloured in yellow, pink and orange. (D) Species density plot for the third coarse-grained particle in one of the tails for the lipids in the upper leaflet. The density is measured relative to the position of a freely diffusing NanC protein. The blue line is a projection of the
  particles onto the plane of the membrane. The arrow is the same arrow used throughout the text to show the protein's orientation and is drawn from the centre of mass through the
  of the isoleucine at residue 209. The dashed lines mark the angular region over which the mean lipid density (E) is measured and corresponds to the direction of the other protein in the orientational configuration
  . The mean is taken over both leaflets and all coarse-grained lipid particles. (F–H) The distribution is overlaid with a reversed version and aligned such that either one (F), two (G), or three (H) peaks occur in the region between the two proteins. The dashed line sections correspond to regions that are occupied by the proteins. The thick lines represent the overlaid lipid distributions around both proteins that correspond to the prediction of the lipid packed region between the two proteins. The vertical dotted lines indicate the edge of the reversed density plot. These edges correspond to the predicted position of the second protein and are located at 3.24 nm (F), 3.63 nm (G), and 4.02 nm (H).
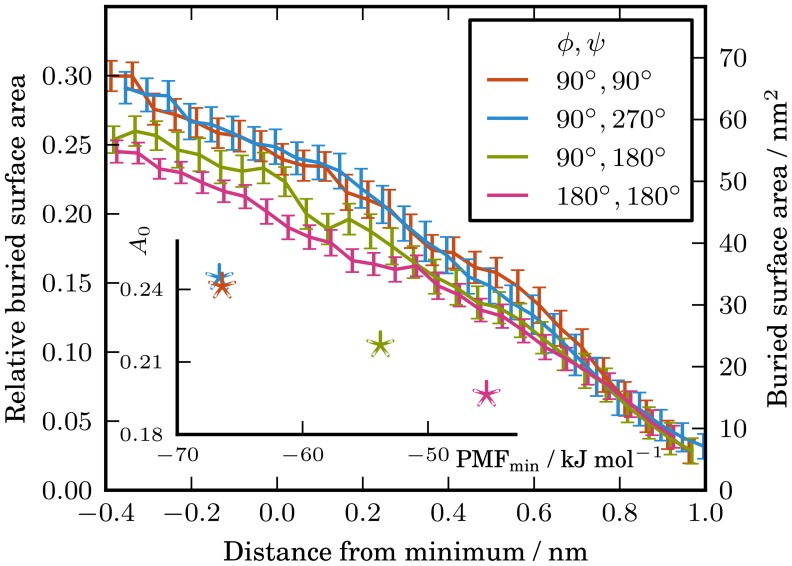
 . The inset figure shows the relative buried surface areas at the minimum of the respective PMFs as a function of the restrained global minimum PMF depth. The buried surface areas at the minimum of the PMFs were obtained from a straight line fit of the region
  from the minimum of the PMF.
References
-
- Nilsson J, Persson B, von Heijne G (2005) Comparative analysis of amino acid distributions in integral membrane proteins from 107 genomes. Proteins 60: 606–616. - PubMed
-
- Koebnik R, Locher KP, van Gelder P (2000) Structure and function of bacterial outer membrane proteins: barrels in a nutshell. Molecular Microbiology 37: 239–253. - PubMed
-
- Nikaido H (2001) Preventing drug access to targets: cell surface permeability barriers and active efflux in bacteria. Seminars in Cell & Developmental Biology 12: 215–223. - PubMed
-
- Le Brun AP, Holt SA, Shah DSH, Majkrzak CF, Lakey JH (2011) The structural orientation of antibody layers bound to engineered biosensor surfaces. Biomaterials 32: 3303–3311. - PubMed
Publication types
MeSH terms
Substances
Grants and funding
- BB/L002558/1/BB_/Biotechnology and Biological Sciences Research Council/United Kingdom
- BBS/B/16011/BB_/Biotechnology and Biological Sciences Research Council/United Kingdom
- BEP17032/BB_/Biotechnology and Biological Sciences Research Council/United Kingdom
- B19456/BB_/Biotechnology and Biological Sciences Research Council/United Kingdom
- WT_/Wellcome Trust/United Kingdom
LinkOut - more resources
Full Text Sources
Other Literature Sources
