. 2014 Jan;10(1):e1003872.
doi: 10.1371/journal.ppat.1003872. Epub 2014 Jan 9.

Targeted cytotoxic therapy kills persisting HIV infected cells during ART

Affiliations

Targeted cytotoxic therapy kills persisting HIV infected cells during ART

Paul W Denton et al. PLoS Pathog. 2014 Jan.

Abstract

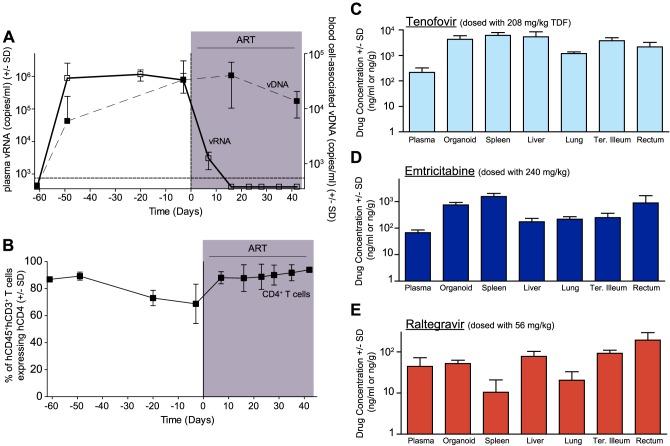
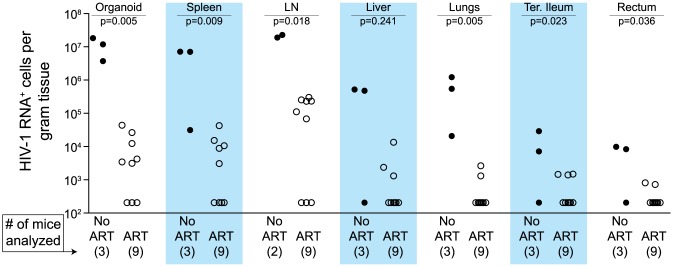
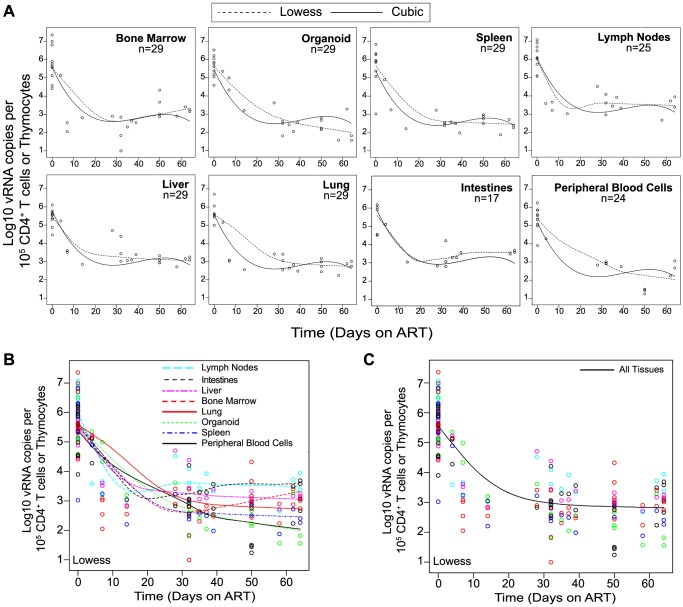
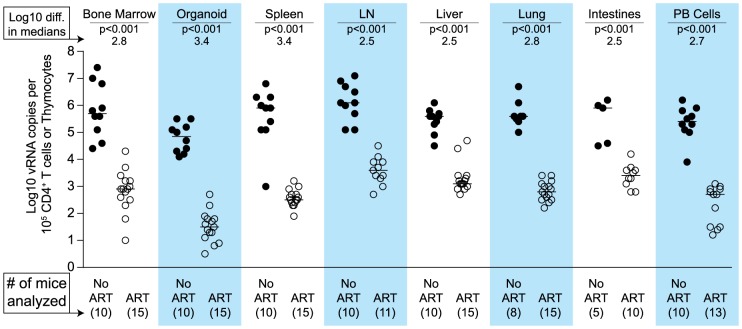
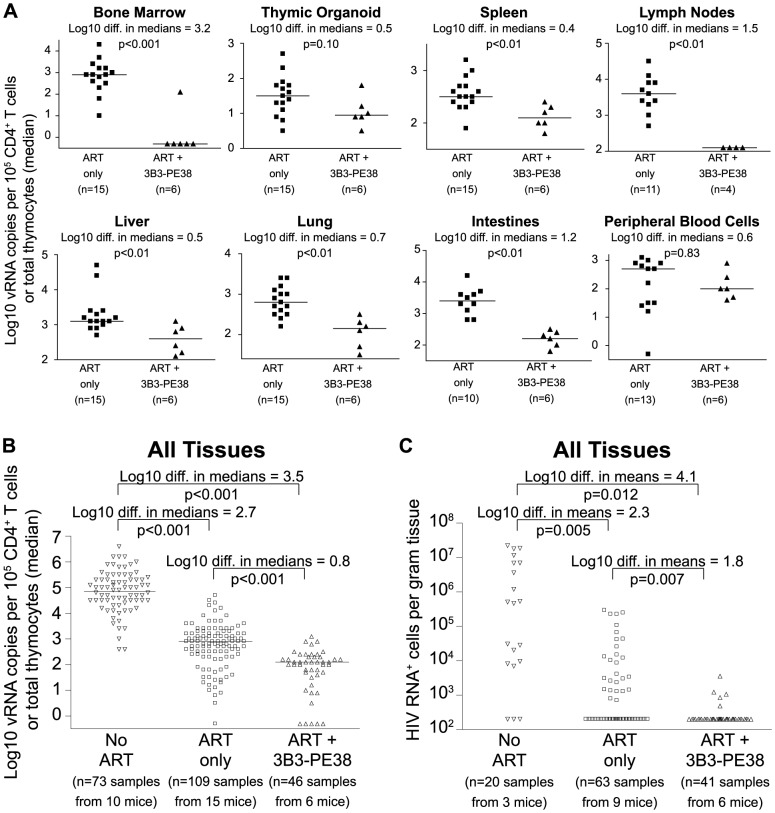
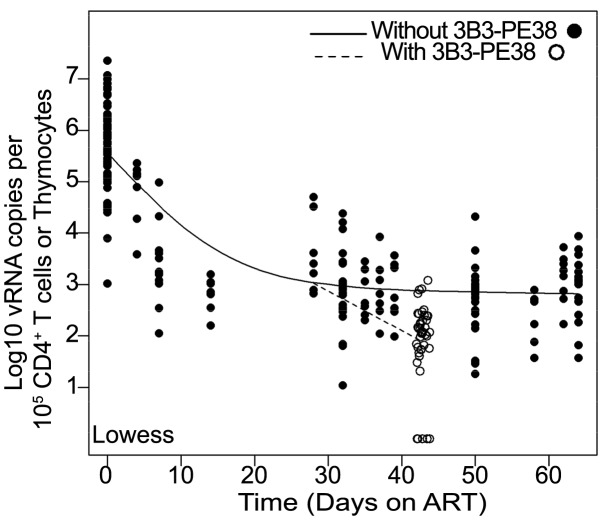
Antiretroviral therapy (ART) can reduce HIV levels in plasma to undetectable levels, but rather little is known about the effects of ART outside of the peripheral blood regarding persistent virus production in tissue reservoirs. Understanding the dynamics of ART-induced reductions in viral RNA (vRNA) levels throughout the body is important for the development of strategies to eradicate infectious HIV from patients. Essential to a successful eradication therapy is a component capable of killing persisting HIV infected cells during ART. Therefore, we determined the in vivo efficacy of a targeted cytotoxic therapy to kill infected cells that persist despite long-term ART. For this purpose, we first characterized the impact of ART on HIV RNA levels in multiple organs of bone marrow-liver-thymus (BLT) humanized mice and found that antiretroviral drug penetration and activity was sufficient to reduce, but not eliminate, HIV production in each tissue tested. For targeted cytotoxic killing of these persistent vRNA(+) cells, we treated BLT mice undergoing ART with an HIV-specific immunotoxin. We found that compared to ART alone, this agent profoundly depleted productively infected cells systemically. These results offer proof-of-concept that targeted cytotoxic therapies can be effective components of HIV eradication strategies.


Conflict of interest statement

Dr. Berger and Dr. Pastan report that they are co-inventors on several immunotoxin issued patents and patent applications. This does not alter our adherence to all PLOS policies on sharing data and materials. All other authors have declared that no competing interests exist.

Figures

Figure 1
Figure 1. Efficacious plasma and tissue drug concentrations indicate broad dissemination of antiretrovirals during ART.
(A) ART suppressed plasma viremia to below detection (vRNA; solid line, closed symbols) while peripheral blood cell-associated vDNA (dashed line; open symbols) were unaffected (Day −3 vs. Day42, p = 0.63, signed rank test). (B) ART led to a rebound in peripheral blood CD4+ T cells to pre-infection levels. (C–E) Drug concentrations [tenofovir (C), emtricitabine (D) or raltegravir (E)] were determined within the plasma and each of the indicated tissues. For this steady state drug concentration analysis, the 4 BLT mice in (A) were harvested 21 hours following their last ART dosing and the tissue concentrations of the antiretrovirals were determined.
Figure 2
Figure 2. Durable reduction of the number of vRNA+ cells occurs during ART.
Quantitative ISH analysis reveals statistically significant reductions in the numbers of productively infected cells for each tissue obtained from animals undergoing antiretroviral therapy. Exact log rank tests were utilized to generate p values. When no RNA+ cells were detected, then the number of RNA producing cells per gram tissue was set to 200 in the graph. (Closed symbols = no ART; open symbols = ART).
Figure 3
Figure 3. Viral RNA production during ART rapidly declines and then enters a plateau phase in all tissues.
(A) Each data point indicates cell-associated vRNA levels (y-axis) and the days following ART initiation (x-axis) for a given BLT mouse in the indicated tissues. Both Lowess (dashed line) and a cubic (solid line) regression models were fit to the data for each tissue. (B) To facilitate comparative analyses between tissues, all of the Lowess regressions are graphed together. (C) To determine the overall impact of ART on systemic cell-associated vRNA levels, data from all of the tissues was used to generate a single Lowess curve.
Figure 4
Figure 4. Each tissue analyzed exhibited a significant decline in vRNA during ART.
When cell-associated vRNA levels during the plateau stage (treated 28–64 days) are compared to those from untreated mice, the reduction in vRNA levels were significant in all tissues (p<0.001). Reductions in cell-associated vRNA levels are presented as log10 differences in medians. Mann-Whitney tests were used to generate p values. (Closed symbols = no ART; open symbols = ART).
Figure 5
Figure 5. 3B3-PE38 targets and systemically depletes vRNA+ cells in vivo.
Beginning on Day 28 after ART initiation 3B3-PE38 was added to the treatment regimen every other day (7 total doses: 4 at 1 µg/25 g followed by 3 at 5 µg/25 g). The ART only control includes mice treated for 28–64 days. (A) Reductions in cell-associated vRNA levels are presented as log10 differences in medians. Mann-Whitney tests were used to generate p values. (B) Reductions in cell-associated vRNA levels for all tissues in (A) are graphed alongside data from untreated mice (Wilcoxon rank-sum statistics with repeated measures corrections). (C) Quantitative ISH for No ART mice (Fig. 2), ART only mice (Fig. 2) and the ART+3B3-PE38 group revealed reductions in the total number of HIV RNA producing cells per gram. When no RNA+ cells were detected, then the number of RNA producing cells per gram tissue was set to 200 in the graph (Exact log rank tests with repeated measures corrections).
Figure 6
Figure 6. The 3B3-PE38 mediated killing of vRNA producing cells leads to a more rapid reduction in vRNA levels versus ART only.
The single Lowess curve for all data points in Fig. 3C (closed symbols; solid line) is graphed together with the combined tissue data for ART+3B3-PE38 (open symbols; dashed line) to reveal the alteration in cell-associated vRNA levels over time due to the immunotoxin. The beginning of the plateau phase of decay (Day 28) is the divergence point.

Similar articles

Cited by

References

    1. Nakagawa F, May M, Phillips A (2013) Life expectancy living with HIV: recent estimates and future implications. Curr Opin Infect Dis 26: 17–25. - PubMed
    1. Richman DD, Margolis DM, Delaney M, Greene WC, Hazuda D, et al. (2009) The challenge of finding a cure for HIV infection. Science 323: 1304–1307. - PubMed
    1. Deeks SG, Autran B, Berkhout B, Benkirane M, Cairns S, et al. (2012) Towards an HIV cure: a global scientific strategy. Nat Rev Immunol 12: 607–614. - PMC - PubMed
    1. Durand CM, Blankson JN, Siliciano RF (2012) Developing strategies for HIV-1 eradication. Trends Immunol 33: 554–562. - PMC - PubMed
    1. Deeks SG (2012) HIV: Shock and kill. Nature 487: 439–440. - PubMed

Publication types