. 2013 Dec 27:7:121.
doi: 10.3389/fnsys.2013.00121. eCollection 2013.

Left temporal alpha-band activity reflects single word intelligibility

Affiliations

Left temporal alpha-band activity reflects single word intelligibility

Robert Becker et al. Front Syst Neurosci. .

Abstract

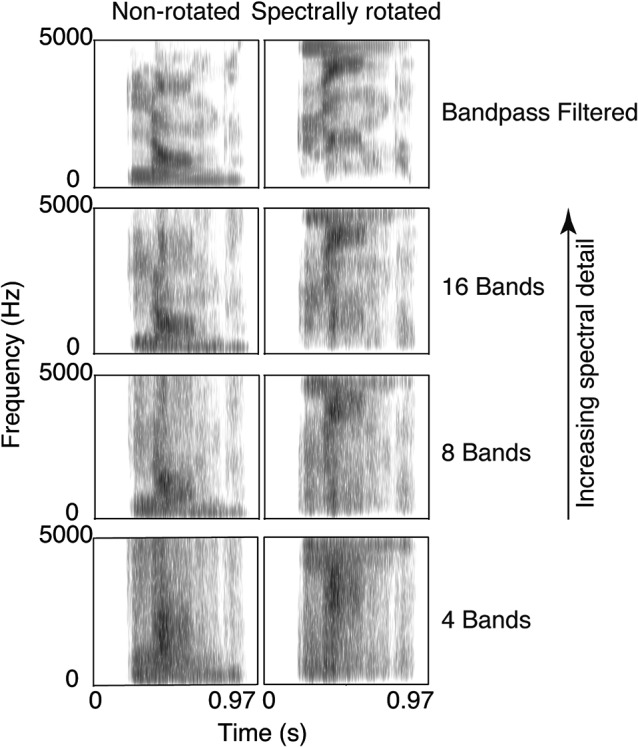
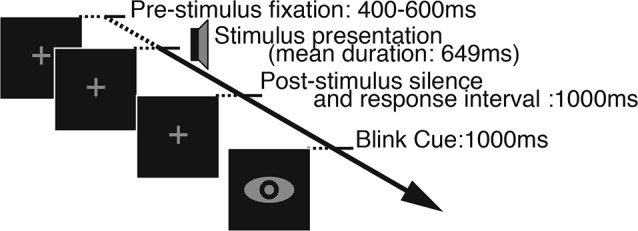
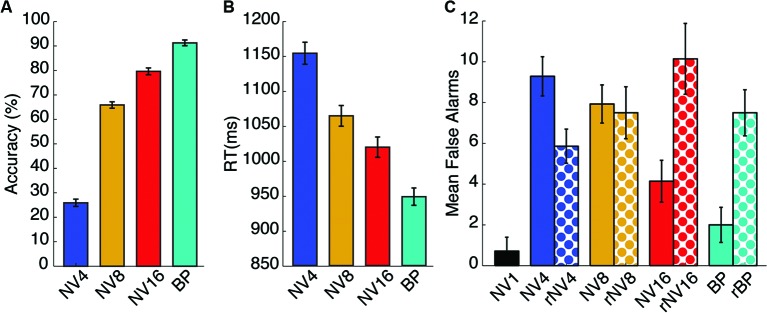
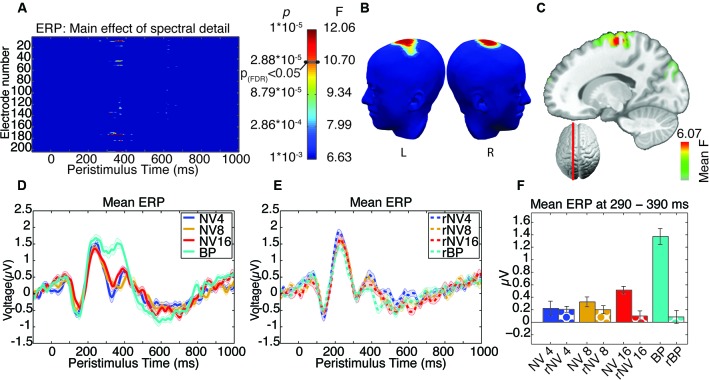
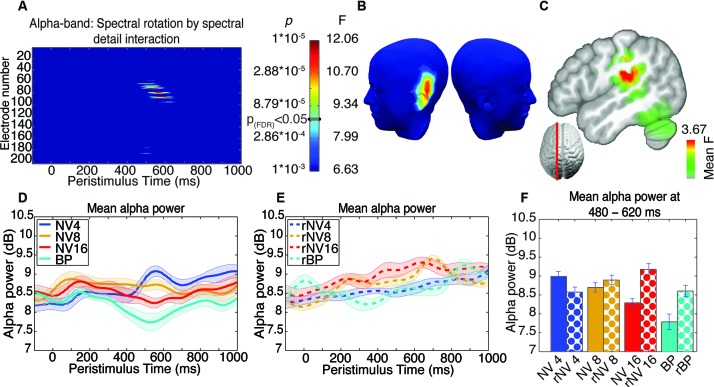
The electroencephalographic (EEG) correlates of degraded speech perception have been explored in a number of recent studies. However, such investigations have often been inconclusive as to whether observed differences in brain responses between conditions result from different acoustic properties of more or less intelligible stimuli or whether they relate to cognitive processes implicated in comprehending challenging stimuli. In this study we used noise vocoding to spectrally degrade monosyllabic words in order to manipulate their intelligibility. We used spectral rotation to generate incomprehensible control conditions matched in terms of spectral detail. We recorded EEG from 14 volunteers who listened to a series of noise vocoded (NV) and noise-vocoded spectrally-rotated (rNV) words, while they carried out a detection task. We specifically sought components of the EEG response that showed an interaction between spectral rotation and spectral degradation. This reflects those aspects of the brain electrical response that are related to the intelligibility of acoustically degraded monosyllabic words, while controlling for spectral detail. An interaction between spectral complexity and rotation was apparent in both evoked and induced activity. Analyses of event-related potentials showed an interaction effect for a P300-like component at several centro-parietal electrodes. Time-frequency analysis of the EEG signal in the alpha-band revealed a monotonic increase in event-related desynchronization (ERD) for the NV but not the rNV stimuli in the alpha band at a left temporo-central electrode cluster from 420-560 ms reflecting a direct relationship between the strength of alpha-band ERD and intelligibility. By matching NV words with their incomprehensible rNV homologues, we reveal the spatiotemporal pattern of evoked and induced processes involved in degraded speech perception, largely uncontaminated by purely acoustic effects.

Keywords: alpha oscillations; degraded speech; left inferior temporal cortex; noise-vocoding; speech intelligibility.


Figures

Figure 1
Figure 1
Spectrograms of the French word “langue” (meaning tongue, or language) for the four levels of spectral detail, for spectrally rotated and non-rotated stimuli. Stimuli illustrated with a preceding 200 ms silence.
Figure 2
Figure 2
Illustration of a single trial. In the beginning of each trial a fixation cross appeared on the screen for a variable duration of 400–600 ms and remained on the screen as the stimulus was presented. One second of silence was inserted after the stimulus offset, during which participants could make their response, and it was followed by the blink cue whose duration was also fixed at 1 s.
Figure 3
Figure 3
Behavioral results. Panel (A) shows the mean accuracy scores for the animal name detection task in each of the non-rotated potentially-comprehensible conditions. Panel (B) shows the mean response time for correct responses in the same conditions. Panel (C) displays the mean number of false alarms for all conditions. Error bars represent standard error of the mean corrected to be appropriate for repeated-measures comparisons, as described in Loftus and Masson (1994).
Figure 4
Figure 4
Results of ANOVA of evoked activity. (A) Electrode-by-time plot of the interaction of rotation × spectral detail thresholded at p < 0.001, revealing the time-window of interest between 305–390 ms. The color bar indicates the corresponding F- and p-values, the threshold for p(FDR) < 0.05 is indicated. (B) Shows the topography of this effect using the same color scale as in (A) at the peak of the effect (345 ms). (C) Illustrates the localization of this effect in inverse space, displaying the mean F-statistic averaged over the time-window of interest. (D) Average time-course of this effect in a cluster of five contributing electrodes across NV conditions. (E) Corresponding time-courses for the rotated conditions, where the effect of spectral detail is absent. (F) Mean evoked activity for each condition in the significant time-window, error bars represent standard error of the mean corrected to be appropriate for repeated-measures comparisons, as described in Loftus and Masson (1994).
Figure 5
Figure 5
Results of ANOVA of induced activity in the alpha-band. (A) Electrode-by-time plot of the p-values for the interaction of rotation × spectral detail with corresponding F- and p-values, thresholded at p = 0.001, revealing the time-window of interest (462–633 ms). The color bar indicates the corresponding F- and p-values, the threshold for p(FDR) < 0.05 is indicated. (B) Topography of this effect, using the same color scale as in (A) at the peak of the effect (533 ms), indicating a contribution of left-temporal sources. (C) Localization of this effect in the inverse space, the main source being in the left supramarginal gyrus extending into left inferior parietal and superior temporal structures, showing the average F-statistic over the time-window of interest. (D) Average time-course of this effect in a cluster of five contributing electrodes across NV conditions, demonstrating enhanced alpha-band suppression for more intelligible conditions. (E) Corresponding time-courses for the spectrally rotated conditions, where the effect of spectral detail is absent. (F) Alpha-band activity for each condition in the significant time-window, error bars represent standard error of the mean corrected to be appropriate for repeated-measures comparisons, as described in Loftus and Masson (1994).

References

    1. Altmann G. T. M., Young D. (1993). “Factors affecting adaptation to time-compressed speech,” Paper Presented at the Third European Conference on Speech Communication and Technology. http://www.isca-speech.org/archive/eurospeech_1993/e93_0333.html
    1. Becker R., Reinacher M., Freyer F., Villringer A., Ritter P. (2011). How ongoing neuronal oscillations account for evoked fMRI variability. J. Neurosci. 31, 11016–11027 10.1523/jneurosci.0210-11.2011 - DOI - PMC - PubMed
    1. Becker R., Ritter P., Villringer A. (2008). Influence of ongoing alpha rhythm on the visual evoked potential. Neuroimage 39, 707–716 10.1016/j.neuroimage.2007.09.016 - DOI - PubMed
    1. Benjamini Y., Yekutieli D. (2001). The control of the false discovery rate in multiple testing under dependency. Ann. Stat. 29, 1165–1188 10.1214/aos/1013699998 - DOI
    1. Berger H. (1929). Über das elektrenkephalogramm des menschen. Eur. Arch. Psychiatry Clin. Neurosci. 87, 527–570 10.1007/BF01797193 - DOI

LinkOut - more resources