. 2013 Sep 1;7(5):10.1002/lpor.201200060.
doi: 10.1002/lpor.201200060.

Photoacoustic Microscopy

Affiliations

Photoacoustic Microscopy

Junjie Yao et al. Laser Photon Rev. .

Abstract

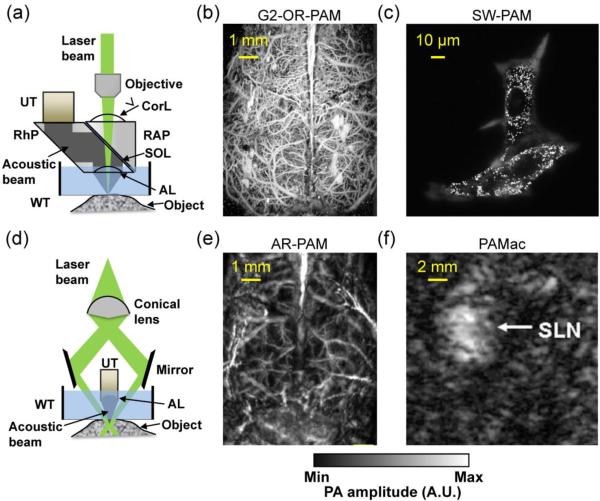
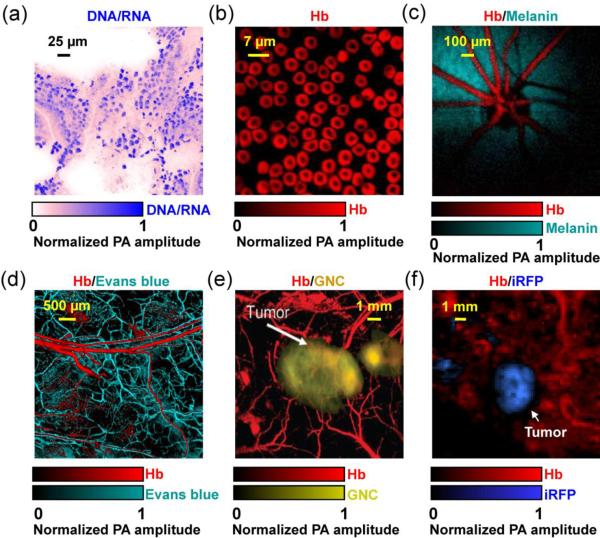
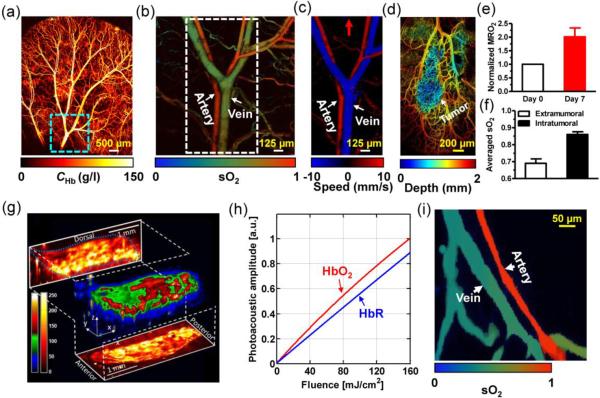
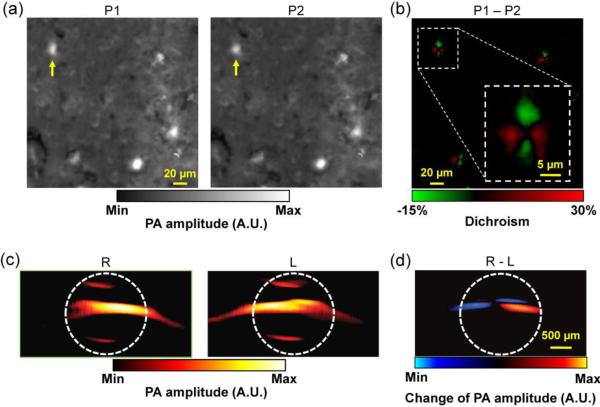
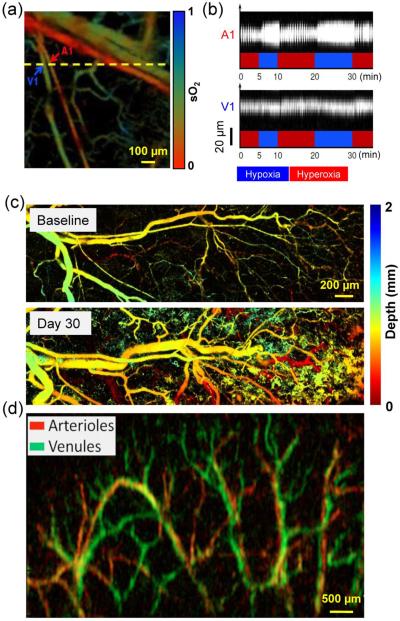
Photoacoustic microscopy (PAM) is a hybrid in vivo imaging technique that acoustically detects optical contrast via the photoacoustic effect. Unlike pure optical microscopic techniques, PAM takes advantage of the weak acoustic scattering in tissue and thus breaks through the optical diffusion limit (~1 mm in soft tissue). With its excellent scalability, PAM can provide high-resolution images at desired maximum imaging depths up to a few millimeters. Compared with backscattering-based confocal microscopy and optical coherence tomography, PAM provides absorption contrast instead of scattering contrast. Furthermore, PAM can image more molecules, endogenous or exogenous, at their absorbing wavelengths than fluorescence-based methods, such as wide-field, confocal, and multi-photon microscopy. Most importantly, PAM can simultaneously image anatomical, functional, molecular, flow dynamic and metabolic contrasts in vivo. Focusing on state-of-the-art developments in PAM, this Review discusses the key features of PAM implementations and their applications in biomedical studies.

Keywords: Photoacoustic microscopy; blood flow imaging; brain imaging; functional imaging; gene expression imaging; metabolic imaging; molecular imaging; multi-scale imaging; nanoparticle imaging; real-time imaging; tumor imaging.


Figures

Figure 1
Figure 1
Representative photoacoustic microscopy. (a) Second-generation optical-resolution photoacoustic microscopy (G2-OR-PAM), where the lateral resolution is determined by the diffraction-limited optical focusing. AL, acoustic lens; Corl, correction lens; RAP, right angled prism; RhP, rhomboid prism; SOL, silicone oil layer; UT, ultrasonic transducer; WT, water tank. (b) G2-OR-PAM of cortical vasculature in a living mouse with the scalp removed but the skull intact. (c) Sub-wavelength photoacoustic microscopy (SW-PAM) of a melanoma cell, where single melanosomes can be resolved. Reprinted with permission from [35]. (d) Dark-field acoustic-resolution photoacoustic microscopy (AR-PAM), where the lateral resolution is determined by the diffraction-limited acoustic focusing. (e) Dark-field AR-PAM of the cortical vasculature in a living mouse with both the scalp and skull intact. Reprinted with permission from [43]. (f) Deep photoacoustic macroscopy (PAMac) of the sentinel lymph node (SLN) in a living rat. The SLN was about 18 mm deep. Reprinted with permission from [47].
Figure 2
Figure 2
Representative maximum imaging depths of PAM. (a) G2-OR-PAM of a black needle obliquely inserted into the leg of an anesthetized living mouse. A maximum imaging depth of ~1.2 mm was achieved. Reprinted with permission from [38]. (b) Dark-field AR-PAM of subcutaneous vessels in a living rat when the skin was covered by a chicken breast tissue slab. A maximum imaging depth of ~3.3 mm was achieved. V, vessels; T, top surface of the chicken tissue. Reprinted with permission from [33].
Figure 3
Figure 3
Noise-equivalent molar concentration (NEC, left axis, black circles) of hemoglobin molecules and noise-equivalent number (NEN, right axis, red squares) of hemoglobin molecules per resolution voxel versus the imaging depth of different photoacoustic imaging systems. The results were quantified from the reported in vivo data in the literature. The solid curves are power function fittings.
Figure 4
Figure 4
Absorption spectra of major endogenous contrast agents in biological tissue. Oxy-hemoglobin, red line (150 g/L in blood); Deoxy-hemoglobin, blue line (150 g/L in blood); Lipid, brown line (20% by volume in tissue); Water, green line (80% by volume in tissue); DNA, magenta line (1 g/L in cell nuclei); RNA, orange line (1 g/L in cell nuclei); Melanin, black line (14.3 g/L in medium human skin); Glucose, purple line (720 mg/L in blood).
Figure 5
Figure 5
Representative multi-contrast PAM images. (a) UV-PAM of cell nuclei (shown in blue) in a 6-μm-thick slice from mouse small intestine. No histology staining was needed here. The signals of cell nuclei come from DNA and RNA. Reprinted with permission from [39]. (b) SW-PAM of red blood cells (RBC). The signals of RBCs come from hemoglobin (Hb). Reprinted with permission from [35]. (c) Photoacoustic ophthalmoscopy of retinal vessels (shown in red) and the retinal pigment epithelium layer (RPE, shown in green) in a living rat. The signals of the RPE layer come from melanin. Reprinted with permission from [68]. (d) OR-PAM of the microvasculature in a mouse ear, where the capillaries (shown in green) were enhanced by Evans blue dye. Reprinted with permission from [101]. (e) AR-PAM of a subcutaneously inoculated B16 melanoma labeled with targeted gold nanocages (GNC, shown in yellow) and the surrounding vessels (shown in red) in a living mouse. Reprinted with permission from [112]. (f) PAMac of a mouse mammary gland tumor which expressed a near-infrared fluorescent protein iRFP (shown in blue). Reprinted with permission from [122].
Figure 6
Figure 6
Representative multi-parameter PAM images. (a) OR-PAM of the total concentration of hemoglobin (CHb) in a mouse ear. (b) OR-PAM of the oxygen saturation of hemoglobin (sO2) in the area indicated by the dashed box in (a). (c) OR-PAM of blood flow in the area indicated by the dashed box in (b). Red arrow: positive flow direction. (d) OR-PAM of a mouse ear bearing a xenographed glioblastoma on Day 7. The vasculature of the mouse ear was color-coded by depth: blue (superficial) to red (deep). (e) MRO2 change induced by tumor growth in (d). A 100% increase in MRO2 indicated the tumor hypermetabolism. (f) Averaged sO2 inside and outside the tumor, which suggested that the tumor region was hyperoxic. (a–f) were adapted with permission from [82]. (g) Vibrational PAM of fat bodies in a 3rd-instar larva of Drosophila melanogaster embedded in a thin layer of agar gel. The PA signals come from the overtone absorption of CH bond stretch in lipid. Reprinted with permission from [95]. (h) OR-PAM measurement of the absorption relaxation time of oxy-hemoglobin (HbO2) and deoxy-hemoglobin (HbR), made by fitting the PA signal amplitude as a function of incident laser fluence. Reprinted with permission from [60]. (i) Single-wavelength PAM measurement of the sO2 in a mouse ear, based on the relaxation times of HbO2 and HbR. Reprinted with permission from [165].
Figure 7
Figure 7
PAM specificity enhancement. (a) Dichroism PAM of amyloid plaques in an APP/PS1 mouse brain section stained with Congo Red (CR), acquired with two orthogonally polarized optical irradiations P1 and P2. (b) Subtraction of P1 and P2, which eliminates the non-dichroic background and highlights the dichroic contrast of the amyloid plaques. Inset: close-up of the boxed area, showing the bipolar dichroism pattern of a representative amyloid plaque indicated by yellow arrows in (a–b). (a–b) were adapted with permission from [166]. (c) Magnetomotive PAM of magnetic nanoparticles (MNP) trapped in MNP-ink solution in a tube. R: the tube was closer to the right magnet; L: the tube was closer to the left magnet. Note that MNPs changed their positions while the nonmagnectic ink did not. The white dashed circles indicate the tube boundary. (d) Subtraction of R and L, which substantially suppresses the undesired background signals. (c–d) were adapted with permission from [168].
Figure 8
Figure 8
Representative PAM applications in preclinical studies. (a) OR-PAM of the sO2 in a mouse ear where an arteriole-venule pair (~20 μm in diameter) was chosen for vasodilation and vasomotion study. A1, a representative arteriole; V1, a representative venule. (b) Vasodilation and vasomotion in response to switching the physiological state between systemic hyperoxia and hypoxia: a B-scan monitoring of the changes in the cross-sections of the arteriole and venule. The vasomotion of the arteriole had greater amplitude than that of the venule but the same frequency. (a–b) were adapted with permission from [133]. (c) Chronic OR-PAM of the neovascularization in the same mouse. The blood vessels of the mouse ear were color-coded by depth: blue (superficial) to red (deep). Adapted with permission from [175]. (d) Linear-array PAM of wash-in dynamics of Evans blue in a mouse ear. The whole dynamic flow of Evans blue from arteries (shown in red) to veins (shown in green) was captured. Reprinted with permission from [160].
Figure 9
Figure 9
Representative PAM applications in preclinical and human studies. (a) AR-PAM of cortical vasculature in a living mouse. Dotted white line indicates the line scanning range. CS, coronal suture. (b) Dynamic vessel response profiles acquired through a hypoxic challenge and shown in percent change of ratiometric PA signals at two wavelengths of 561 nm and 570 nm. Each colored trace corresponds to the respective cortical vessel crossed by the dotted line in (a). (a–b) were adapted with permission from [197]. (c) AR-PAM of subcutaneous vasculature of the palm of a human hand at 584 nm, with an incident laser fluence of ~6 mJ/cm2. Inset: photograph of the imaged area. Reprinted with permission from [33]. (d) OR-PAM of the iris microvasculature in a living adult mouse. A vessel-by-vessel sO2 mapping (shown in color scale) was generated and overlaid on the vascular image acquired at 570 nm (shown in gray scale). CP, ciliary process; MIC, major iris circle; RCB, recurrent choroidal branch; RIA, radial iris artery. Reprinted with permission from [135].

References

    1. Amos B. Lessons from the history of light microscopy. Nature Cell Biology. 2000;2:E151–E152. - PubMed
    1. Wang LV, Wu H.-i. Biomedical optics : principles and imaging. xiv. Wiley-Interscience; Hoboken, N.J.: 2007. p. 362.
    1. Wang LHV, Hu S. Photoacoustic Tomography: In Vivo Imaging from Organelles to Organs. Science. 2012;335:1458–1462. - PMC - PubMed
    1. Wang LV. Tutorial on photoacoustic microscopy and computed tomography. IEEE Journal of Selected Topics in Quantum Electronics. 2008;14:171–179.
    1. Wang LV. Prospects of photoacoustic tomography. Medical Physics. 2008;35:5758–5767. - PMC - PubMed