

Candidate luminal B breast cancer genes identified by genome, gene expression and DNA methylation profiling
- PMID: 24416132
- PMCID: PMC3886975
- DOI: 10.1371/journal.pone.0081843
Candidate luminal B breast cancer genes identified by genome, gene expression and DNA methylation profiling
Abstract
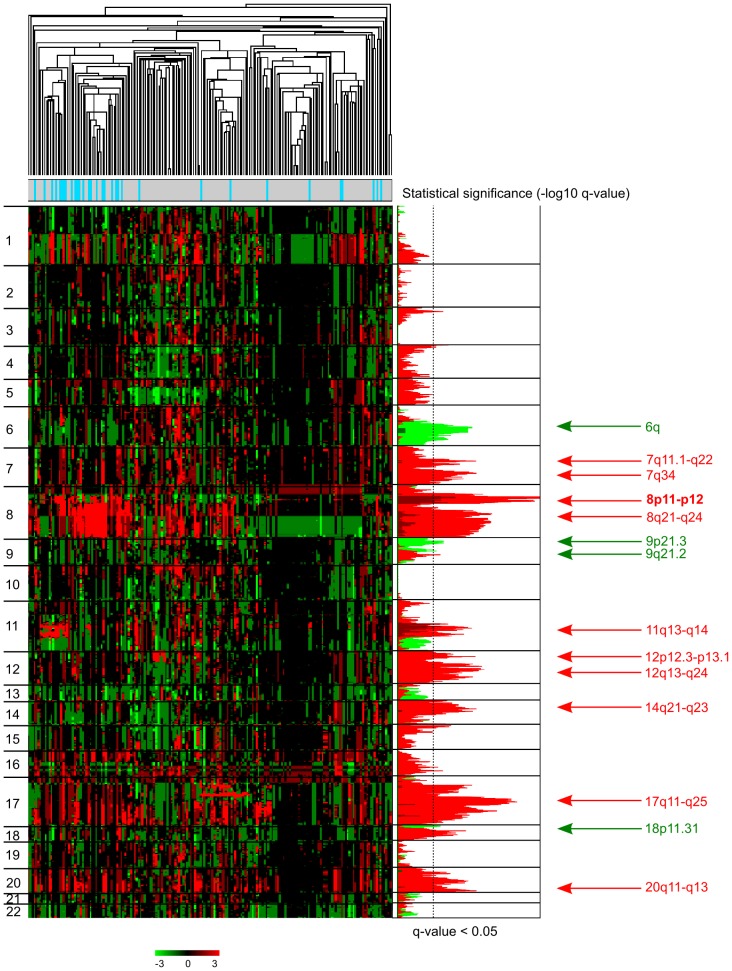
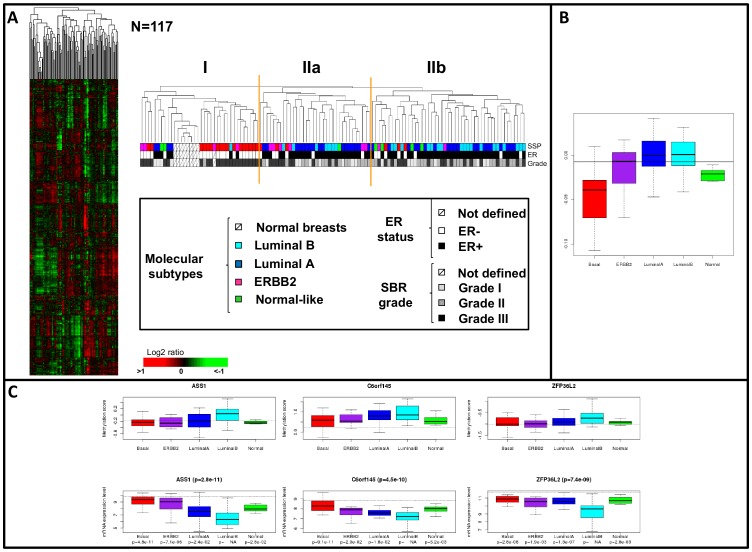
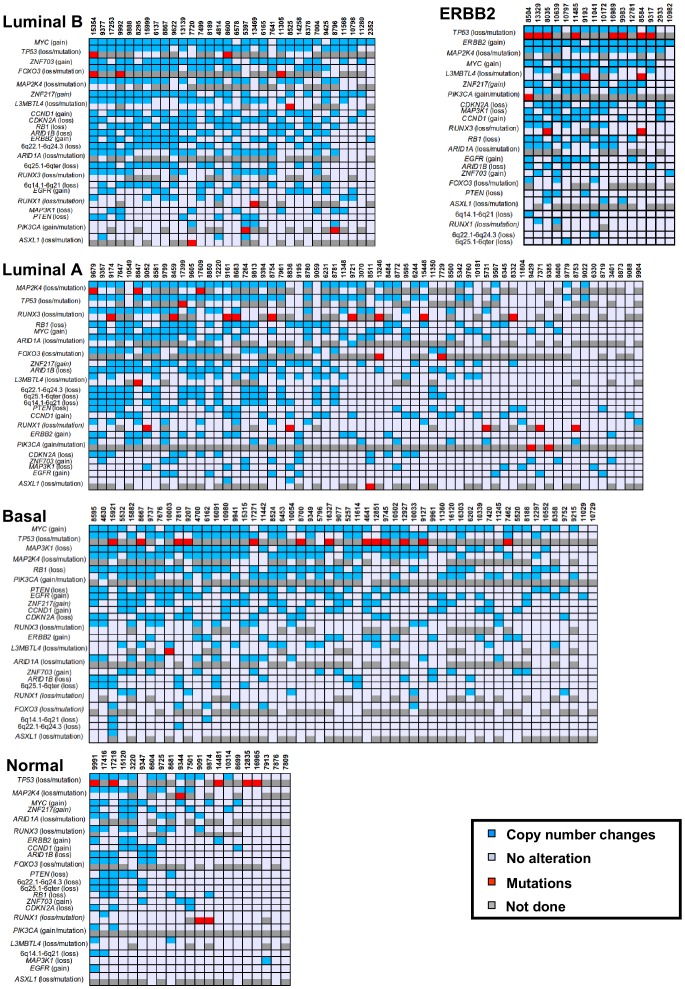
Breast cancers (BCs) of the luminal B subtype are estrogen receptor-positive (ER+), highly proliferative, resistant to standard therapies and have a poor prognosis. To better understand this subtype we compared DNA copy number aberrations (CNAs), DNA promoter methylation, gene expression profiles, and somatic mutations in nine selected genes, in 32 luminal B tumors with those observed in 156 BCs of the other molecular subtypes. Frequent CNAs included 8p11-p12 and 11q13.1-q13.2 amplifications, 7q11.22-q34, 8q21.12-q24.23, 12p12.3-p13.1, 12q13.11-q24.11, 14q21.1-q23.1, 17q11.1-q25.1, 20q11.23-q13.33 gains and 6q14.1-q24.2, 9p21.3-p24,3, 9q21.2, 18p11.31-p11.32 losses. A total of 237 and 101 luminal B-specific candidate oncogenes and tumor suppressor genes (TSGs) presented a deregulated expression in relation with their CNAs, including 11 genes previously reported associated with endocrine resistance. Interestingly, 88% of the potential TSGs are located within chromosome arm 6q, and seven candidate oncogenes are potential therapeutic targets. A total of 100 candidate oncogenes were validated in a public series of 5,765 BCs and the overexpression of 67 of these was associated with poor survival in luminal tumors. Twenty-four genes presented a deregulated expression in relation with a high DNA methylation level. FOXO3, PIK3CA and TP53 were the most frequent mutated genes among the nine tested. In a meta-analysis of next-generation sequencing data in 875 BCs, KCNB2 mutations were associated with luminal B cases while candidate TSGs MDN1 (6q15) and UTRN (6q24), were mutated in this subtype. In conclusion, we have reported luminal B candidate genes that may play a role in the development and/or hormone resistance of this aggressive subtype.
Conflict of interest statement
Figures


Similar articles
-
Comprehensive molecular portraits of human breast tumours.Nature. 2012 Oct 4;490(7418):61-70. doi: 10.1038/nature11412. Epub 2012 Sep 23. Nature. 2012. PMID: 23000897 Free PMC article.
-
Molecular profiling of breast cancer cell lines defines relevant tumor models and provides a resource for cancer gene discovery.PLoS One. 2009 Jul 3;4(7):e6146. doi: 10.1371/journal.pone.0006146. PLoS One. 2009. PMID: 19582160 Free PMC article.
-
Integrated profiling of basal and luminal breast cancers.Cancer Res. 2007 Dec 15;67(24):11565-75. doi: 10.1158/0008-5472.CAN-07-2536. Cancer Res. 2007. PMID: 18089785
-
p53 in breast cancer subtypes and new insights into response to chemotherapy.Breast. 2013 Aug;22 Suppl 2:S27-9. doi: 10.1016/j.breast.2013.07.005. Breast. 2013. PMID: 24074787 Review.
-
DNA amplifications in breast cancer: genotypic-phenotypic correlations.Future Oncol. 2010 Jun;6(6):967-84. doi: 10.2217/fon.10.56. Future Oncol. 2010. PMID: 20528234 Review.
Cited by
-
Studies on Human Cultured Fibroblasts and Cutaneous Squamous Cell Carcinomas Suggest That Overexpression of Histone Variant H2A.J Promotes Radioresistance and Oncogenic Transformation.Genes (Basel). 2024 Jun 27;15(7):851. doi: 10.3390/genes15070851. Genes (Basel). 2024. PMID: 39062630 Free PMC article.
-
Insights into the pleiotropic roles of ZNF703 in cancer.Heliyon. 2023 Sep 14;9(9):e20140. doi: 10.1016/j.heliyon.2023.e20140. eCollection 2023 Sep. Heliyon. 2023. PMID: 37810156 Free PMC article. Review.
-
miR-125 in Breast Cancer Etiopathogenesis: An Emerging Role as a Biomarker in Differential Diagnosis, Regenerative Medicine, and the Challenges of Personalized Medicine.Noncoding RNA. 2024 Feb 21;10(2):16. doi: 10.3390/ncrna10020016. Noncoding RNA. 2024. PMID: 38525735 Free PMC article. Review.
-
Assessing the efficacy of androgen receptor and Sox10 as independent markers of the triple-negative breast cancer subtype by transcriptome profiling.Oncotarget. 2018 Sep 7;9(70):33348-33359. doi: 10.18632/oncotarget.26072. eCollection 2018 Sep 7. Oncotarget. 2018. PMID: 30279965 Free PMC article.
-
Ion Channels, Transporters, and Sensors Interact with the Acidic Tumor Microenvironment to Modify Cancer Progression.Rev Physiol Biochem Pharmacol. 2022;182:39-84. doi: 10.1007/112_2021_63. Rev Physiol Biochem Pharmacol. 2022. PMID: 34291319 Review.
References
-
- Dunn L, Demichele A (2009) Genomic predictors of outcome and treatment response in breast cancer. Mol Diagn Ther 13: 73–90. - PubMed
-
- Perou CM, Sorlie T, Eisen MB, van de Rijn M, Jeffrey SS, et al. (2000) Molecular portraits of human breast tumours. Nature 406: 747–752. - PubMed
-
- Sotiriou C, Pusztai L (2009) Gene-expression signatures in breast cancer. N Engl J Med 360: 790–800. - PubMed
Publication types
MeSH terms
Substances
LinkOut - more resources
Full Text Sources
Other Literature Sources
Research Materials
Miscellaneous
