

Forecasting seizures in dogs with naturally occurring epilepsy
- PMID: 24416133
- PMCID: PMC3885383
- DOI: 10.1371/journal.pone.0081920
Forecasting seizures in dogs with naturally occurring epilepsy
Abstract
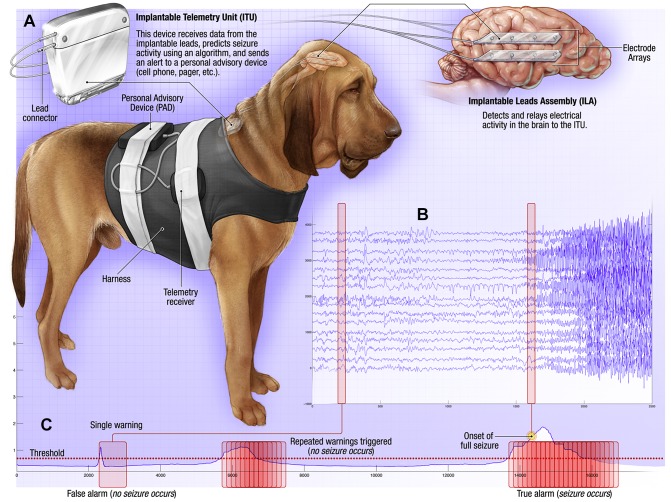
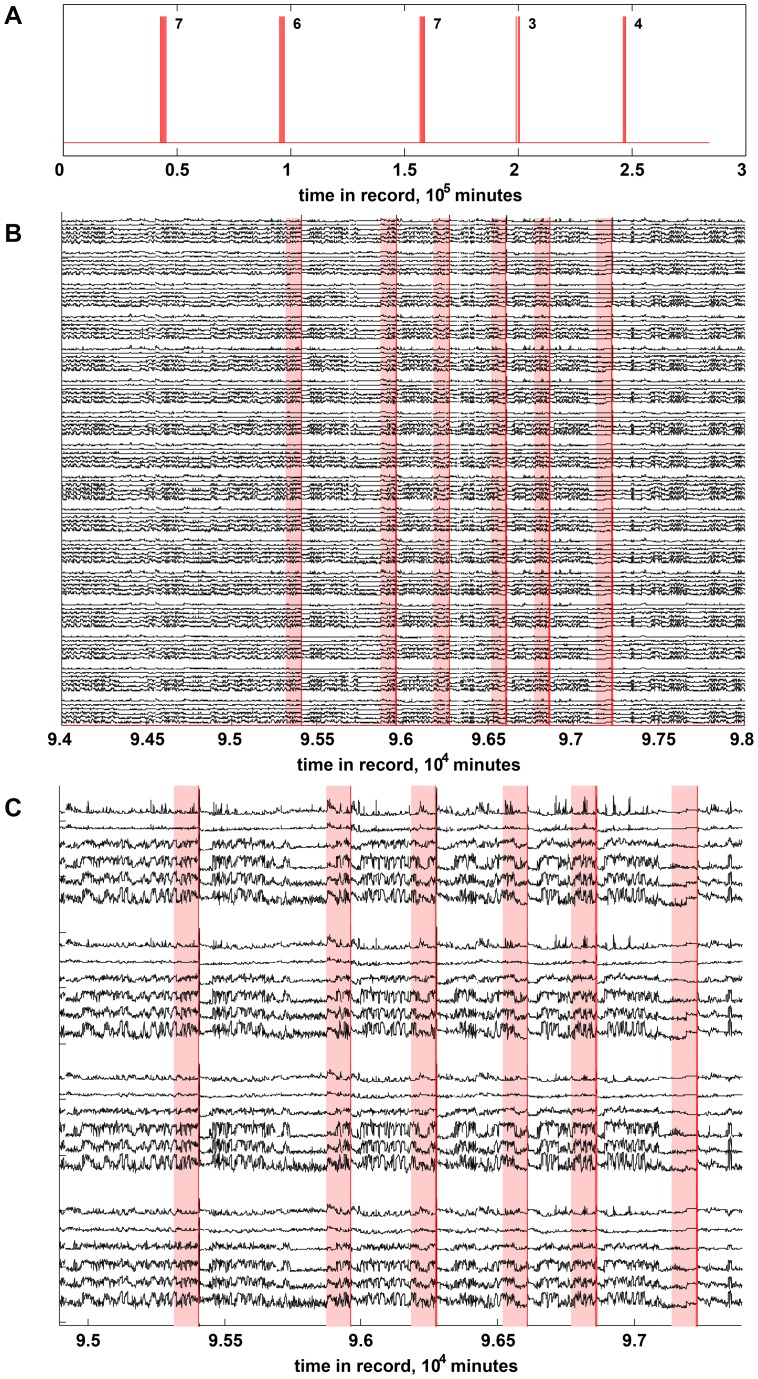
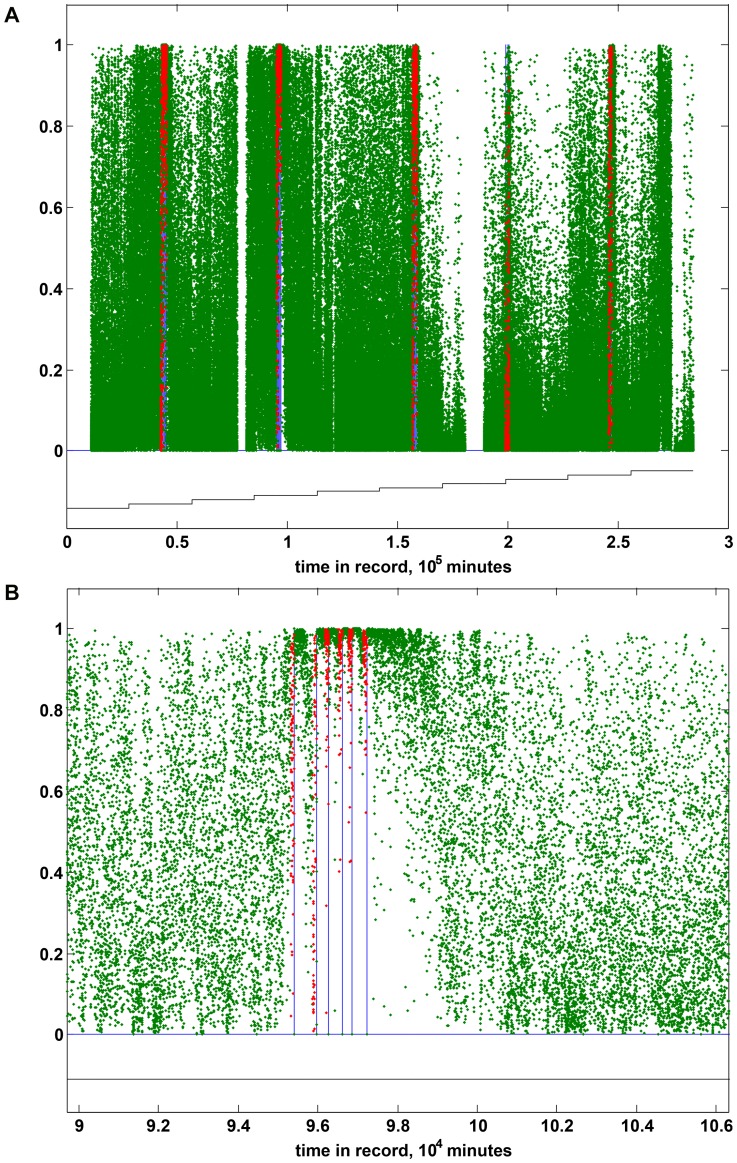
Seizure forecasting has the potential to create new therapeutic strategies for epilepsy, such as providing patient warnings and delivering preemptive therapy. Progress on seizure forecasting, however, has been hindered by lack of sufficient data to rigorously evaluate the hypothesis that seizures are preceded by physiological changes, and are not simply random events. We investigated seizure forecasting in three dogs with naturally occurring focal epilepsy implanted with a device recording continuous intracranial EEG (iEEG). The iEEG spectral power in six frequency bands: delta (0.1-4 Hz), theta (4-8 Hz), alpha (8-12 Hz), beta (12-30 Hz), low-gamma (30-70 Hz), and high-gamma (70-180 Hz), were used as features. Logistic regression classifiers were trained to discriminate labeled pre-ictal and inter-ictal data segments using combinations of the band spectral power features. Performance was assessed on separate test data sets via 10-fold cross-validation. A total of 125 spontaneous seizures were detected in continuous iEEG recordings spanning 6.5 to 15 months from 3 dogs. When considering all seizures, the seizure forecasting algorithm performed significantly better than a Poisson-model chance predictor constrained to have the same time in warning for all 3 dogs over a range of total warning times. Seizure clusters were observed in all 3 dogs, and when the effect of seizure clusters was decreased by considering the subset of seizures separated by at least 4 hours, the forecasting performance remained better than chance for a subset of algorithm parameters. These results demonstrate that seizures in canine epilepsy are not randomly occurring events, and highlight the feasibility of long-term seizure forecasting using iEEG monitoring.
Conflict of interest statement
Figures
Similar articles
-
Forecasting Seizures Using Intracranial EEG Measures and SVM in Naturally Occurring Canine Epilepsy.PLoS One. 2015 Aug 4;10(8):e0133900. doi: 10.1371/journal.pone.0133900. eCollection 2015. PLoS One. 2015. PMID: 26241907 Free PMC article.
-
Deep-learning for seizure forecasting in canines with epilepsy.J Neural Eng. 2019 Jun;16(3):036031. doi: 10.1088/1741-2552/ab172d. Epub 2019 Apr 8. J Neural Eng. 2019. PMID: 30959492
-
Feasibility study of a caregiver seizure alert system in canine epilepsy.Epilepsy Res. 2013 Oct;106(3):456-60. doi: 10.1016/j.eplepsyres.2013.06.007. Epub 2013 Aug 18. Epilepsy Res. 2013. PMID: 23962794 Free PMC article.
-
[Significance of electroencephalography for the diagnosis of seizures in dogs].Tierarztl Prax. 1996 Apr;24(2):129-36. Tierarztl Prax. 1996. PMID: 8650681 Review. German.
-
Dogs as a Natural Animal Model of Epilepsy.Front Vet Sci. 2022 Jun 22;9:928009. doi: 10.3389/fvets.2022.928009. eCollection 2022. Front Vet Sci. 2022. PMID: 35812852 Free PMC article. Review.
Cited by
-
Future of seizure prediction and intervention: closing the loop.J Clin Neurophysiol. 2015 Jun;32(3):194-206. doi: 10.1097/WNP.0000000000000139. J Clin Neurophysiol. 2015. PMID: 26035672 Free PMC article. Review.
-
Epileptic seizure prediction based on EEG spikes detection of ictal-preictal states.J Biomed Res. 2020 Feb 17;34(3):162-169. doi: 10.7555/JBR.34.20190097. J Biomed Res. 2020. PMID: 32561696 Free PMC article.
-
The performance evaluation of the state-of-the-art EEG-based seizure prediction models.Front Neurol. 2022 Nov 24;13:1016224. doi: 10.3389/fneur.2022.1016224. eCollection 2022. Front Neurol. 2022. PMID: 36504642 Free PMC article. Review.
-
Supervised filters for EEG signal in naturally occurring epilepsy forecasting.PLoS One. 2017 Jun 20;12(6):e0178808. doi: 10.1371/journal.pone.0178808. eCollection 2017. PLoS One. 2017. PMID: 28632737 Free PMC article.
-
SVM-Based System for Prediction of Epileptic Seizures From iEEG Signal.IEEE Trans Biomed Eng. 2017 May;64(5):1011-1022. doi: 10.1109/TBME.2016.2586475. Epub 2016 Jun 29. IEEE Trans Biomed Eng. 2017. PMID: 27362758 Free PMC article.
References
-
- Linehan J, Berg AT (2011) Epidemiologic aspects of epilepsy. In: The Treatment of Epilepsy: Principle and Practice. Williams & Wilkins. pp. 165–172.
-
- Murray, Lopez, AD (1994) Global Comparative Assessments in the Health Sector: Disease Burden, Expenditure, Intervention Packages. Geneva, Switzerland: World Health Organization.
-
- Kwan P, Brodie MJ (2000) Early identification of refractory epilepsy. N Engl J Med 342: 314–319. - PubMed
-
- Schulze-Bonhage A, Kuhn A (2008) Unpredictability of Seizures and the Burden of Epilepsy. Seizure Prediction in Epilepsy: From Basic Mechanisms to Clinical Applications
-
- Schulze-Bonhage A, Sales F, Wagner K, Teotonio R, Carius A, et al. (2010) Views of patients with epilepsy on seizure prediction devices. Epilepsy Behav 18: 388–396. - PubMed
Publication types
MeSH terms
Grants and funding
LinkOut - more resources
Full Text Sources
Other Literature Sources
Medical
