

Real-time optical diagnosis of the rat brain exposed to a laser-induced shock wave: observation of spreading depolarization, vasoconstriction and hypoxemia-oligemia
- PMID: 24416150
- PMCID: PMC3885400
- DOI: 10.1371/journal.pone.0082891
Real-time optical diagnosis of the rat brain exposed to a laser-induced shock wave: observation of spreading depolarization, vasoconstriction and hypoxemia-oligemia
Erratum in
- PLoS One. 2014;9(4):e95067
Abstract
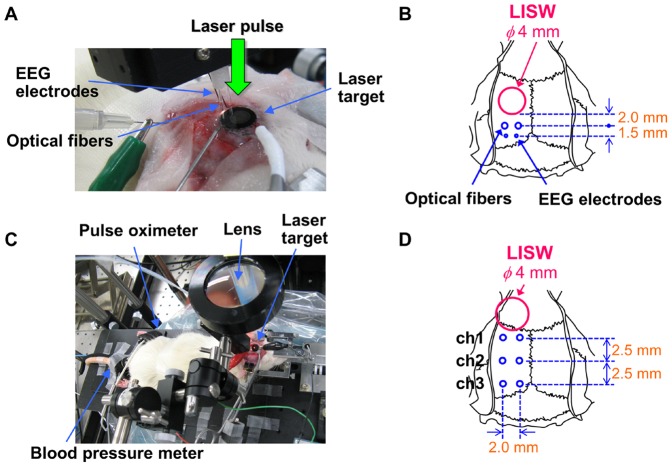
Despite many efforts, the pathophysiology and mechanism of blast-induced traumatic brain injury (bTBI) have not yet been elucidated, partially due to the difficulty of real-time diagnosis and extremely complex factors determining the outcome. In this study, we topically applied a laser-induced shock wave (LISW) to the rat brain through the skull, for which real-time measurements of optical diffuse reflectance and electroencephalogram (EEG) were performed. Even under conditions showing no clear changes in systemic physiological parameters, the brain showed a drastic light scattering change accompanied by EEG suppression, which indicated the occurrence of spreading depression, long-lasting hypoxemia and signal change indicating mitochondrial energy impairment. Under the standard LISW conditions examined, hemorrhage and contusion were not apparent in the cortex. To investigate events associated with spreading depression, measurement of direct current (DC) potential, light scattering imaging and stereomicroscopic observation of blood vessels were also conducted for the brain. After LISW application, we observed a distinct negative shift in the DC potential, which temporally coincided with the transit of a light scattering wave, showing the occurrence of spreading depolarization and concomitant change in light scattering. Blood vessels in the brain surface initially showed vasodilatation for 3-4 min, which was followed by long-lasting vasoconstriction, corresponding to hypoxemia. Computer simulation based on the inverse Monte Carlo method showed that hemoglobin oxygen saturation declined to as low as ∼35% in the long-term hypoxemic phase. Overall, we found that topical application of a shock wave to the brain caused spreading depolarization/depression and prolonged severe hypoxemia-oligemia, which might lead to pathological conditions in the brain. Although further study is needed, our findings suggest that spreading depolarization/depression is one of the key events determining the outcome in bTBI. Furthermore, a rat exposed to an LISW(s) can be a reliable laboratory animal model for blast injury research.
Conflict of interest statement
Figures


Similar articles
-
Multispectral imaging of cortical vascular and hemodynamic responses to a shock wave: observation of spreading depolarization and oxygen supply-demand mismatch.J Biomed Opt. 2019 Mar;24(3):1-17. doi: 10.1117/1.JBO.24.3.035005. J Biomed Opt. 2019. PMID: 30851013 Free PMC article.
-
In vivo imaging of nitric oxide in the male rat brain exposed to a shock wave.J Neurosci Res. 2023 Jun;101(6):976-989. doi: 10.1002/jnr.25172. Epub 2023 Feb 6. J Neurosci Res. 2023. PMID: 36747471
-
Effects of Isolated and Combined Exposure of the Brain and Lungs to a Laser-Induced Shock Wave(s) on Physiological and Neurological Responses in Rats.J Neurotrauma. 2022 Nov;39(21-22):1533-1546. doi: 10.1089/neu.2022.0101. Epub 2022 Jul 12. J Neurotrauma. 2022. PMID: 35652331
-
Quantitative In Vivo Imaging of Tissue Absorption, Scattering, and Hemoglobin Concentration in Rat Cortex Using Spatially Modulated Structured Light.In: Frostig RD, editor. In Vivo Optical Imaging of Brain Function. 2nd edition. Boca Raton (FL): CRC Press/Taylor & Francis; 2009. Chapter 12. In: Frostig RD, editor. In Vivo Optical Imaging of Brain Function. 2nd edition. Boca Raton (FL): CRC Press/Taylor & Francis; 2009. Chapter 12. PMID: 26844326 Free Books & Documents. Review.
-
Cortical Spreading Depression and Ischemia in Neurocritical Patients.Neurosurg Clin N Am. 2018 Apr;29(2):223-229. doi: 10.1016/j.nec.2017.11.003. Neurosurg Clin N Am. 2018. PMID: 29502713 Review.
Cited by
-
Oral ascorbic acid 2-glucoside prevents coordination disorder induced via laser-induced shock waves in rat brain.PLoS One. 2020 Apr 2;15(4):e0230774. doi: 10.1371/journal.pone.0230774. eCollection 2020. PLoS One. 2020. PMID: 32240226 Free PMC article.
-
Behavioral and Histopathological Impairments Caused by Topical Exposure of the Rat Brain to Mild-Impulse Laser-Induced Shock Waves: Impulse Dependency.Front Neurol. 2021 May 21;12:621546. doi: 10.3389/fneur.2021.621546. eCollection 2021. Front Neurol. 2021. PMID: 34093390 Free PMC article.
-
Cavitation-induced traumatic cerebral contusion and intracerebral hemorrhage in the rat brain by using an off-the-shelf clinical shockwave device.Sci Rep. 2019 Oct 30;9(1):15614. doi: 10.1038/s41598-019-52117-5. Sci Rep. 2019. PMID: 31666607 Free PMC article.
-
Effects of Selective Serotonin Reuptake Inhibitors on Depression-Like Behavior in a Laser-Induced Shock Wave Model.Front Neurol. 2021 Feb 10;12:602038. doi: 10.3389/fneur.2021.602038. eCollection 2021. Front Neurol. 2021. PMID: 33643190 Free PMC article.
-
Vascular and inflammatory factors in the pathophysiology of blast-induced brain injury.Front Neurol. 2015 Mar 16;6:48. doi: 10.3389/fneur.2015.00048. eCollection 2015. Front Neurol. 2015. PMID: 25852632 Free PMC article. Review.
References
-
- Wolf SJ, Bebarta VS, Bonnet CJ, Pons PT, Cantrill SV (2009) Blast Injuries. Lancet 374: 405–415. - PubMed
-
- Magnuson J, Leonessa F, Ling GS (2012) Neuropathology of explosive blast traumatic brain injury. Curr Neurol Neurosci Rep 12: 570–579. - PubMed
-
- Fischer H (2013) U.S. Military Casualty Statistics: Operation New Dawn, Operation Iraqi Freedom, and Operation Enduring Freedom. CRS Report for Congress
-
- Hoge CW, McGurk D, Thomas JL, Cox AL, Engel CC, et al. (2008) Mild traumatic brain injury in U.S. soldiers returning from Iraq. New Engl J Med 358: 453–463. - PubMed
-
- Ling G, Bandak F, Armonda R, Grant G, Ecklund J (2009) Explosive blast neurotrauma. J Neurotrauma 26: 815–825. - PubMed
Publication types
MeSH terms
Substances
LinkOut - more resources
Full Text Sources
Other Literature Sources
Molecular Biology Databases
Research Materials
