

Commuter mobility and the spread of infectious diseases: application to influenza in France
- PMID: 24416152
- PMCID: PMC3886984
- DOI: 10.1371/journal.pone.0083002
Commuter mobility and the spread of infectious diseases: application to influenza in France
Abstract
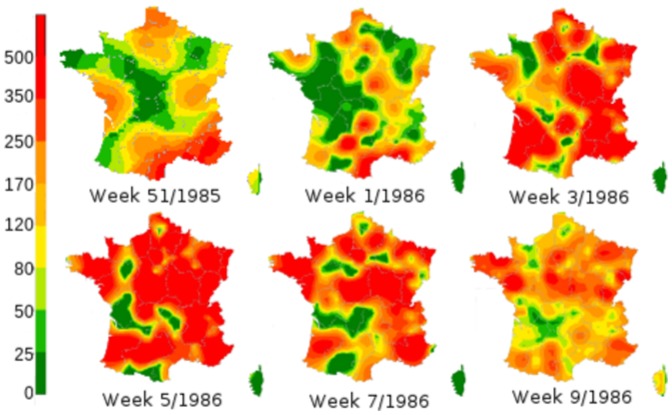
Commuting data is increasingly used to describe population mobility in epidemic models. However, there is little evidence that the spatial spread of observed epidemics agrees with commuting. Here, using data from 25 epidemics for influenza-like illness in France (ILI) as seen by the Sentinelles network, we show that commuting volume is highly correlated with the spread of ILI. Next, we provide a systematic analysis of the spread of epidemics using commuting data in a mathematical model. We extract typical paths in the initial spread, related to the organization of the commuting network. These findings suggest that an alternative geographic distribution of GP accross France to the current one could be proposed. Finally, we show that change in commuting according to age (school or work commuting) impacts epidemic spread, and should be taken into account in realistic models.
Conflict of interest statement
Figures
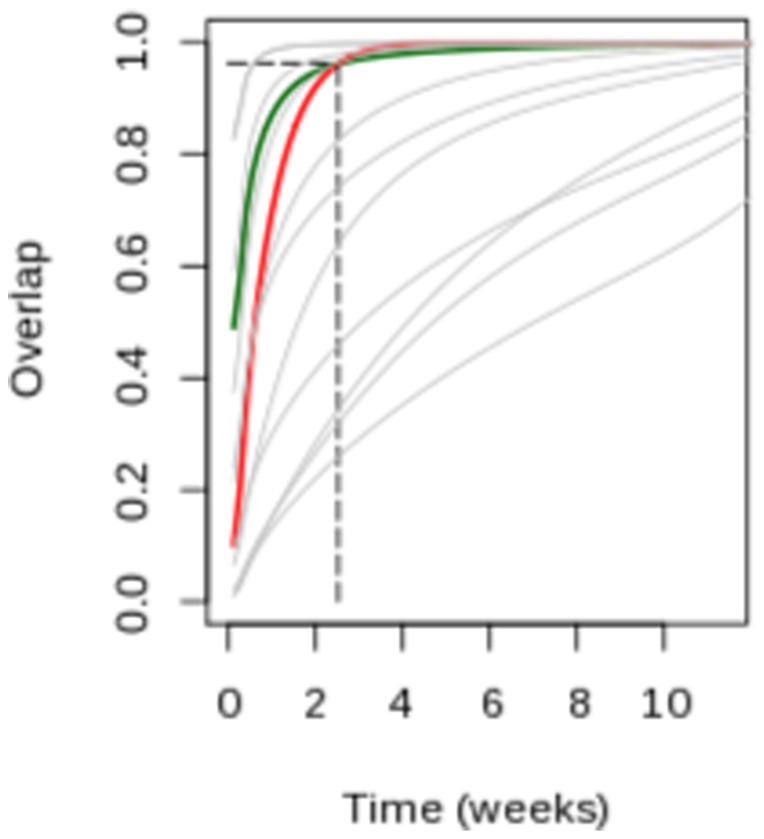
 was defined as the time when the green line crossed the red line.
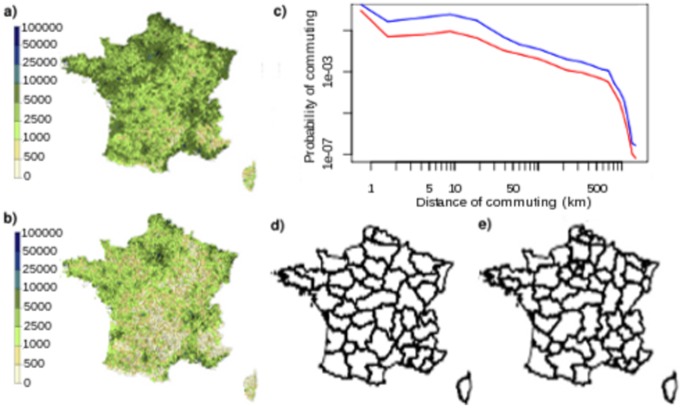
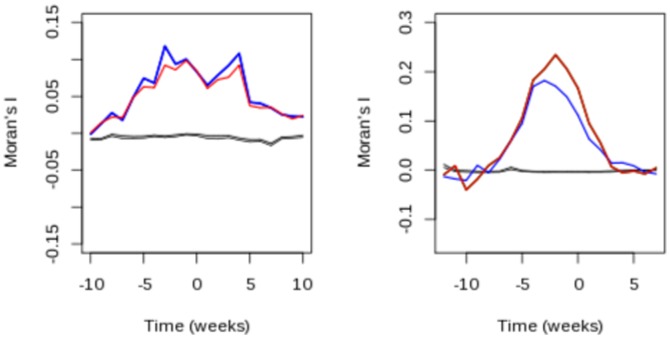
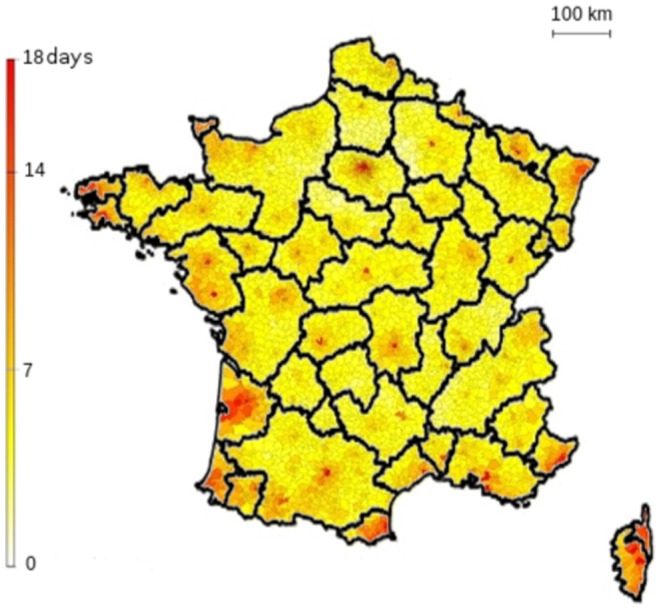
 values were averaged over all neighbors less than 100 km away. Basins of attraction were identified by clustering.
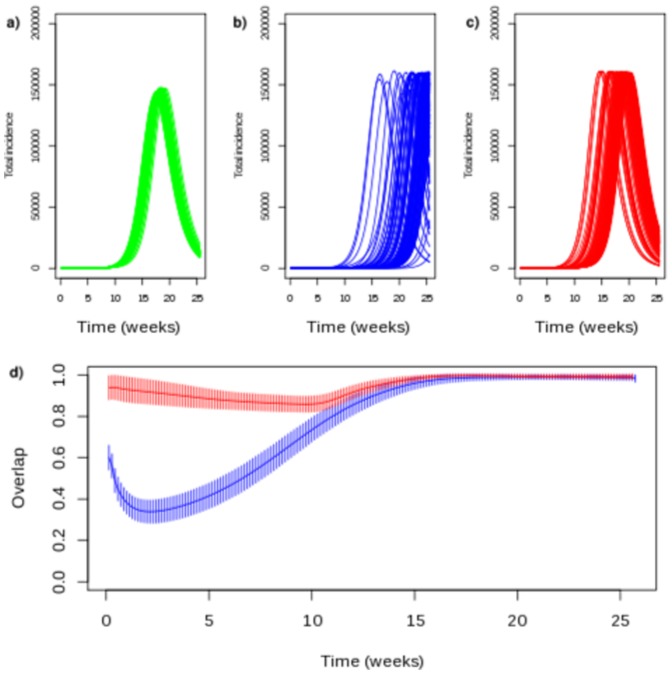
Similar articles
-
On the use of human mobility proxies for modeling epidemics.PLoS Comput Biol. 2014 Jul 10;10(7):e1003716. doi: 10.1371/journal.pcbi.1003716. eCollection 2014 Jul. PLoS Comput Biol. 2014. PMID: 25010676 Free PMC article.
-
The impact of mobility network properties on predicted epidemic dynamics in Dhaka and Bangkok.Epidemics. 2021 Jun;35:100441. doi: 10.1016/j.epidem.2021.100441. Epub 2021 Feb 22. Epidemics. 2021. PMID: 33667878 Free PMC article.
-
Metapopulation model using commuting flow for national spread of the 2009 H1N1 influenza virus in the Republic of Korea.J Theor Biol. 2018 Oct 7;454:320-329. doi: 10.1016/j.jtbi.2018.06.016. Epub 2018 Jun 27. J Theor Biol. 2018. PMID: 29940195
-
Gaps in mobility data and implications for modelling epidemic spread: A scoping review and simulation study.Epidemics. 2023 Mar;42:100666. doi: 10.1016/j.epidem.2023.100666. Epub 2023 Jan 12. Epidemics. 2023. PMID: 36689876
-
Virtual surveillance of communicable diseases: a 20-year experience in France.Stat Methods Med Res. 2006 Oct;15(5):413-21. doi: 10.1177/0962280206071639. Stat Methods Med Res. 2006. PMID: 17089946 Review.
Cited by
-
Spatiotemporal diffusion of influenza A (H1N1): Starting point and risk factors.PLoS One. 2018 Sep 4;13(9):e0202832. doi: 10.1371/journal.pone.0202832. eCollection 2018. PLoS One. 2018. PMID: 30180215 Free PMC article.
-
Forecasting influenza in Europe using a metapopulation model incorporating cross-border commuting and air travel.PLoS Comput Biol. 2020 Oct 14;16(10):e1008233. doi: 10.1371/journal.pcbi.1008233. eCollection 2020 Oct. PLoS Comput Biol. 2020. PMID: 33052907 Free PMC article.
-
A novel methodology for epidemic risk assessment of COVID-19 outbreak.Sci Rep. 2021 Mar 5;11(1):5304. doi: 10.1038/s41598-021-82310-4. Sci Rep. 2021. PMID: 33674627 Free PMC article.
-
Geospatial epidemiology of hospitalized patients with a positive influenza assay: A nationwide study in Iran, 2016-2018.PLoS One. 2022 Dec 13;17(12):e0278900. doi: 10.1371/journal.pone.0278900. eCollection 2022. PLoS One. 2022. PMID: 36512615 Free PMC article.
-
Network effects in influenza spread: The impact of mobility and socio-economic factors.Socioecon Plann Sci. 2021 Dec;78:101081. doi: 10.1016/j.seps.2021.101081. Epub 2021 May 11. Socioecon Plann Sci. 2021. PMID: 35812715 Free PMC article.
References
-
- Brockmann D, Hufnagel L, Geisel T (2006) The scaling laws of human travel. Nature 439: 462–465. - PubMed
-
- Gonzalez MC, Hidalgo CA, Barabasi AL (2008) Understanding individual human mobility patterns. Nature 453: 779–782. - PubMed
-
- Khan K, Arino J, Hu W, Raposo P, Sears J, et al. (2009) Spread of a Novel Inuenza A (H1N1) Virus via Global Airline Transportation. New England journal of medicine 361: 212–214. - PubMed
-
- Eubank S, Guclu H, Kumar VSA, Marathe MV, Srinivasan A, et al. (2004) Modelling disease outbreaks in realistic urban social networks. Nature 429: 180–184. - PubMed
Publication types
MeSH terms
LinkOut - more resources
Full Text Sources
Other Literature Sources
Medical
