. 2014 Jan 8;9(1):e84547.
doi: 10.1371/journal.pone.0084547. eCollection 2014.

Characterization and molecular profiling of PSEN1 familial Alzheimer's disease iPSC-derived neural progenitors

Affiliations

Characterization and molecular profiling of PSEN1 familial Alzheimer's disease iPSC-derived neural progenitors

Andrew A Sproul et al. PLoS One. .

Abstract

Presenilin 1 (PSEN1) encodes the catalytic subunit of γ-secretase, and PSEN1 mutations are the most common cause of early onset familial Alzheimer's disease (FAD). In order to elucidate pathways downstream of PSEN1, we characterized neural progenitor cells (NPCs) derived from FAD mutant PSEN1 subjects. Thus, we generated induced pluripotent stem cells (iPSCs) from affected and unaffected individuals from two families carrying PSEN1 mutations. PSEN1 mutant fibroblasts, and NPCs produced greater ratios of Aβ42 to Aβ40 relative to their control counterparts, with the elevated ratio even more apparent in PSEN1 NPCs than in fibroblasts. Molecular profiling identified 14 genes differentially-regulated in PSEN1 NPCs relative to control NPCs. Five of these targets showed differential expression in late onset AD/Intermediate AD pathology brains. Therefore, in our PSEN1 iPSC model, we have reconstituted an essential feature in the molecular pathogenesis of FAD, increased generation of Aβ42/40, and have characterized novel expression changes.


Conflict of interest statement

Competing Interests: The authors have declared that no competing interests exist.

Figures

Figure 1
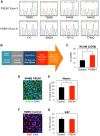
Figure 1. iPSC Characterization and Neuronal Differentiation.
A. Sequencing of core set iPSCs for PSEN1 mutations in exon 5 (M146L) and exon 8 (A246E) respectively. * marks site of the mutations. B. Cartoon of neuronal differentiation scheme, showing timing and changes into different medias as described in Fig S6. C. All 8 core lines were neuronally differentiated for 14 days and were analyzed by flow cytometry for the expression of CD56 (NCAM). The aggregate result of three independent experiments is shown. PSEN1 cells have a small but statistically significant increase in NCAM+ surface expression (control vs. PSEN1, n = 12 for each genotype, p = 0.02, Student's t-Test, error bars reflect SEM). D. Representative immunostaining for the neural progenitor marker nestin in iPSC line 8446B. Nestin is in green, DNA is in blue. E. Quantification of nestin staining for aggregate data from two independent experiment, with 3 biological replicates for the 8 core lines in each experiment. For control vs. PSEN1, n = 8 for each genotype, p = 0.02 (Student's t-Test, error bars reflect SEM). F. Representative immunostaining for the cell cycle marker Ki67 in cell line 7889O. ki67 is in green, DNA is in blue. G. Quantification of ki67 staining for aggregate data from three independent experiments, with 3 biological replicates for the 8 core lines in each experiment. See also Fig. S1.
Figure 2
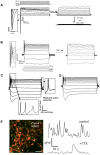
Figure 2. Action potentials and normal spontaneous Ca2+ transients are present in neurons differentiated from control line 7889O and 8446.
A. Representative traces in voltage clamp mode showing fast inward currents followed by long-lasting outward currents. Voltage 10 mV steps are shown in the upper panel. The inset shows an enlarged view of the inward current. (7899O, day 55). Inward sodium currents and potassium currents were observed on 13 out of the 22 cells analyzed at this time-point. The average Resting Membrane Potential (RMP) was equal to −45.94 mV±2.77 (standard error, s.e.; n = 17). Following initial recording cells were perfused with 1 µM TTX (tetrodotoxin) to block sodium currents, and subsequently with 10 mM TEA (tetraethylammonium) to block potassium currents. B. Representative action potentials in response to step current injections of 20 pA (lower panel) in current clamp mode (7889O, day 45). The average RMP was equal to −37.93 mV±6.16 (n = 13). Action potentials were observed on 4 out of 10 cells analyzed at this time point. Following initial recording the action potential was blocked by perfusing cells with 1 µM TTX. C. Representative action potentials in response to step current injections of 20 pA as in B in current clamp mode (7889O, day 55). They show trains of action potentials upon depolarizing current injection and “rebound” action potentials at the end of hyperpolarizing current injections. Action potentials were observed on 13 out of the 22 cells recorded at this timepoint. Out of them, 3 had a rebound action potential like the one shown on the inset of this panel. D. Representative action potentials in response to step current injections of 20 pA from 8446B, day 55. Trains of action potentials upon depolarizing current injection and “rebound” action potentials at the end of hyperpolarizing current injections are visible. Action potentials from 8446 cell line were observed on 8 out of the 15 cells recorded at this timepoint. E. (A) Image of 7889O loaded with Fluo-4NW (green) and stained for MAP2 (red) after Ca2+ transients have been recorded. (B) Representative spontaneous Ca2+ spikes recorded from 7889O neurons before and after application of TTX (N = 54 for control, N = 22 for TTX). Spiking frequency was significantly slower after application of TTX and the kinetics of each individual spike was slower, suggesting that 7889O cells display normal neuronal Ca2+ transients.
Figure 3
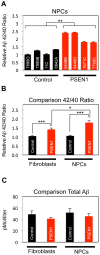
Figure 3. Aβ42/Aβ40 Ratio is Elevated in PSEN1 Cells.
All assays detected Aβ1-40 and 1-42 using ELISA (Wako) on conditioned media from the cell type indicated. Ratios were normalized against the first control line listed on each panel. Statistical significance was determined via Student's t-Test, error bars reflect SEM. Each n equals an individual cell line (averaged biological triplicates) in 1 independent experiment. A. Aβ42/Aβ40 ratio is increased in day 14 differentiated NPCs/early neurons. Control and PSEN1 NPCs were generated from the core set of iPSC lines, and one of three independent experiments is shown. For control compared to PSEN1 NPCs (n = 4 for each genotype), p = 0.003. B–C. Aggregate data is shown from 3 independent fibroblast and 3 independent NPCs/early neuron experiments. N = 7 for each fibroblast genotype data point, and n = 12 for each NPC/early neuron genotype data point. B. Aβ 42/40 ratios are shown for both control and PSEN1 fibroblasts and NPCs. For control fibroblasts vs. PSEN1 fibroblast, p = 0.001; for control NPCs vs. PSEN1 NPCs, p = 0.000005; for PSEN1 fibroblasts vs. PSEN1 NPCs, p = 0.036. C. Total Aβlevels (Aβ40 + Aβ42) are statistically similar between control and PSEN1 fibroblasts and NPCs/early neurons. See also Figure S3.
Figure 4
Figure 4. Gene Expression Profiling of Control vs. PS1 NPCs/Early Neurons.
All 8 core iPSC lines were differentiated for 14 days in triplicate wells, lysed for RNA, amplified to generate cRNA, and ran on the Illumina HumanHT-12-14 BeadChip platform. A. Clustering of 8 core lines by correlation. UR stands for unrelated control. B. Scatter plot (log scale) of the correlation of gene expression between 4 control lines and 4 PSEN1 lines. The red lines indicate a 3-fold expression difference. C. Chart indicating the number of upregulated (shown in blue) and downregulated (shown in yellow) genes for each threshold of analysis. “DiffScore” refers to genes with a Diff Score of >13 (upregulated) or <13 (downregulated), which indicate a change in expression with a pValue of p≤0.05, without regard to the relative fold change. Criteria for fold change categories include the listed fold change as well as statistical significance. See also Table S1.
Figure 5
Figure 5. Validation of Target Genes in PSEN1 NPCs.
All qPCR data was normalized internally to GAPDH expression and also to cell line 7889O. Statistical significance was determined by Student's t-Test and error bars reflect SEM. AB. NLRP2 mRNA expression was assessed in undifferentiated iPSCs (control vs. PSEN1, n = 4 for each genotype, p = 0.016) and NPCs (control vs.PSEN1, n = 4 for each genotype, p = 0.03). C. Western blot analysis of NLRP2 protein expression in NPCs. α-Tubulin was used as a loading control D. Representative experiment showing ASB9 mRNA expression in NPCs. For control vs. PSEN1, n = 4 for each genotype, p = 0.03. E. Representative experiment showing NDP mRNA expression in NPCs. For control vs. PSEN1, n = 4 for each genotype, p = 0.005. See also Table S2.
Figure 6
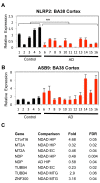
Figure 6. Examination of Target Genes in Late-Onset AD Brains.
A–B. qPCR of NLRP2 (A) and ASB9 (B) from mRNA from Brodmann's area (BA38) from control and AD brains. Black bars (1–5) are controls and red bars represent AD patients (6–16), which are described in Fig S5. qPCR data was normalized internally to GAPDH expression and also to the average of 5 control lines. Statistical significance was determined by Student's t-Test and error bars reflect SEM. For control vs. AD, n = 5 for control, n = 11 for AD, p = 0.005. C. List of PSEN1 NPC target genes (Table S2) that have differential expression in independent microarray data of laser captured microdissected (LCM) cortical neurons from one of three brain areas (details in Fig S5). All comparisons are either non-demented AD pathology (NDAD) or AD versus control samples. HIP refers to hippocampus, EC for entorhinal cortex, and MTG for middle temporal gyrus. Fold change and significance (FDR: false discover rate) reflect values for LCM neuron arrays. See also Figure S4.

References

    1. Ballard C, Gauthier S, Corbett A, Brayne C, Aarsland D, et al. (2011) Alzheimer's disease. The Lancet 377: 1019–1031 10.1016/S0140-6736(10)61349-9 - DOI - PubMed
    1. Bekris LM, Yu CE, Bird TD, Tsuang DW (2010) Review Article: Genetics of Alzheimer Disease. Journal of Geriatric Psychiatry and Neurology 23: 213–227 10.1177/0891988710383571 - DOI - PMC - PubMed
    1. Elder GA, Gama Sosa MA, Gasperi R, Dickstein DL, Hof PR (2010) Presenilin transgenic mice as models of Alzheimer's disease. Brain Struct Funct 214: 127–143 10.1007/s00429-009-0227-3 - DOI - PMC - PubMed
    1. Karran E, Mercken M, De Strooper B (2011) The amyloid cascade hypothesis for Alzheimer's disease: an appraisal for the development of therapeutics. Nature Publishing Group 10: 698–712 10.1038/nrd3505 - DOI - PubMed
    1. Quintero-Monzon O, Martin MM, Fernandez MA, Cappello CA, Krzysiak AJ, et al. (2011) Dissociation between the processivity and total activity of γ-secretase: implications for the mechanism of Alzheimer's disease-causing presenilin mutations. Biochemistry 50: 9023–9035 10.1021/bi2007146 - DOI - PMC - PubMed

Publication types

MeSH terms