

Generalized linear mixed models for binary data: are matching results from penalized quasi-likelihood and numerical integration less biased?
- PMID: 24416249
- PMCID: PMC3886992
- DOI: 10.1371/journal.pone.0084601
Generalized linear mixed models for binary data: are matching results from penalized quasi-likelihood and numerical integration less biased?
Abstract
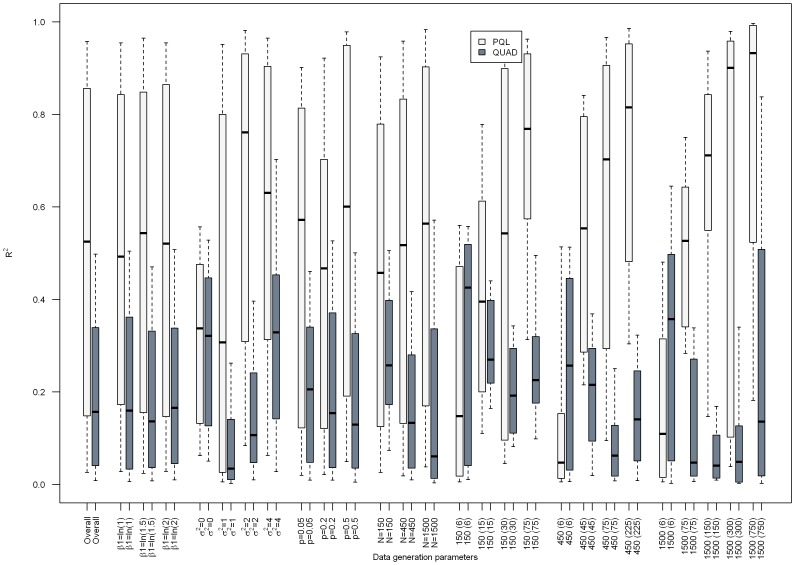
Background: Over time, adaptive Gaussian Hermite quadrature (QUAD) has become the preferred method for estimating generalized linear mixed models with binary outcomes. However, penalized quasi-likelihood (PQL) is still used frequently. In this work, we systematically evaluated whether matching results from PQL and QUAD indicate less bias in estimated regression coefficients and variance parameters via simulation.
Methods: We performed a simulation study in which we varied the size of the data set, probability of the outcome, variance of the random effect, number of clusters and number of subjects per cluster, etc. We estimated bias in the regression coefficients, odds ratios and variance parameters as estimated via PQL and QUAD. We ascertained if similarity of estimated regression coefficients, odds ratios and variance parameters predicted less bias.
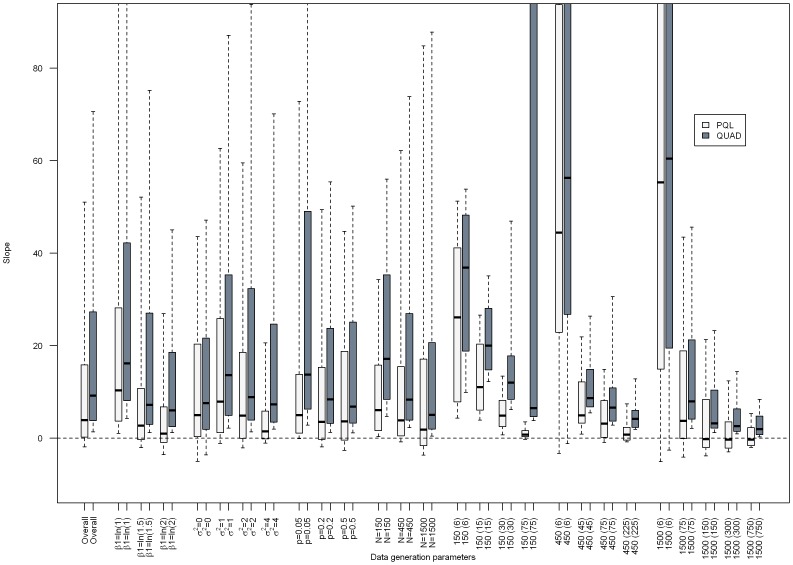
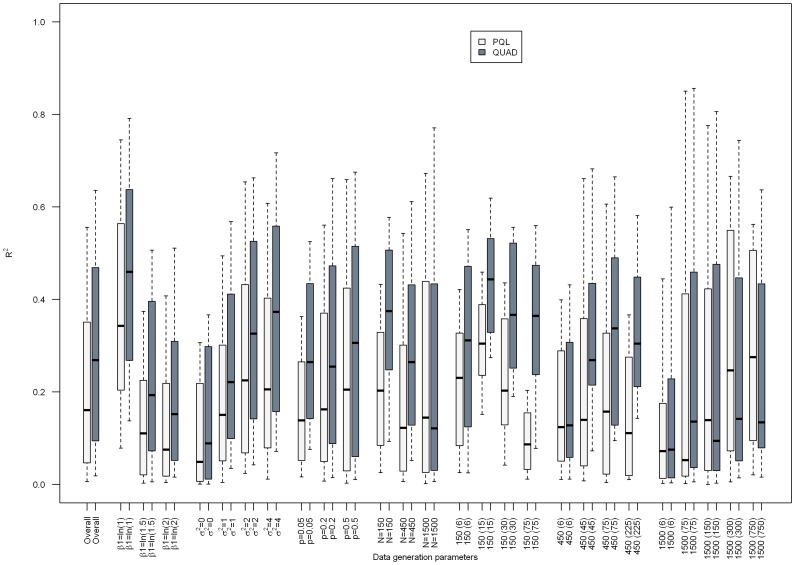
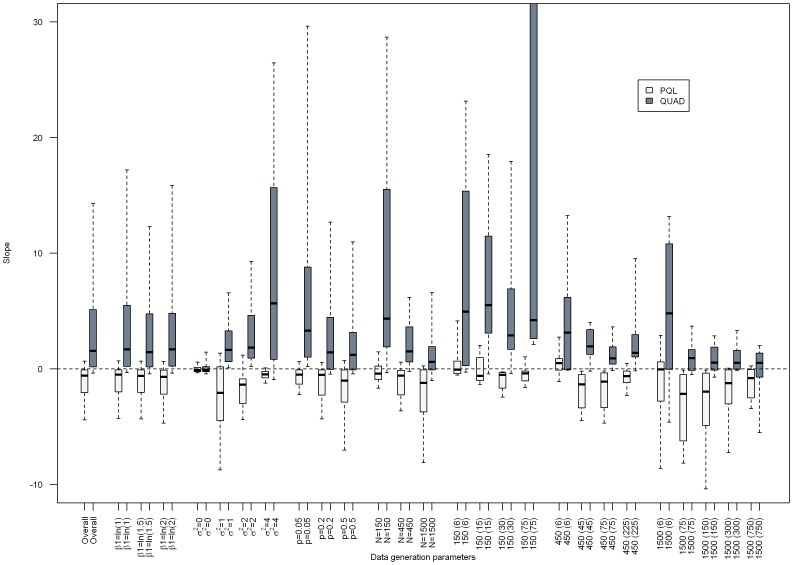
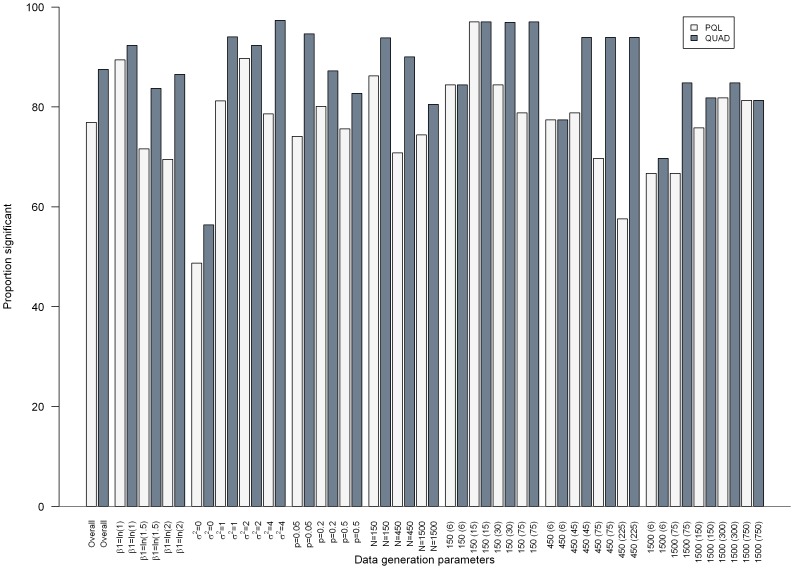
Results: Overall, we found that the absolute percent bias of the odds ratio estimated via PQL or QUAD increased as the PQL- and QUAD-estimated odds ratios became more discrepant, though results varied markedly depending on the characteristics of the dataset.
Conclusions: Given how markedly results varied depending on data set characteristics, specifying a rule above which indicated biased results proved impossible. This work suggests that comparing results from generalized linear mixed models estimated via PQL and QUAD is a worthwhile exercise for regression coefficients and variance components obtained via QUAD, in situations where PQL is known to give reasonable results.
Conflict of interest statement
Figures

Similar articles
-
A comparison of analytic approaches for individual patient data meta-analyses with binary outcomes.BMC Med Res Methodol. 2017 Feb 16;17(1):28. doi: 10.1186/s12874-017-0307-7. BMC Med Res Methodol. 2017. PMID: 28202011 Free PMC article.
-
Laplace approximation, penalized quasi-likelihood, and adaptive Gauss-Hermite quadrature for generalized linear mixed models: towards meta-analysis of binary outcome with sparse data.BMC Med Res Methodol. 2020 Jun 11;20(1):152. doi: 10.1186/s12874-020-01035-6. BMC Med Res Methodol. 2020. PMID: 32539721 Free PMC article.
-
An assessment of estimation methods for generalized linear mixed models with binary outcomes.Stat Med. 2013 Nov 20;32(26):4550-66. doi: 10.1002/sim.5866. Epub 2013 Jul 9. Stat Med. 2013. PMID: 23839712 Free PMC article.
-
Generalized linear mixed models for meta-analysis.Stat Med. 1999 Mar 30;18(6):643-54. doi: 10.1002/(sici)1097-0258(19990330)18:6<643::aid-sim76>3.0.co;2-m. Stat Med. 1999. PMID: 10204195 Review.
-
Mixed effects versus fixed effects modelling of binary data with inter-subject variability.J Pharmacokinet Pharmacodyn. 2005 Apr;32(2):245-60. doi: 10.1007/s10928-005-0045-z. Epub 2005 Nov 7. J Pharmacokinet Pharmacodyn. 2005. PMID: 16283537 Review.
Cited by
-
Association between dietary inflammatory index and mental disorders using multilevel modeling with GLIMMIX.Front Nutr. 2024 Jan 12;11:1288793. doi: 10.3389/fnut.2024.1288793. eCollection 2024. Front Nutr. 2024. PMID: 38282958 Free PMC article.
-
Intimate Partner Violence During COVID-19 Restrictions: A Study of 30 Countries From the I-SHARE Consortium.J Interpers Violence. 2023 Jun;38(11-12):7115-7142. doi: 10.1177/08862605221141865. Epub 2023 Jan 26. J Interpers Violence. 2023. PMID: 36703528 Free PMC article.
-
Evaluation of the Efficacy of Rotational Corrections for Standard-Fractionation Head and Neck Image-Guided Radiotherapy.Technol Cancer Res Treat. 2018 Jan-Dec;18:1533033819853824. doi: 10.1177/1533033819853824. Technol Cancer Res Treat. 2018. PMID: 31122178 Free PMC article. Clinical Trial.
-
A comparison of analytic approaches for individual patient data meta-analyses with binary outcomes.BMC Med Res Methodol. 2017 Feb 16;17(1):28. doi: 10.1186/s12874-017-0307-7. BMC Med Res Methodol. 2017. PMID: 28202011 Free PMC article.
-
Laplace approximation, penalized quasi-likelihood, and adaptive Gauss-Hermite quadrature for generalized linear mixed models: towards meta-analysis of binary outcome with sparse data.BMC Med Res Methodol. 2020 Jun 11;20(1):152. doi: 10.1186/s12874-020-01035-6. BMC Med Res Methodol. 2020. PMID: 32539721 Free PMC article.
References
-
- Molenberghs G, Verbeke G (2005) Models for Discrete Longitudinal Data. New York: Springer.
-
- Diggle P, Heagerty P, Liang K-Y, Zeger SL (2002) Analysis of Longitudinal Data. Oxford: Oxford University Press.
-
- Jang JY, Kang SK, Chung HK (1993) Biological exposure indices of organic solvents for Korean workers. International Archives of Occupational & Environmental Health 65: S219–S222 15. - PubMed
-
- Neuhaus JM, Kalbfleisch JD, Hauck WW (1991) A comparison of cluster-specific and population average approaches for analyzing correlated binary data. International Statistical Review 59: 25–35.
-
- Breslow N, Clayton D (1993) Approximate inference in generalized linear mixed models. J Am Stat Assoc 88: 9–25.
MeSH terms
LinkOut - more resources
Full Text Sources
Other Literature Sources
Medical
