

Urinary retinol binding protein is a marker of the extent of interstitial kidney fibrosis
- PMID: 24416268
- PMCID: PMC3885590
- DOI: 10.1371/journal.pone.0084708
Urinary retinol binding protein is a marker of the extent of interstitial kidney fibrosis
Abstract
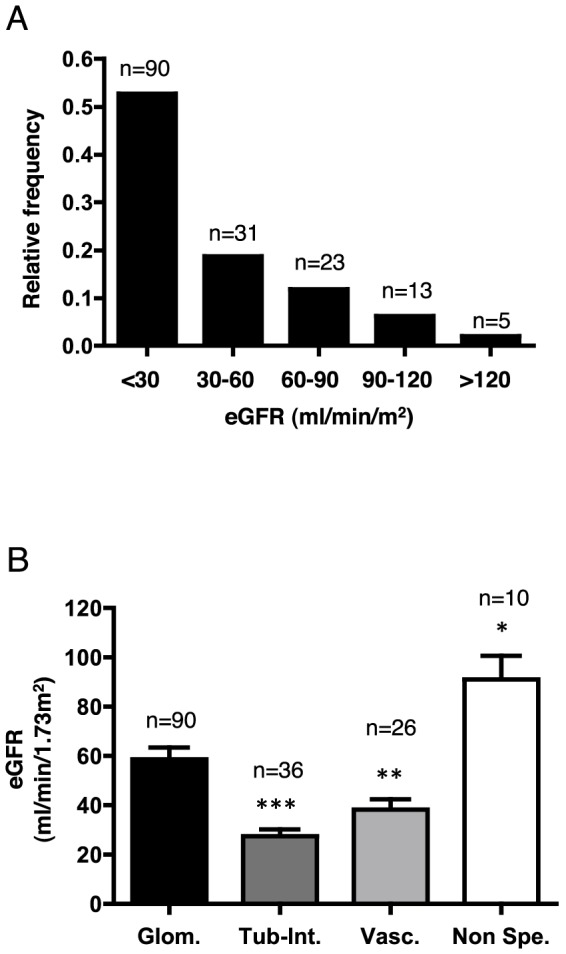
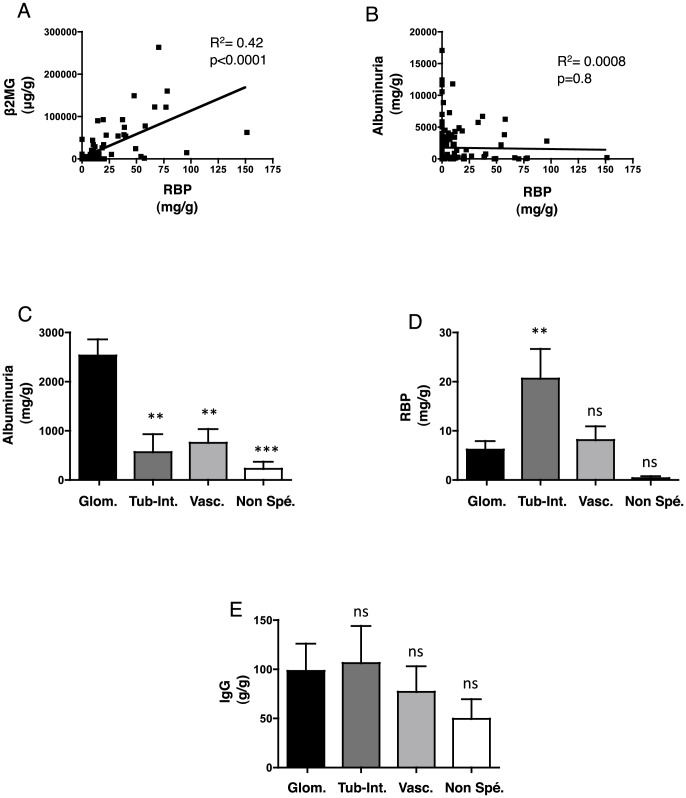
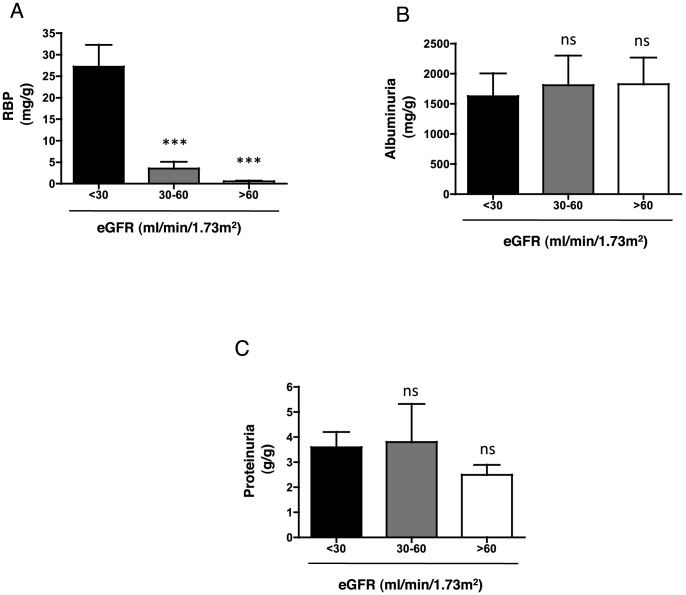
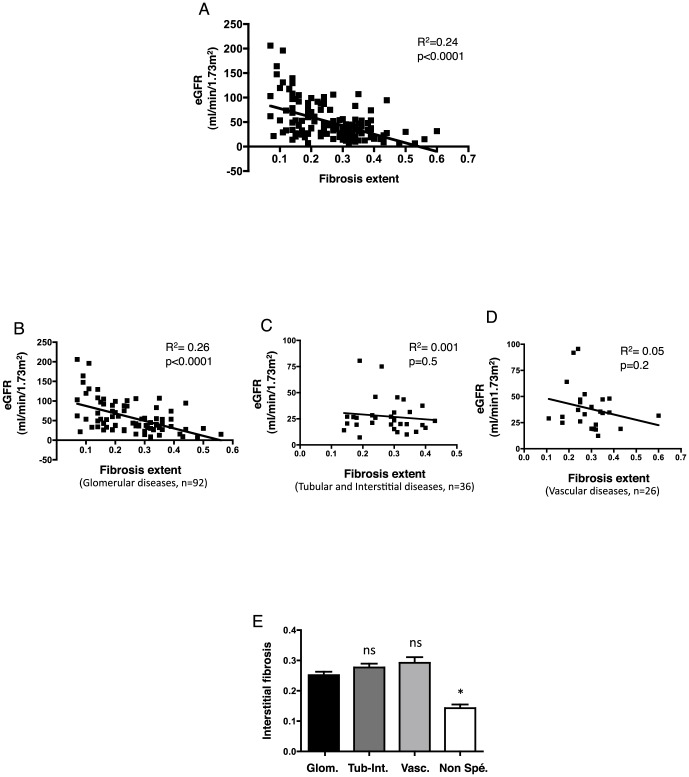
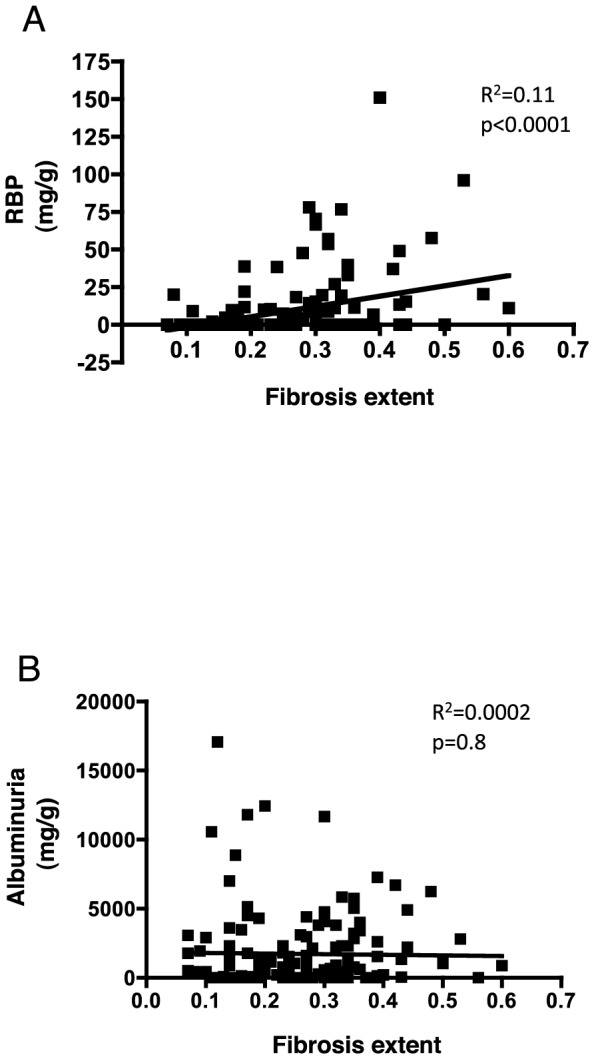
Currently, a non-invasive method to estimate the degree of interstitial fibrosis (IF) in chronic kidney disease is not available in routine. The aim of our study was to evaluate the diagnostic performance of the measurement of urinary low molecular weight (LMW) protein concentrations as a method to determine the extent of IF. The urines specimen from 162 consecutive patients who underwent renal biopsy were used in the analysis. Numerical quantification software based on the colorimetric analysis of fibrous areas was used to assess the percentage IF. Total proteinuria, albuminuria, and the urinary levels of retinol binding protein (RBP), alpha1-microglobulin (α1MG), beta 2-microglobulin (β2MG), transferrin, and IgG immunoglobulins were measured. There was a significant correlation between the degree of IF and the RBP/creatinine (creat) ratio (R2: 0.11, p<0.0001). IF was associated to a lesser extent with urinary β2MG and α1MG; however, there was no association with total proteinuria or high molecular weight (HMW) proteinuria. The correlation between IF and RBP/creat remained significant after adjustment to the estimated glomerular filtration rate, age, body mass index, α1MG, and β2MG. The specificity of the test for diagnosing a fibrosis score of >25% of the parenchyma was 95% when using a threshold of 20 mg/g creat. In conclusion, RBP appears to be a quantitative and non-invasive marker for the independent prediction of the extent of kidney IF. Because methods for the measurement of urinary RBP are available in most clinical chemistry departments, RBP measurement is appealing for implementation in the routine care of patients with chronic kidney disease.
Conflict of interest statement
Figures
Similar articles
-
Cystatin C, beta 2-microglobulin, and retinol-binding protein as indicators of glomerular filtration rate: comparison with plasma creatinine.J Pharm Biomed Anal. 2001 Mar;24(5-6):835-42. doi: 10.1016/s0731-7085(00)00550-1. J Pharm Biomed Anal. 2001. PMID: 11248475
-
Urinary Tamm-Horsfall protein, albumin, vitamin D-binding protein, and retinol-binding protein as early biomarkers of chronic kidney disease in dogs.Physiol Rep. 2017 Jun;5(11):e13262. doi: 10.14814/phy2.13262. Physiol Rep. 2017. PMID: 28576851 Free PMC article.
-
Urinary α 1-microglobulin and β 2-microglobulin as markers of early kidney injury in HIV-positive male patients on tenofovir-based antiretroviral therapy.PLoS One. 2024 Jun 17;19(6):e0303442. doi: 10.1371/journal.pone.0303442. eCollection 2024. PLoS One. 2024. PMID: 38885284 Free PMC article.
-
Urinary retinol-binding protein as a risk factor of poor prognosis in acute-on-chronic renal injury.J Nephrol. 2016 Dec;29(6):827-833. doi: 10.1007/s40620-016-0331-4. Epub 2016 Jul 7. J Nephrol. 2016. PMID: 27387426
-
Low molecular weight proteins in children with renal disease.Pediatr Nephrol. 1992 Nov;6(6):565-71. doi: 10.1007/BF00866510. Pediatr Nephrol. 1992. PMID: 1282825 Review.
Cited by
-
New risk score for predicting steroid resistance in patients with focal segmental glomerulosclerosis or minimal change disease.Clin Proteomics. 2020 May 29;17:18. doi: 10.1186/s12014-020-09282-x. eCollection 2020. Clin Proteomics. 2020. PMID: 32514258 Free PMC article.
-
Urine β2-Microglobulin and Retinol-Binding Protein and Renal Disease Progression in IgA Nephropathy.Front Med (Lausanne). 2021 Dec 22;8:792782. doi: 10.3389/fmed.2021.792782. eCollection 2021. Front Med (Lausanne). 2021. PMID: 35004762 Free PMC article.
-
Urinary Retinol-Binding Protein: Relationship to Renal Function and Cardiovascular Risk Factors in Chronic Kidney Disease.PLoS One. 2016 Sep 21;11(9):e0162782. doi: 10.1371/journal.pone.0162782. eCollection 2016. PLoS One. 2016. PMID: 27655369 Free PMC article.
-
Tubular dysfunction in extremely low birth weight survivors.Clin Exp Nephrol. 2019 Mar;23(3):395-401. doi: 10.1007/s10157-018-1645-4. Epub 2018 Sep 20. Clin Exp Nephrol. 2019. PMID: 30238383
-
Biomarkers for the detection of renal fibrosis and prediction of renal outcomes: a systematic review.BMC Nephrol. 2017 Feb 20;18(1):72. doi: 10.1186/s12882-017-0490-0. BMC Nephrol. 2017. PMID: 28219345 Free PMC article.
References
-
- Zeisberg M, Neilson EG (2010) Mechanisms of tubulointerstitial fibrosis. J Am Soc Nephrol 21: 1819–1834. - PubMed
-
- Roberts IS, Cook HT, Troyanov S, Alpers CE, Amore A, et al. (2009) The Oxford classification of IgA nephropathy: pathology definitions, correlations, and reproducibility. Kidney Int 76: 546–556. - PubMed
-
- Cattran DC, Coppo R, Cook HT, Feehally J, Roberts IS, et al. (2009) The Oxford classification of IgA nephropathy: rationale, clinicopathological correlations, and classification. Kidney Int 76: 534–545. - PubMed
MeSH terms
Substances
LinkOut - more resources
Full Text Sources
Other Literature Sources
Research Materials
Miscellaneous
