. 2014 Jan 9;9(1):e85274.
doi: 10.1371/journal.pone.0085274. eCollection 2014.

Transgenic expression of microRNA-181d augments the stress-sensitivity of CD4(+)CD8(+) thymocytes

Affiliations

Transgenic expression of microRNA-181d augments the stress-sensitivity of CD4(+)CD8(+) thymocytes

Serkan Belkaya et al. PLoS One. .

Abstract

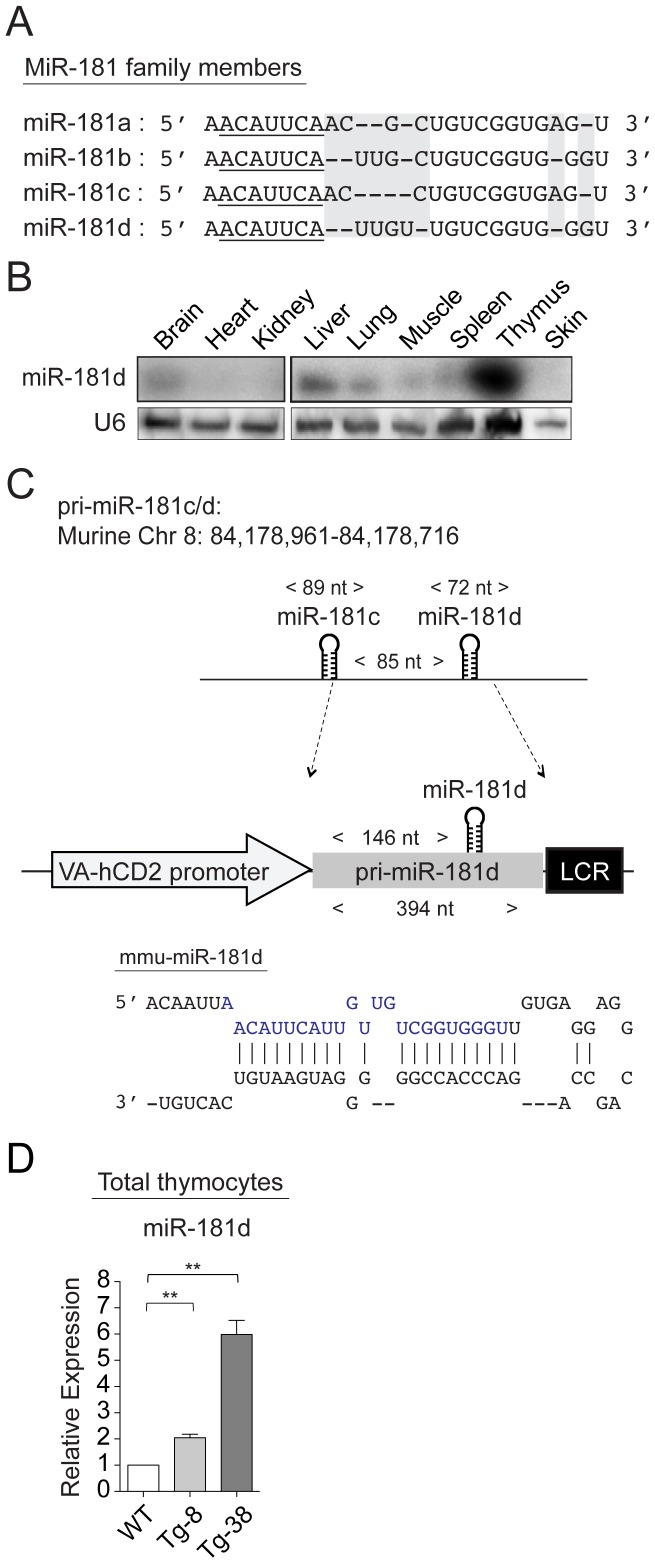
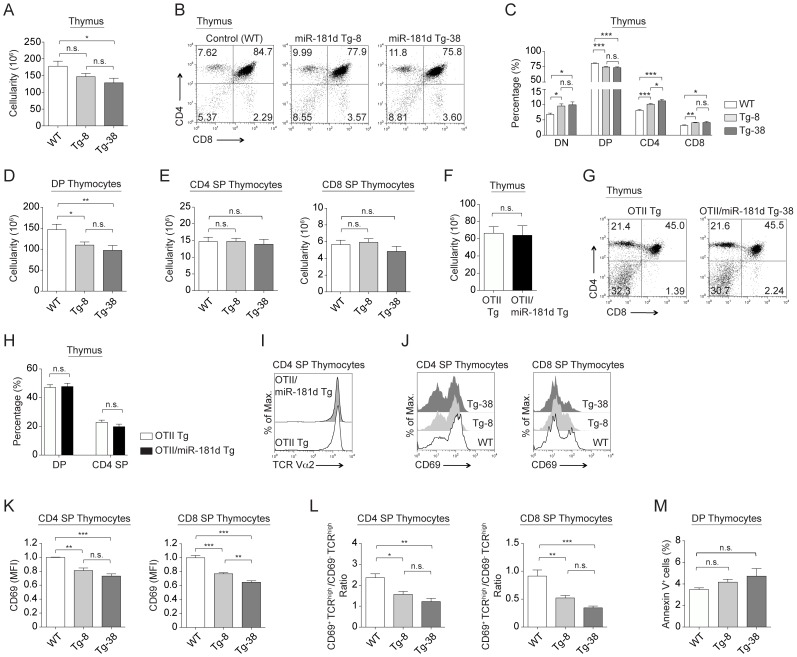
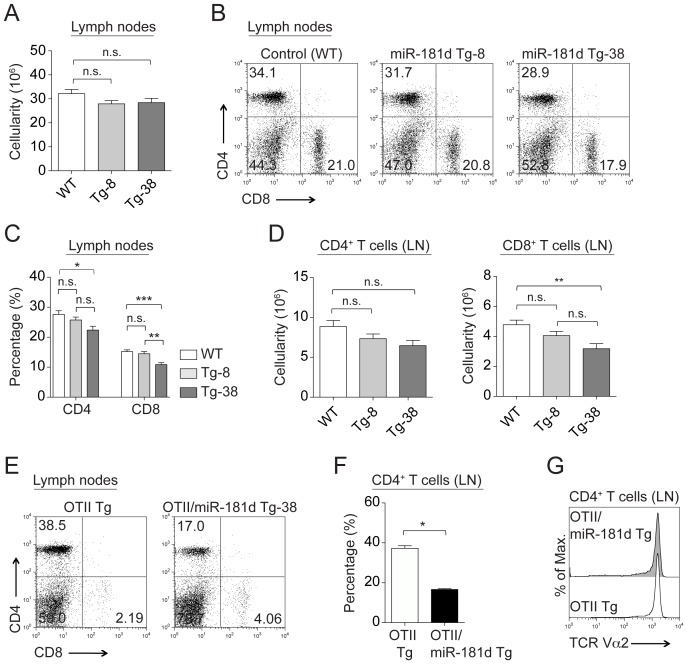
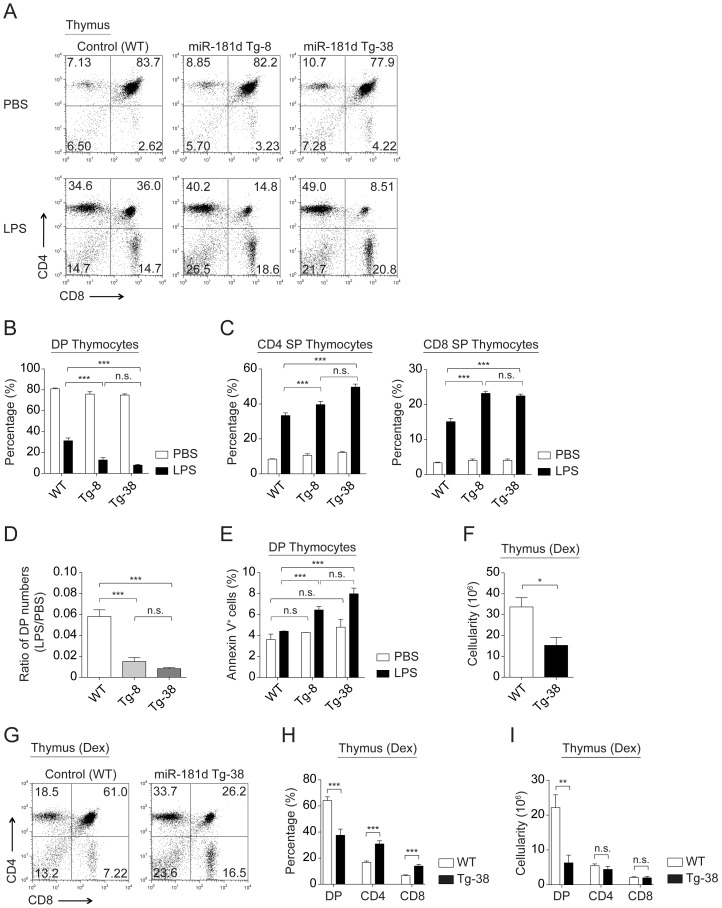
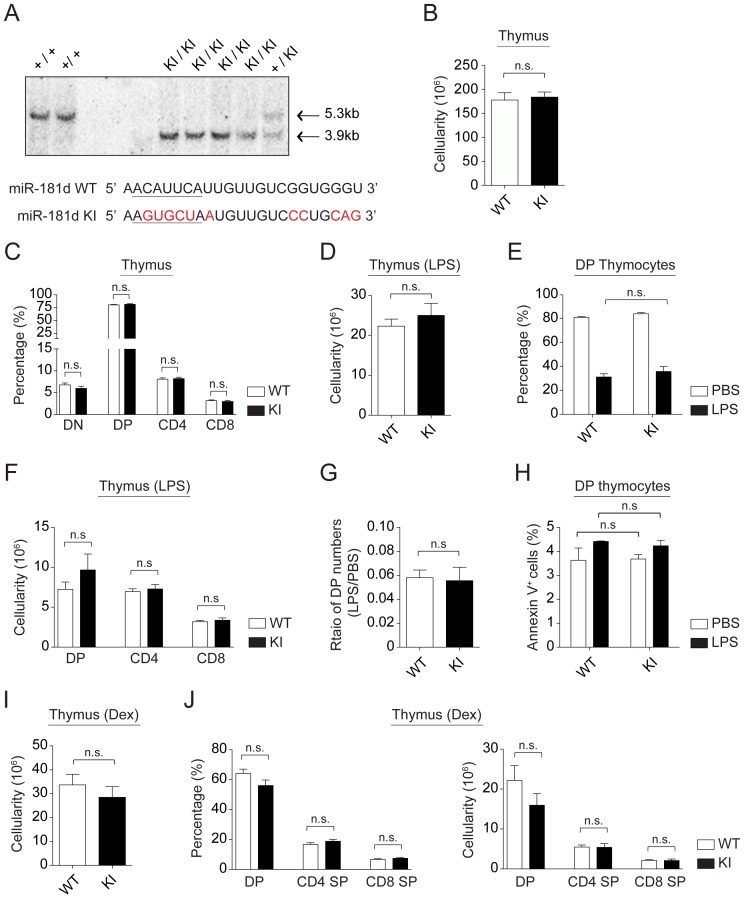
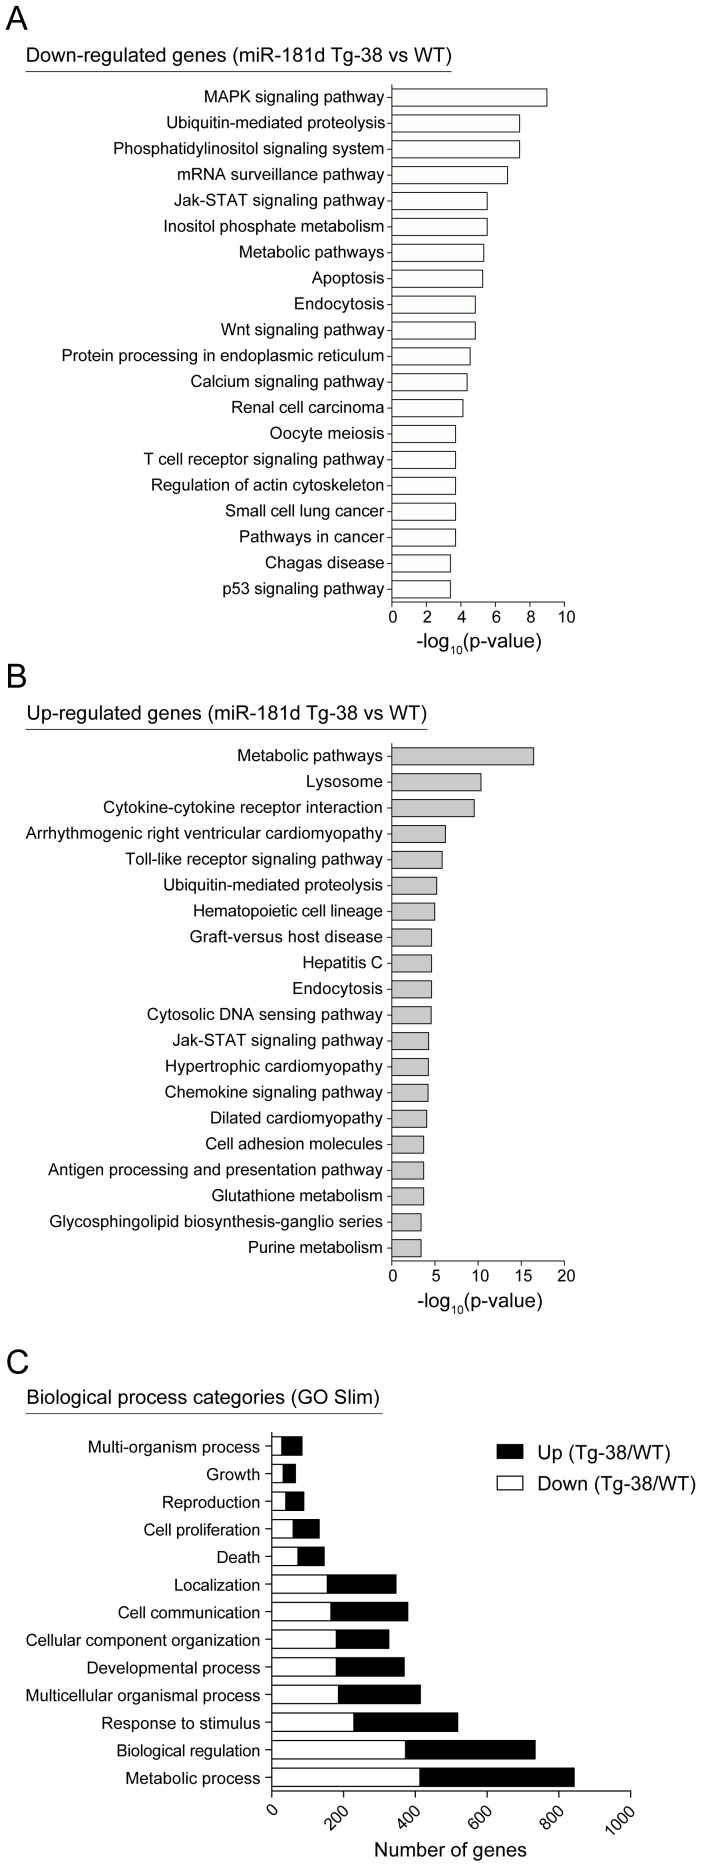
Physiological stress resulting from infections, trauma, surgery, alcoholism, malnutrition, and/or pregnancy results in a substantial depletion of immature CD4(+)CD8(+) thymocytes. We previously identified 18 distinct stress-responsive microRNAs (miRs) in the thymus upon systemic stress induced by lipopolysaccharide (LPS) or the synthetic glucocorticoid, dexamethasone (Dex). MiRs are short, non-coding RNAs that play critical roles in the immune system by targeting diverse mRNAs, suggesting that their modulation in the thymus in response to stress could impact thymopoiesis. MiR-181d is one such stress-responsive miR, exhibiting a 15-fold down-regulation in expression. We utilized both transgenic and gene-targeting approaches to study the impact of miR-181d on thymopoiesis under normal and stress conditions. The over-expression of miR-181d in developing thymocytes reduced the total number of immature CD4(+)CD8(+) thymocytes. LPS or Dex injections caused a 4-fold greater loss of these cells when compared with the wild type controls. A knockout mouse was developed to selectively eliminate miR-181d, leaving the closely spaced and contiguous family member miR-181c intact. The targeted elimination of just miR-181d resulted in a thymus stress-responsiveness similar to wild-type mice. These experiments suggest that one or more of three other miR-181 family members have overlapping or compensatory functions. Gene expression comparisons of thymocytes from the wild type versus transgenic mice indicated that miR-181d targets a number of stress, metabolic, and signaling pathways. These findings demonstrate that selected miRs enhance stress-mediated thymic involution in vivo.


Conflict of interest statement

Competing Interests: The authors have declared that no competing interests exist.

Figures

Figure 1
Figure 1. MiR-181d transgenic mice.
(A) Schematic shows the sequence homology between mature miR-181 family members. 5′-seed region is underlined. Base differences are shaded with gray. (B) MiR-181d expression in various tissues examined by Northern blotting. U6 probe was used as the endogenous control. (C) Cloning of the pri-miR-181d into the VA-hCD2 transgenic cassette. Stem-loop structure of pre-miR-181d is shown, in which mature miR-181d is highlighted in blue. (D) Relative miR-181d levels were determined by real-time quantitative PCR. Littermate control values were set to 1. Graph represents the mean fold changes +/− SEM normalized to the U6 levels from 3 independent samples, performed in triplicates (n.s.  =  non-significant, *p<0.05, **p<0.01, ***p<0.001; Two-tailed unpaired Student's t-test).
Figure 2
Figure 2. MiR-181d over-expression reduces the number of DP thymocytes.
(A) Total thymus cellularity in the control and miR-181d Tg mice. (B) Representative plots show CD4 by CD8 profiles of thymocytes in the control and miR-181d Tg mice, analyzed by FACS. (C) Average percentages of thymocyte subsets (DN, DP, CD4 SP, and CD8 SP) from the control and miR-181d Tg mice. (D) Absolute cell numbers of DP thymocytes. (E) Absolute cell numbers of CD4 SP (left) and CD8 SP (right) thymocytes. (A–E) Data are from WT (n = 18), Tg-8 (n = 25), and Tg-38 (n = 16) mice. (F) Total thymus cellularity of the OTII Tg and OTII/miR-181d Tg-38 mice. (G) Total thymocytes were stained for CD4 and CD8, and analyzed by FACS. (H) Average percentages of DP and CD4 SP thymocytes are shown. (I) Histogram shows the surface expression of TCR (TCR Vα2) gated on CD4+CD8 SP thymocytes from the OTII Tg (dark gray) and OTII/miR-181d Tg-38 mice (black line). (F–I) Data are from at least 2 mice per group. Each bar is the mean +/− SEM (n.s.  =  non-significant, *p<0.05, **p<0.01, ***p<0.001; Two-tailed unpaired Student's t-test). (J) Histograms show CD69 expression on CD4 SP and CD8 SP thymocytes from the WT (white), Tg-8 (light gray), and Tg-38 (dark gray) mice. (K) Relative MFI (Mean Fluorescence Intensity) levels of CD69 on SP thymocytes. (L) Ratio of the CD69+TCRβhigh to CD69TCRβhigh thymocyte numbers shown for CD4 SP and CD8 SP thymocytes. (M) Average percentages of Annexin V+ cells gated on DP thymocytes. (J-M) Data are of at least 3 mice per group. All bar graphs represent the mean +/− SEM values (n.s.  =  non-significant, *p<0.05, **p<0.01, ***p<0.001; One-way ANOVA followed by Tukey's post-hoc test).
Figure 3
Figure 3. Characterization of peripheral lymphocytes in miR-181d transgenic mice.
(A) Total cellularity in the lymph nodes of the control and miR-181d Tg mice. (B) Representative FACS plots of CD4+ and CD8+ T cells in the lymph nodes. (C–D) Average percentages (C) and absolute numbers (D) of CD4+ and CD8+ T cells in the lymph nodes. (A–D) Data are of the mean +/− SEM from the WT (n = 17), Tg-8 (n = 23), and Tg-38 (n = 14) mice (n.s.  =  non-significant, *p<0.05, **p<0.01, ***p<0.001; One-way ANOVA followed by Tukey's post-hoc test). (E) CD4 and CD8 profiles of peripheral T cells from the lymph nodes of the OTII Tg and OTII/miR-181d Tg-38 mice. (F) Bar graph shows average percentages of CD4+ T lymphocytes in the lymph nodes. (G) Surface expression of TCR (TCR Vα2) gated on CD4+ T cells in the lymph nodes of the OTII Tg (dark gray) and OTII/miR-181d Tg-38 mice (black line). (E–G) Data are generated from at least 2 mice per group. Each bar represents the mean +/− SEM values (*p<0.05, **p<0.01, ***p<0.001; Two-tailed unpaired Student's t-test).
Figure 4
Figure 4. MiR-181d over-expression elevates stress-induced thymic atrophy.
(A) Representative plots show CD4 by CD8 profiles of total thymocytes from the control and miR-181d Tg mice at 72 hours after PBS or LPS (100 µg/mouse) injections. (B–C) Graphs demonstrate the average percentages of DP thymocytes (B), and CD4 SP and CD8 SP thymocytes (C) at 72 hours post-injection (PBS, white; LPS, black). (B–C) Data are of the mean +/− SEM from at least 4 independent experiments using at least 3 mice per injection (n.s.  =  non-significant, *p<0.05, **p<0.01, ***p<0.001; Two-way ANOVA followed by Bonferroni's post-hoc test). (D–E) Data were calculated from the experiments shown in the panels A and B. Each bar shows the mean +/− SEM. (D) Ratios of DP thymocyte numbers upon LPS treatment to the numbers of DP thymocytes upon PBS treatment (n.s.  =  non-significant, *p<0.05, **p<0.01, ***p<0.001; One-way ANOVA followed by Tukey's post-hoc test). (E) Average percentages of Annexin V+ cells gated on DP thymocytes at 72 hours post-injection (PBS, white; LPS, black). (n.s.  =  non-significant, *p<0.05, **p<0.01, ***p<0.001; Two-way ANOVA followed by Bonferroni's post-hoc test). (F) Total thymic cellularity in the control and miR-181d Tg-38 mice at 48 hours upon Dex injection (60 µg/mouse). (G) Representative FACS plots show CD4 by CD8 profiles of thymocytes after 48 hours post-Dex injection. (H–I) Average percentages (H) and absolute numbers (I) of thymocyte subsets following Dex treatment at 48 hours. (F–I) Bar graphs show the mean +/− SEM from at least 4 mice per treatment (n.s.  =  non-significant, *p<0.05, **p<0.01, ***p<0.001; Two-tailed unpaired Student's t-test).
Figure 5
Figure 5. T cell development is normal in miR-181d knock-in mice.
(A) Confirmation of miR-181d KI by a representative southern blot. Comparison of the wild type and mutated (miR-181d KI) sequences are provided. 5′-seed region is underlined. Base replacements are highlighted in red. (B) Total thymus cellularity in the control and miR-181d KI mice. (C) Average percentages of thymocyte subsets (DN, DP, CD4 SP, and CD8 SP) are shown for the WT (white) and miR-181d KI (black) mice. (B–C) Data are of the mean +/− SEM from the WT (n = 18) and miR-181d KI (n = 17) mice. (D) Total thymus cellularity in the control and miR-181d KI mice at 72 hours post-LPS (100 µg/mouse) injection (n.s.  =  non-significant; Two-tailed unpaired Student's t-test). (E) Average percentages of DP thymocytes at 72 hours after PBS or LPS treatment (n.s.  =  non-significant; Two-way ANOVA followed by Bonferroni's post-hoc test). (F) Absolute cell numbers of thymocyte subsets at 72 hours post-LPS injection (n.s.  =  non-significant; Two-tailed unpaired Student's t-test). (D–F) Data show the mean +/− SEM at least 4 independent experiments using at least 3 mice per treatment. (G–H) Data were calculated from the experiments shown in the panels D and E. Each bar shows the mean +/− SEM. (G) Ratios of DP thymocyte numbers upon LPS treatment to the numbers of DP thymocytes upon PBS treatment (n.s.  =  non-significant; Two-tailed unpaired Student's t-test). (H) Average percentages of Annexin V+ cells gated on DP thymocytes at 72 hours post-injection (PBS, white; LPS, black). (n.s.  =  non-significant; Two-way ANOVA followed by Bonferroni's post-hoc test). (I) Total thymic cellularity in the control and miR-181d KI mice at 48 hours upon Dex injection (60 µg/mouse). (J) Average percentages (left) and absolute numbers (right) of thymocyte subsets following Dex treatment at 48 hours. (I–J) Bar graphs show the mean +/− SEM from at least 4 mice per treatment (n.s.  =  non-significant; Two-tailed unpaired Student's t-test).
Figure 6
Figure 6. KEGG pathway and Gene ontology analyses of differentially regulated genes in miR-181d transgenic thymocytes.
(A–B) Top 20 over-represented KEGG pathways are shown based on the statistical significance for down-regulated (A) and up-regulated genes (B) with more than 1.2-fold (p<0.05) in the miR-181d Tg-38 thymocytes compared to the wild type control. Pathway enrichment analysis was performed using the Web-based Gene Set Analysis Toolkit. (C) Biological process categories over-represented within the dysregulated genes are shown. White and black bars are of down- and up-regulated genes in the miR-181d Tg-38 thymocytes, respectively. Gene ontology Slim (GO Slim) analysis was performed using the Web-based Gene Set Analysis Toolkit.

Similar articles

Cited by

References

    1. Ageev AK, Sidorin VS, Rogachev MV, Timofeev IV (1986) [Morphologic characteristics of the changes in the thymus and spleen in alcoholism]. Arkh Patol 48: 33–39. - PubMed
    1. Douek DC, McFarland RD, Keiser PH, Gage EA, Massey JM, et al. (1998) Changes in thymic function with age and during the treatment of HIV infection. Nature 396: 690–695. - PubMed
    1. Haynes BF, Markert ML, Sempowski GD, Patel DD, Hale LP (2000) The role of the thymus in immune reconstitution in aging, bone marrow transplantation, and HIV-1 infection. Annu Rev Immunol 18: 529–560. - PubMed
    1. Hotchkiss RS, Swanson PE, Freeman BD, Tinsley KW, Cobb JP, et al. (1999) Apoptotic cell death in patients with sepsis, shock, and multiple organ dysfunction. Crit Care Med 27: 1230–1251. - PubMed
    1. Muller-Hermelink HK, Sale GE, Borisch B, Storb R (1987) Pathology of the thymus after allogeneic bone marrow transplantation in man. A histologic immunohistochemical study of 36 patients. Am J Pathol 129: 242–256. - PMC - PubMed

Publication types

MeSH terms