. 2014 Jan 8;9(1):e85418.
doi: 10.1371/journal.pone.0085418. eCollection 2014.

Ist2 in the yeast cortical endoplasmic reticulum promotes trafficking of the amino acid transporter Bap2 to the plasma membrane

Affiliations

Ist2 in the yeast cortical endoplasmic reticulum promotes trafficking of the amino acid transporter Bap2 to the plasma membrane

Wendelin Wolf et al. PLoS One. .

Abstract

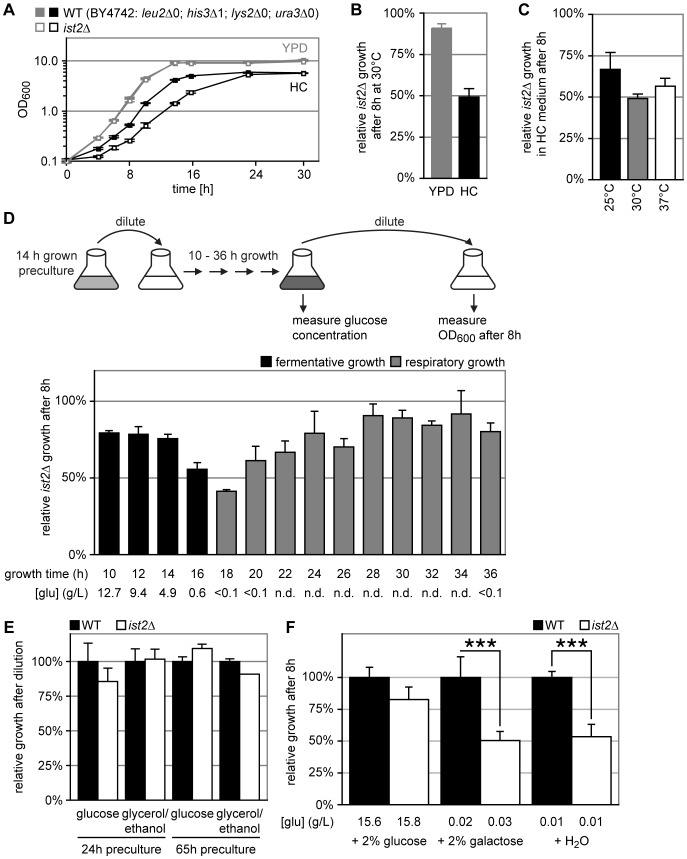
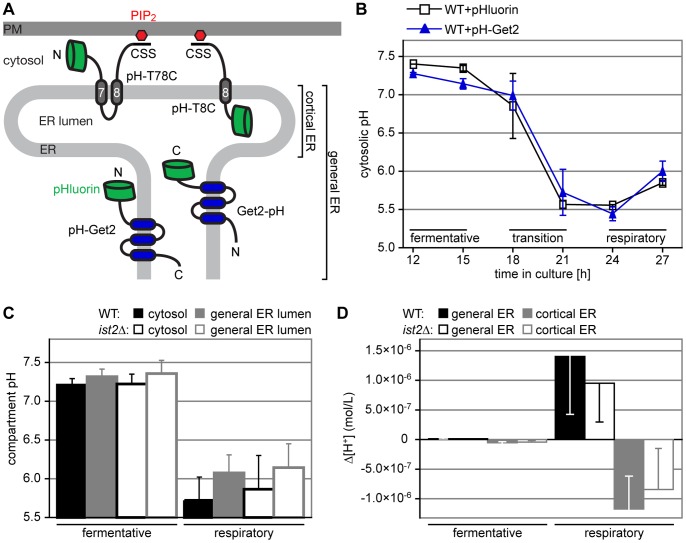
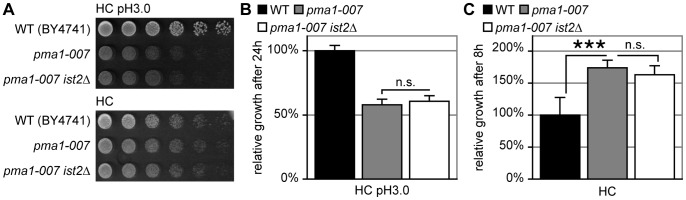
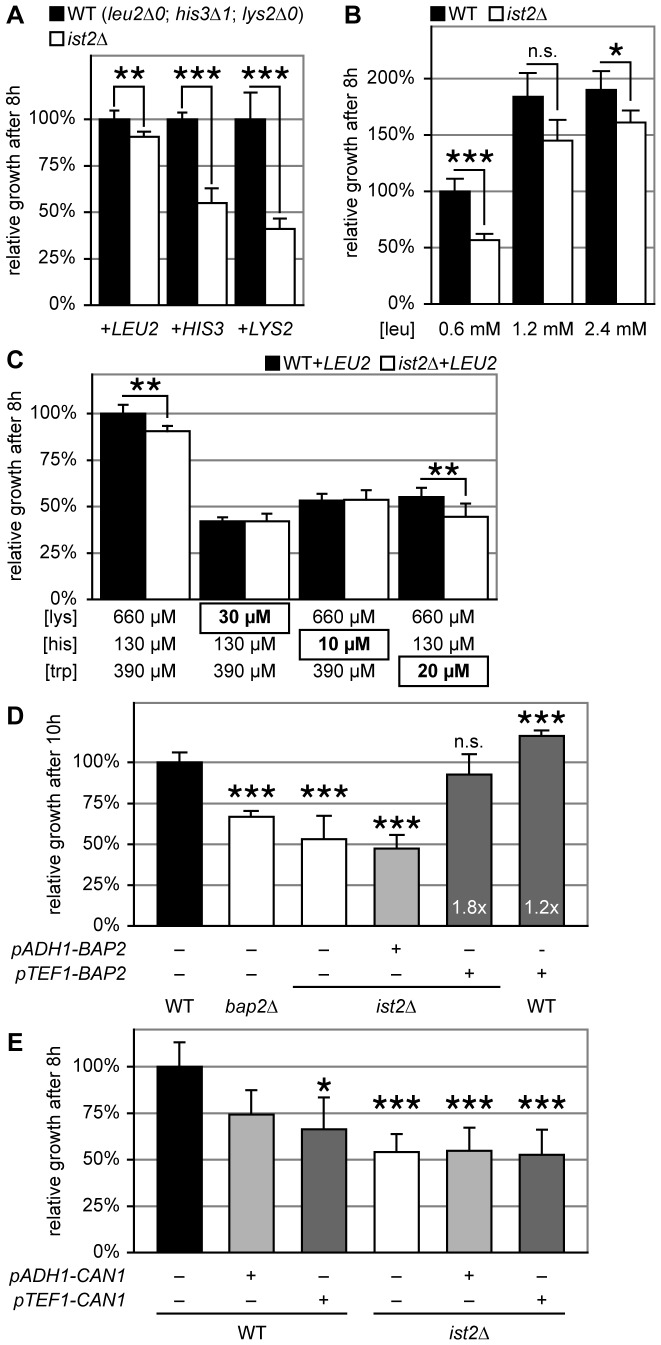
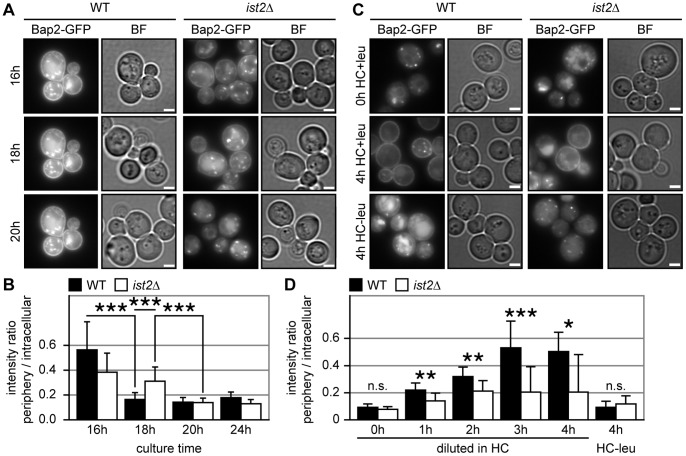
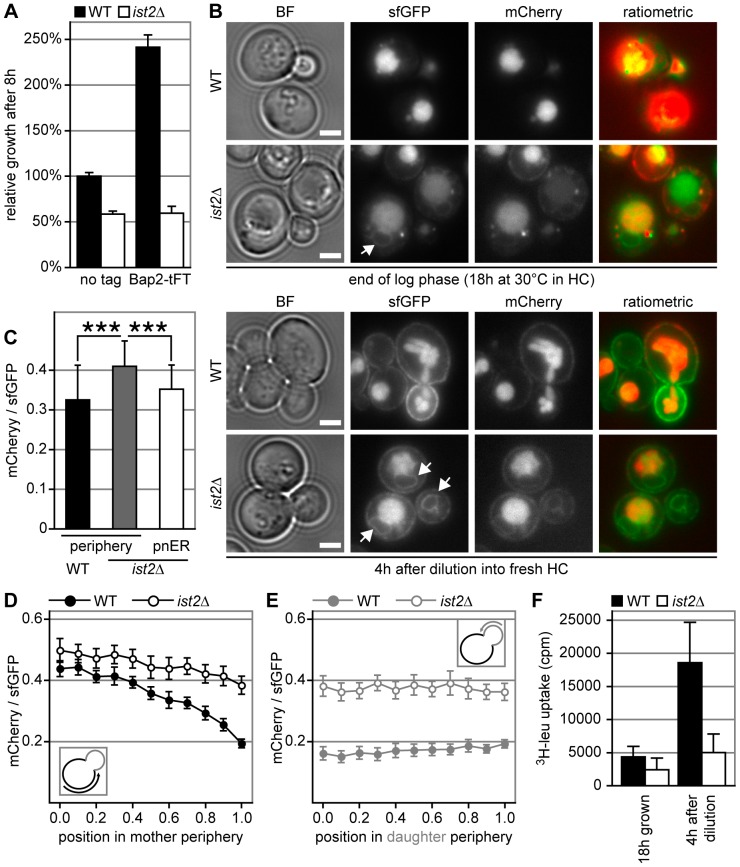
The equipment of the plasma membrane in Saccharomyces cerevisiae with specific nutrient transporters is highly regulated by transcription, translation and protein trafficking allowing growth in changing environments. The activity of these transporters depends on a H(+) gradient across the plasma membrane generated by the H(+)-ATPase Pma1. We found that the polytopic membrane protein Ist2 in the cortical endoplasmic reticulum (ER) is required for efficient leucine uptake during the transition from fermentation to respiration. Experiments employing tandem fluorescence timer protein tag showed that Ist2 was necessary for efficient trafficking of newly synthesized leucine transporter Bap2 from the ER to the plasma membrane. This finding explains the growth defect of ist2Δ mutants during nutritional challenges and illustrates the important role of physical coupling between cortical ER and plasma membrane.


Conflict of interest statement

Competing Interests: The authors have declared that no competing interests exist.

Figures

Figure 1
Figure 1. Transition from fermentation to respiration is impaired in ist2Δ.
(A) WT (BY4742 = leu2Δ0, his3Δ1, lys2Δ0, ura3Δ0; closed squares) and ist2Δ (open squares) cells were grown in YPD (grey) or HC (black) media at 30°C. Cells were diluted to 0.1 OD600 from pre-cultures grown in HC for 24 hours at 25°C. (B) Growth of ist2Δ cells relative to WT ( = 100%) 8 h after dilution into YPD (grey) and HC (black) media. (C) Growth of ist2Δ cells relative to WT ( = 100%) at 25°C (black), 30°C (grey) or 37°C (white) 8 h after dilution into HC medium. (D) WT and ist2Δ cells were pre-cultured for 14 hours in HC medium to 2.60±0.94 and 3.50±0.94 OD600, respectively and inoculated to 0.1 OD600 into fresh HC medium. At the indicated time points the glucose concentration (g/L) of the medium was determined. Additionally, cells were diluted to 0.1 OD600 into fresh HC medium, grown for 8 hours and relative growth of ist2Δ cells was determined (see cartoon for overview; pc: pre-culture). Growth phase was classified as respiratory (grey) when media glucose concentration was <0.1 g/L. Error bars indicate s.d.m., n = 3. (E) WT (black) and ist2Δ (white) cells were grown in HC media containing 3% glycerol and 2% ethanol as sole carbon source for 24 hours to 2.4±0.7 and 2.4±0.7 OD600 or for 65 hours to 10.9±0.7 and 11.2±0.3 OD600, respectively. Cells were diluted to 0.1 OD600 into fresh HC media containing 2% glucose or 3% glycerol and 2% ethanol and grown for 8 hours. OD600 was normalized to the respective WT and is shown as mean+s.d.m. (n = 6 for 24 hours pre-cultures and n = 3 for 65 hours pre-cultures). (F) WT and ist2Δ cells were grown in HC medium with 2% glucose for 18 hours until glucose depletion. Cultures were supplemented with 2% glucose, 2% galactose or mock treated with water for 30 min and diluted to 0.1 OD600 into HC medium containing 2% glucose and grown for 8 hours. OD600 was normalized to the respective WT. Error bars indicate s.d.m (n ≥5). The glucose concentration was measured after 30 min of treatment. Triple asterisks indicate significance of p<0.001 (unpaired, two-tailed student’s t-test).
Figure 2
Figure 2. H+ gradients across the ER membrane depend on transition to respiration.
(A) Cartoon illustrating the localization of compartment-specific pH probes. pH-T78C and pH-T8C exclusively localize to the cortical ER while Get2-pH and pH-Get2 localize to the general ER. (B) In vivo measurement of cytosolic pH in cells grown for 12 to 27 hours in HC medium lacking leucine. Growth phases (fermentative, transition and respiratory) are indicated. WT cells expressing pHluorin (black squares) or pH-Get2 (blue triangles) were analyzed by flow cytometry. Error bars indicate s.d.m. (n = 2). (C) pH in the cytosol (black) and general ER lumen (grey) of WT (filled bars) and ist2Δ (open bars) cells expressing pH-Get2 and Get2-pH under fermentative and respiratory conditions. Error bars indicate s.d.m. (n = 4). (D) H+ gradients (mol/L) between cytosol and lumen of the general (black) or cortical (grey) ER in WT (filled bars) and ist2Δ (open bars) cells under fermentative and respiratory conditions. The H+ concentrations of general and cortical ER cells were determined in cells expressing Get2-pH and pH-T8C, respectively. Cytosolic H+ concentrations in the vicinity of general and cortical ER were determined in cells expressing pH-Get2 and pH-T7C, respectively. Error bars indicate s.d.m. (n = 4).
Figure 3
Figure 3. Impaired function of Pma1 does not contribute to the ist2Δ growth delay.
(A) WT (BY4741), pma1-007 and pma1-007 ist2Δ cells were grown to mid log phase and spotted on HC and HC plates buffered to pH 3.0. Cells were spotted in five-fold serial dilutions starting from 2.0 OD600. (B) Relative growth of WT (black), pma1-007 (grey) and pma1-007 ist2Δ (white) cells. Cells were pre-cultured in HC medium for 18 hours, diluted to 0.1 OD600 into fresh HC medium buffered to pH 3.0 and grown for 24 hours. OD600 was normalized to WT. (C) As in B but cells were diluted into unbuffered HC media with a pH of 4.65 and grown for 8 hours. Error bars indicate s.d.m. (n = 9).
Figure 4
Figure 4. Leucine uptake is impaired in ist2Δ.
(A) Relative growth of WT (black) and ist2Δ (white) strains transformed with CEN plasmids encoding the LEU2, HIS3 or LYS2 gene. Pre-cultures grown in HC-leu, HC-his or HC-lys media for 18 hours were diluted to 0.1 OD600 into fresh HC media and grown for 8 hours. OD600 of transformed ist2Δ strains were normalized to the respective WT strains. Error bars indicate s.d.m. (n ≥6). (B) Relative growth of WT and ist2Δ strains in HC media with the indicated leucine concentration. Note that the leu concentration of standard HC medium is 0.6 mM. Pre-cultures grown in HC medium for 18 hours were diluted to 0.1 OD600 into fresh media and grown for 8 hours. OD600 were normalized to WT grown in standard HC media. Error bars indicate s.d.m. (n = 6). (C) Relative growth of WT and ist2Δ strains transformed with LEU2-encoding CEN plasmids at limiting lysine (30 µM), histidine (10 µM) and tryptophane (20 µM) concentrations. Pre-cultures grown in HC-leu for 18 hours were diluted to 0.1 OD600 into fresh HC-leu media with the indicated lysine, histidine and tryptophane concentrations. OD600 were normalized to WT grown in standard HC medium. Error bars indicate s.d.m. (n ≥6). (D) Relative growth of WT, bap2Δ and ist2Δ strains transformed with CEN plasmids encoding BAP2 under control of the pADH1 (light grey) or pTEF1 (dark grey) promoters or empty plasmids p416. Pre-cultures grown in HC-ura for 18 hours were diluted to 0.1 OD600 into fresh HC media and OD600 was measured after 10 hours. OD600 was normalized to WT transformed with empty plasmid. White numbers at the base of dark grey bars indicate fold increase compared to respective strains transformed with empty plasmids. Error bars indicate s.d.m. (n ≥3). (E) CAN1 under control of pADH1 and pTEF1 promoters or empty vectors were expressed in WT and ist2Δ cells from CEN plasmids. Cells were grown to the end of log phase, diluted to 0.1 OD600 into fresh medium and OD600 was measured after 8 hours. OD600 was normalized to WT transformed with empty plasmid (black). Error bars indicate s.d.m. (n = 6). Significance (unpaired, two-tailed student’s t-test) of p<0.01, p<0.005 and p<0.001 is indicated by single, double and triple asterisks; n.s. indicates non-significant difference (p>0.01).
Figure 5
Figure 5. PM trafficking of Bap2 is impaired in ist2Δ cells.
(A and C) Representative green channel (Bap2-GFP) and bright field (BF) images of WT and ist2Δ cells expressing genomically tagged Bap2-GFP. Cells were inoculated to 0.2 OD600 in HC media and grown for 16 to 20 hours (A). After 24 hours (indicated as 0 h HC+leu) cells were diluted 1∶20 into fresh HC media containing (4 h HC+leu) or lacking (4 h HC-leu) leucine and grown for 4 hours. Scale bars correspond to 2 µm. For quantification of the intensity ratio between peripheral and intracellular fluorescence the mean intensity of a ring-like peripheral area was divided by the mean intensity of the intracellular area (B and D). The quantification of the experiment shown in A includes an additional 24 hours time point (B). The quantification of the experiment shown in C includes additional time points 1 to 3 hours after dilution in HC-leu media (D). Error bars indicate s.d.m. (n = 15). Significance (unpaired, two-tailed student’s t-test) of p<0.01, p<0.005 and p<0.001 is indicated by single, double and triple asterisks; n.s. indicates non-significant difference (p>0.01).
Figure 6
Figure 6. ER exit of newly synthesized Bap2 is delayed in ist2Δ cells.
(A) Relative growth of WT (black) and ist2Δ (white) cells expressing endogenous Bap2 (no tag) or Bap2-tFT. Cells were grown in HC media for 18 hours, diluted to 0.1 OD600 into fresh medium and grown for 8 hours. OD600 was normalized to WT expressing untagged Bap2. Error bars indicate s.d.m. (n = 6 for untagged and n = 15 for tFT-tagged cells). (B) Representative images of Bap2-tFT expressed in WT and ist2Δ cells. Bright field (BF), green channel (sfGFP), red channel (mCherry) and ratiometric images are shown after 18 hours growth in HC media or 4 hours after dilution into fresh HC media. Arrows in sfGFP images indicate perinuclear ER. Scale bars in BF images correspond to 2 µm. (C) mCherry/sfGFP intensity ratios of the periphery in WT and ist2Δ cells and of perinuclear ER in ist2Δ. Error bars indicate s.d.m. (n = 40; 10 cells each from 4 images taken with identical settings. Single cell values correspond to mean intensity of three randomly chosen areas within the respective membrane). (D and E) Distribution of the mCherry/sfGFP intensity ratio for Bap2-tFT in the periphery of WT (filled circles) and ist2Δ (open circles) mother (D) and daughter (E) cells. Error bars indicate s.e.m. (n ≥17). (F) Uptake of 3H-leucine in WT and ist2Δ cells expressing genomically tagged Bap2-tFT and LEU2 from a plasmid. Cells were grown for 18 hours in HC media without leucine followed by dilution into HC media containing leucine.

Similar articles

Cited by

References

    1. Vallejo CG, Serrano R (1989) Physiology of mutants with reduced expression of plasma membrane H+-ATPase. Yeast 5: 307–319. - PubMed
    1. Forsberg H, Ljungdahl PO (2001) Sensors of extracellular nutrients in Saccharomyces cerevisiae. Curr Genet 40: 91–109. - PubMed
    1. Beck T, Schmidt A, Hall MN (1999) Starvation induces vacuolar targeting and degradation of the tryptophan permease in yeast. J Cell Biol 146: 1227–1238. - PMC - PubMed
    1. Kriel J, Haesendonckx S, Rubio-Texeira M, Van Zeebroeck G, Thevelein JM (2011) From transporter to transceptor: signaling from transporters provokes re-evaluation of complex trafficking and regulatory controls: endocytic internalization and intracellular trafficking of nutrient transceptors may, at least in part, be governed by their signaling function. Bioessays 33: 870–879. - PMC - PubMed
    1. Berchtold D, Piccolis M, Chiaruttini N, Riezman I, Riezman H, et al. (2012) Plasma membrane stress induces relocalization of Slm proteins and activation of TORC2 to promote sphingolipid synthesis. Nat Cell Biol 14: 542–547. - PubMed

Publication types

MeSH terms

Substances