. 2014 Jan 8;9(1):e85436.
doi: 10.1371/journal.pone.0085436. eCollection 2014.

Oxidative stress induces mitochondrial dysfunction in a subset of autism lymphoblastoid cell lines in a well-matched case control cohort

Affiliations

Oxidative stress induces mitochondrial dysfunction in a subset of autism lymphoblastoid cell lines in a well-matched case control cohort

Shannon Rose et al. PLoS One. .

Abstract

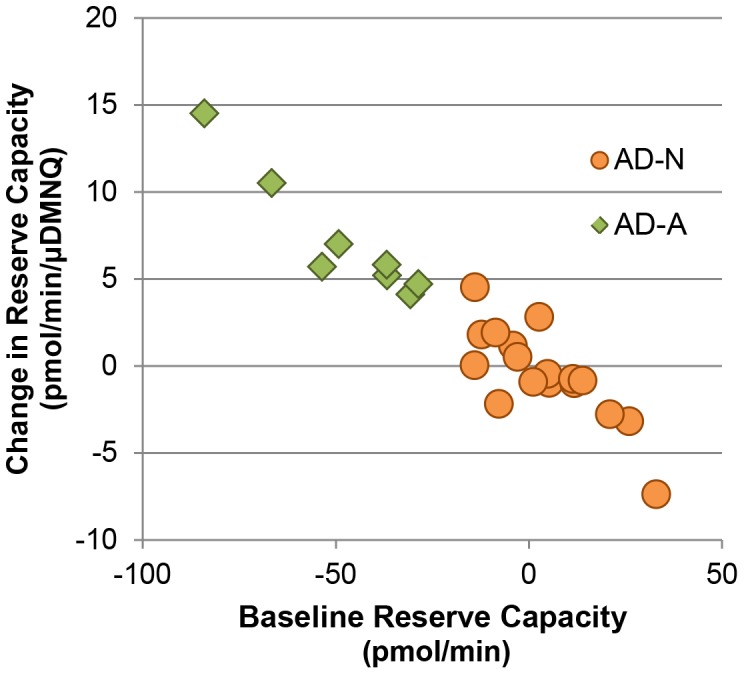
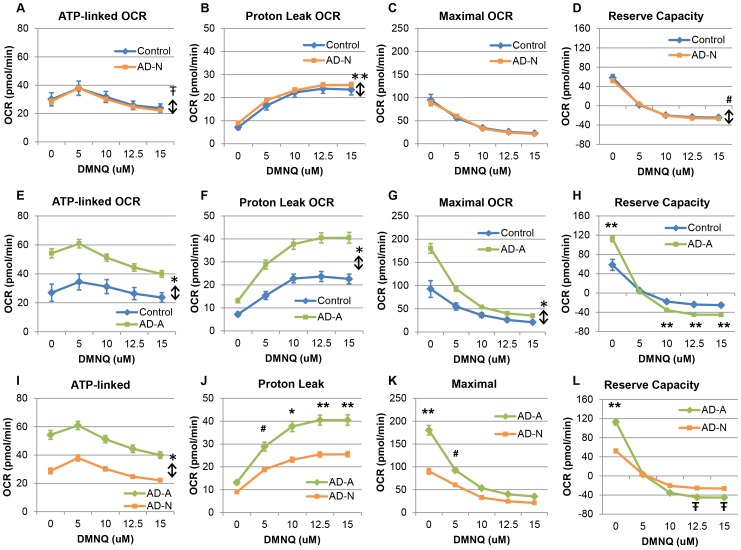
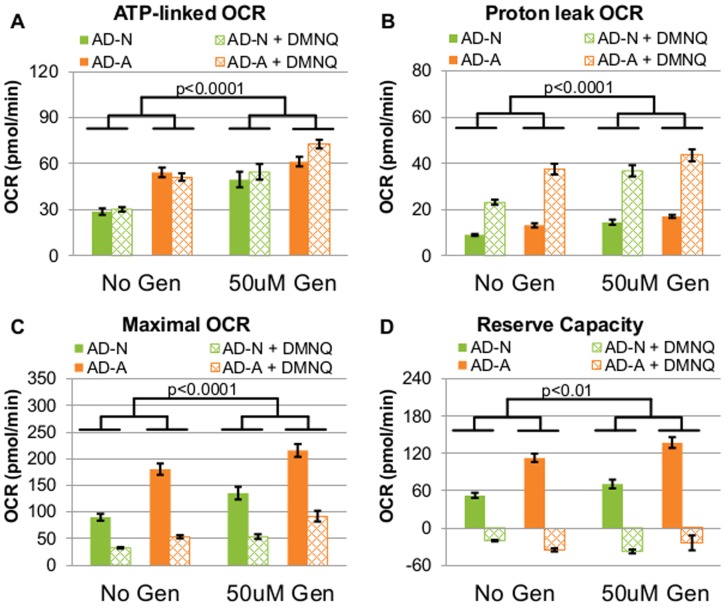
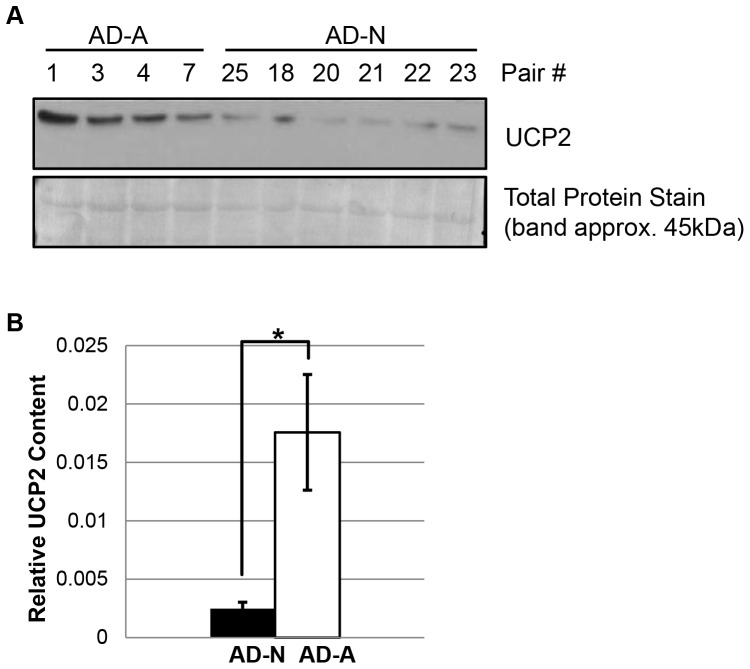
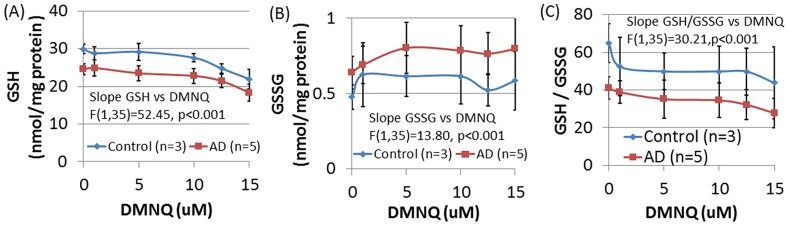
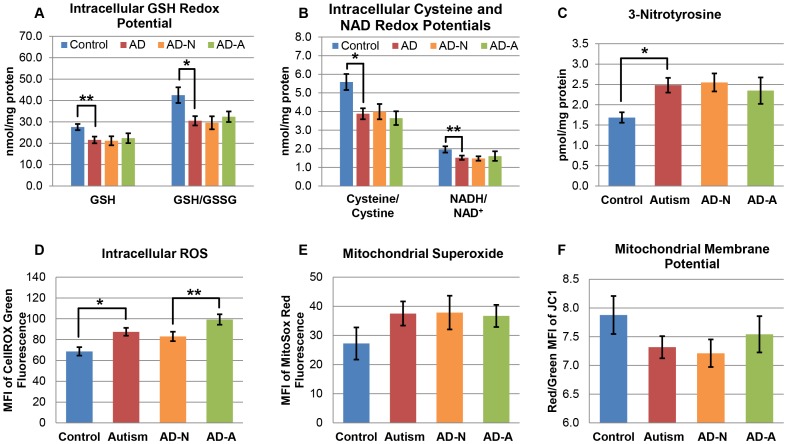
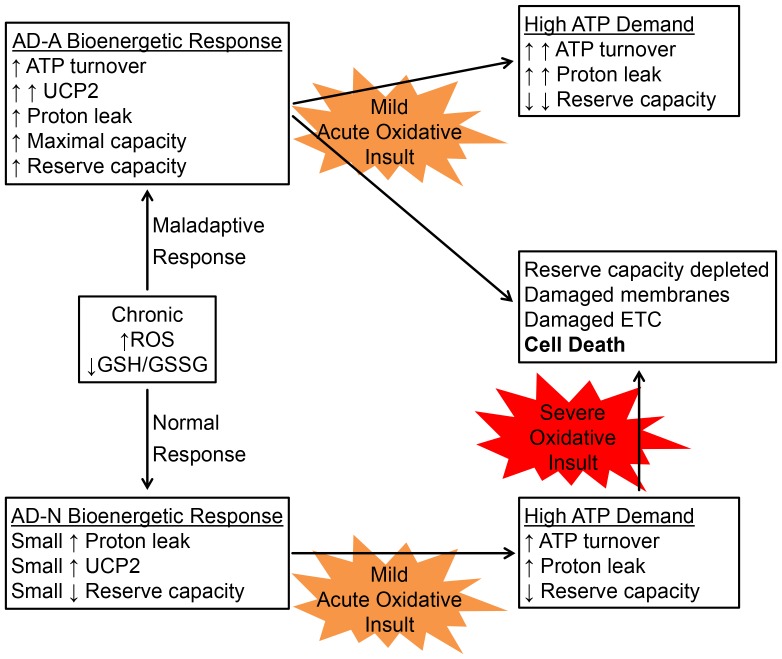
There is increasing recognition that mitochondrial dysfunction is associated with the autism spectrum disorders. However, little attention has been given to the etiology of mitochondrial dysfunction or how mitochondrial abnormalities might interact with other physiological disturbances associated with autism, such as oxidative stress. In the current study we used respirometry to examine reserve capacity, a measure of the mitochondrial ability to respond to physiological stress, in lymphoblastoid cell lines (LCLs) derived from children with autistic disorder (AD) as well as age and gender-matched control LCLs. We demonstrate, for the first time, that LCLs derived from children with AD have an abnormal mitochondrial reserve capacity before and after exposure to increasingly higher concentrations of 2,3-dimethoxy-1,4-napthoquinone (DMNQ), an agent that increases intracellular reactive oxygen species (ROS). Specifically, the AD LCLs exhibit a higher reserve capacity at baseline and a sharper depletion of reserve capacity when ROS exposure is increased, as compared to control LCLs. Detailed investigation indicated that reserve capacity abnormalities seen in AD LCLs were the result of higher ATP-linked respiration and maximal respiratory capacity at baseline combined with a marked increase in proton leak respiration as ROS was increased. We further demonstrate that these reserve capacity abnormalities are driven by a subgroup of eight (32%) of 25 AD LCLs. Additional investigation of this subgroup of AD LCLs with reserve capacity abnormalities revealed that it demonstrated a greater reliance on glycolysis and on uncoupling protein 2 to regulate oxidative stress at the inner mitochondria membrane. This study suggests that a significant subgroup of AD children may have alterations in mitochondrial function which could render them more vulnerable to a pro-oxidant microenvironment derived from intrinsic and extrinsic sources of ROS such as immune activation and pro-oxidant environmental toxicants. These findings are consistent with the notion that AD is caused by a combination of genetic and environmental factors.


Conflict of interest statement

Competing Interests: The authors have declared that no competing interests exist.

Figures

Figure 1
Figure 1. The Seahorse assay.
Oxygen consumption rate (OCR) is measured before and after the addition of inhibitors to derive several parameters of mitochondrial respiration. Initially, baseline cellular OCR is measured, from which basal respiration can be derived by subtracting non-mitochondrial respiration. Next oligomycin, a complex V inhibitor, is added and the resulting OCR is used to derive ATP-linked respiration (by subtracting the oligomycin rate from baseline cellular OCR) and proton leak respiration (by subtracting non-mitochondrial respiration from the oligomycin rate). Next carbonyl cyanide-p-trifluoromethoxyphenyl-hydrazon (FCCP), a protonophore, is added to collapse the inner membrane gradient, allowing the ETC to function at its maximal rate, and maximal respiratory capacity is derived by subtracting non-mitochondrial respiration from the FCCP rate. Lastly, antimycin A and rotenone, inhibitors of complex III and I, are added to shut down ETC function, revealing the non-mitochondrial respiration. Mitochondrial reserve capacity is calculated by subtracting basal respiration from maximal respiratory capacity.
Figure 2
Figure 2. AD LCLs demonstrate differences in mitochondrial function as compared to control LCLs at baseline and after exposure to DMNQ.
(A) ATP-linked respiration and (B) proton leak respiration were overall significantly higher in the AD LCLs, and there was a greater increase in proton leak respiration with DMNQ as compared to control LCLs. (C) Maximal respiratory capacity was significantly elevated in the AD LCLs at 0 µM and 5 µM DMNQ compared to control LCLs, and the AD LCLs exhibited a greater decrease in maximal capacity as DMNQ increased as compared to control LCLs. (D) Reserve capacity was significantly elevated in the AD LCLs at baseline, and it decreased with DMNQ so that it was significantly lower than control LCLs at 10–15 µM DMNQ. *p<0.001; **p<0.0001; ↕ indicates an overall statistical difference between LCL groups.
Figure 3
Figure 3. The AD LCLs cluster into two subgroups.
The difference in baseline reserve capacity between control and AD pairs was plotted against the difference in the change in reserve capacity (from 0 to 10 µM DMNQ) between control and AD pairs. The AD-A subgroup (green diamonds) exhibited greater differences in baseline reserve capacity and change in reserve capacity as compared to the paired control LCLs, whereas the AD-N subgroup (orange circles) exhibited reserve capacity parameters more similar to the paired control LCLs.
Figure 4
Figure 4. Mitochondrial respiratory parameters and responses to DMNQ differ in two AD LCL subgroups.
Overall, the AD-N subgroup (A–D) demonstrates similar mitochondrial responses as the control LCLs while the AD-A subgroup (E–H) parallels the differences between the AD and control LCLs found in the overall analysis. For the AD-N subgroup (A) ATP-linked respiration and (D) reserve capacity were overall slightly but significantly lower in the AD-N LCLs while (B) proton leak respiration was overall slightly but significantly higher in the AD-N LCLs, and (C) maximal respiratory capacity was not different in the AD-N LCLs as compared to controls. For the AD-A subgroup, (E) ATP-linked respiration, (F) proton leak respiration and (G) maximal respiratory capacity were overall markedly higher for AD-A LCLs as compared to control LCLs. (H) Reserve capacity was significantly greater for the AD-A LCLs as compared to control LCLs at baseline but decreased such that it was significantly lower than controls at 10–15 µM DMNQ. (I) ATP-linked respiration was overall markedly higher for AD-A LCLs as compared to AD-N LCLs. (J) Proton leak respiration was significantly higher in the AD-A LCLs as compared to the AD-N LCLs at 5–15 µM DMNQ. (K) Maximal respiratory capacity was significantly higher for AD-A LCLs as compared to AD-N LCLs at baseline and 5 µM DMNQ. (L) Reserve capacity was significantly greater for the AD-A LCLs at baseline but decreased so that it was significantly lower for the AD-A LCLs as compared to the AD-N LCLs at 12.5 and 15 µM DMNQ. *p<0.001; **p<0.0001; # p<0.01; formula image 
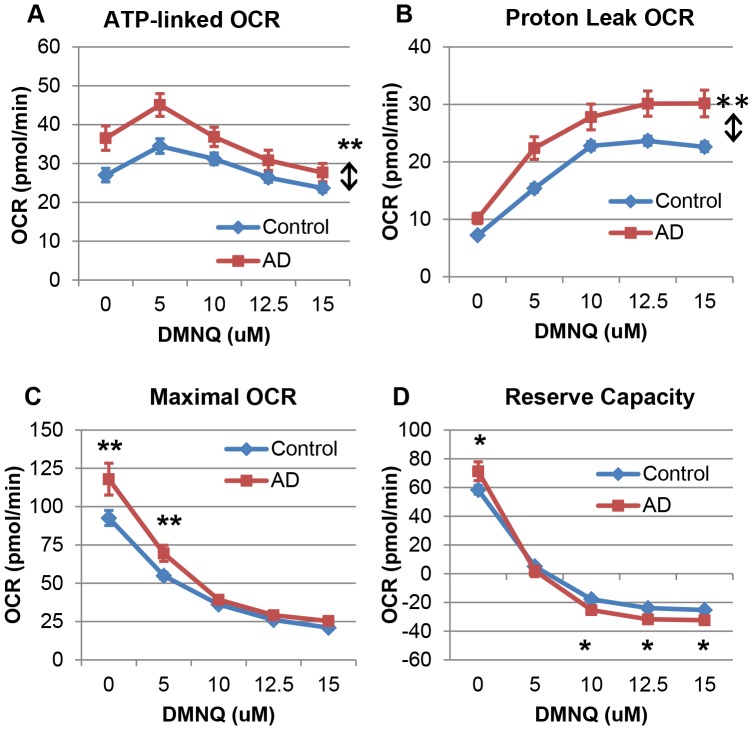
p<0.05; ↕ indicates an overall statistical difference between LCL groups.
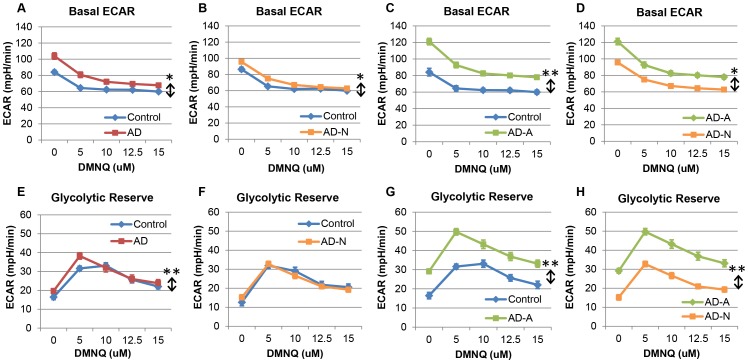
Figure 5
Figure 5. Extracellular acidification rate (ECAR) differs in AD-A and AD-N LCLs.
Basal ECAR was overall significantly higher, and the decrease in ECAR with DMNQ was also greater for the (A) AD LCLs as a whole, (B) the AD-N LCLs and (C) the AD-A LCLs as compared to matched controls. (D) The AD-A LCLs had an overall significantly higher basal ECAR than the AD-N LCLs. (E) Glycolytic reserve capacity was overall higher in the AD LCLs as a whole compared to the control LCLs, but was not different between (F) AD-N and controls. (G) The AD-A LCLs exhibited overall higher glycolytic reserve capacity as compared to the control LCLs and compared to the (H) AD-N LCLs. *p<0.001; **p<0.0001; ↕ indicates an overall statistical difference between LCL groups.
Figure 6
Figure 6. Inhibition of UCP2 with Genipin affects AD-A and AD-N LCLs differently.
(A) ATP-linked respiration was overall higher in LCLs exposed to genipin compared to unexposed LCLs, and cells exposed to genipin exhibited a greater increase in ATP-linked respiration with DMNQ compared to cells unexposed to genipin. (B) Proton leak respiration was overall higher in the LCLs exposed to genipin as compared to the unexposed LCLs, and pretreatment with genipin resulted in a greater increase in proton leak respiration for the AD-N LCLs as compared to the AD-A LCLs. LCLs exposed to genipin had a greater increase in proton leak respiration with DMNQ compared to cells unexposed to genipin. (C) Maximal respiratory capacity was overall higher in the LCLs exposed to genipin than the LCLs not exposed to genipin, and the decrease in maximal capacity with DMNQ was greater for the genipin treated LCLs compared to the genipin unexposed LCLs. (D) Reserve capacity was overall higher in the LCLs exposed to genipin as compared to the unexposed LCLs, and the increase in reserve capacity with genipin was greater for the AD-A LCLs than the AD-N LCLs. The decrease in reserve capacity with DMNQ was significantly greater for the genipin treated LCLs as compared to the genipin unexposed cells.
Figure 7
Figure 7. UCP2 content is higher in the AD-A LCL subgroup.
(A) Immunoblot analysis of UCP2. Cell lysates from AD-N LCLs (N = 4) and AD-A LCLs (N = 6) were analyzed for UCP2 content. A total protein stain served as the loading control. The molecular weight of UCP2 was confirmed using molecular mass markers. (B) Quantitation of band densities demonstrates the significantly higher UCP2 content in AD-A LCLs as compared to AD-N LCLs. *p<0.01.
Figure 8
Figure 8. Mitochondrial DNA copy number does not differ between AD LCL subgroups.
Relative copy numbers of the mitochondrial genes ND1, ND4, and Cyt B were assessed by normalization with the nuclear gene PK. No significant differences were found between two AD LCL subgroups.
Figure 9
Figure 9. DMNQ exposure alters the glutathione redox status of LCLs.
The change in intracellular (A) reduced glutathione (GSH), (B) oxidized glutathione (GSSG) and (C) the reduced-to-oxidized glutathione ratio (GSH/GSSG) with increased intracellular oxidative stress was measured in control (n = 3) and AD (n = 5) LCLs treated with indicated concentrations of the redox cycling agent DMNQ for 1 h. Results are expressed per mg protein. Overall DMNQ significantly reduces GSH and GSH/GSSH and increases GSSG.
Figure 10
Figure 10. AD LCLs exhibit a more oxidized redox state and increased production of ROS.
(A) Reduced glutathione (GSH) and the reduced-to-oxidized glutathione ratio (GSH/GSSG) were both significantly lower in AD as compared to control LCLs. (B) The ratio of reduced cysteine to oxidized cystine was significantly lower in the AD LCLs as compared to the control LCLs. The NADH/NAD+ ratio was also significantly lower in the AD LCLs as compared to control LCLs. The data is presented as the NADH/NAD+ ratio x 10 for clarity. (C) 3-nitrotyrosine was significantly higher in the AD LCLs as compared to the control LCLs. (D) Intracellular ROS was measured by CellRox Green fluorescence, and the AD LCLs demonstrated significantly higher levels of intracellular ROS as compared to control LCLs. Furthermore, the AD-A LCLs demonstrated higher levels of intracellular ROS as compared to the AD-N LCLs. (E) Mitochondrial superoxide was measured using MitoSox Red fluorescence, and (F) mitochondrial membrane potential was measured using JC-1 fluorescence in the AD and control LCLs. There were no significant differences in either mitochondrial superoxide or mitochondrial membrane potential between any of the LCL groups. *p<0.01; **p<0.05.
Figure 11
Figure 11. Normal adaptive and maladaptive mitochondrial responses to a more oxidized intracellular microenvironment.
Diagrammed are the normal adaptive (AD-N) and maladaptive (AD-A) responses to a more highly oxidized intracellular microenvironment in the AD LCLs. The normal adaptive response of mitochondrial respiration to this more oxidized state, as seen in the AD-N LCLs, is to slightly decrease ATP turnover (ATP-linked respiration) and slightly increase proton leak, likely through a small increase in UCP2 expression (although not confirmed) resulting in a slight decrease in reserve capacity. In contrast, as seen in the AD-A LCLs, a maladaptive response is to significantly increase proton leak (through increased UCP2 expression) as well as ATP turnover, maximal respiratory capacity and reserve capacity. When then exposed to a mild oxidative insult, both groups experience higher ATP demand and respond by increasing ATP turnover and proton leak respiration, thereby reducing reserve capacity; however, this response is greatly exaggerated in the maladaptive AD-A LCLs. We propose that while all cells are vulnerable to an ATP crisis and cell death under severe oxidative stress conditions, that in the maladaptive AD-A LCLs only a mild insult would be required to push the cells to a state of ATP crisis.

Similar articles

Cited by

References

    1. APA (1994) Diagnostic and statistical manual of mental disorders. Washington, DC: American Psychiatric Association.
    1. Autism, Developmental Disabilities Monitoring Network Surveillance Year Principal I (2009) Centers for Disease C, Prevention (2009) Prevalence of autism spectrum disorders - Autism and Developmental Disabilities Monitoring Network, United States, 2006. MMWR Surveill Summ 58: 1–20. - PubMed
    1. Hallmayer J, Cleveland S, Torres A, Phillips J, Cohen B, et al. (2011) Genetic heritability and shared environmental factors among twin pairs with autism. Arch Gen Psychiatry 68: 1095–1102. - PMC - PubMed
    1. Rossignol DA, Frye RE (2012) A review of research trends in physiological abnormalities in autism spectrum disorders: immune dysregulation, inflammation, oxidative stress, mitochondrial dysfunction and environmental toxicant exposures. Mol Psychiatry 17: 389–401. - PMC - PubMed
    1. James SJ, Melnyk S, Jernigan S, Cleves MA, Halsted CH, et al. (2006) Metabolic endophenotype and related genotypes are associated with oxidative stress in children with autism. Am J Med Genet B Neuropsychiatr Genet 141B: 947–956. - PMC - PubMed

Publication types

MeSH terms