Comparative Study
. 2014 Mar;32(3):248-55.
doi: 10.1016/j.ajem.2013.11.045. Epub 2013 Dec 7.

Resuscitation from hemorrhagic shock using polymerized hemoglobin compared to blood

Affiliations
Comparative Study

Resuscitation from hemorrhagic shock using polymerized hemoglobin compared to blood

Daniel Ortiz et al. Am J Emerg Med. 2014 Mar.

Abstract

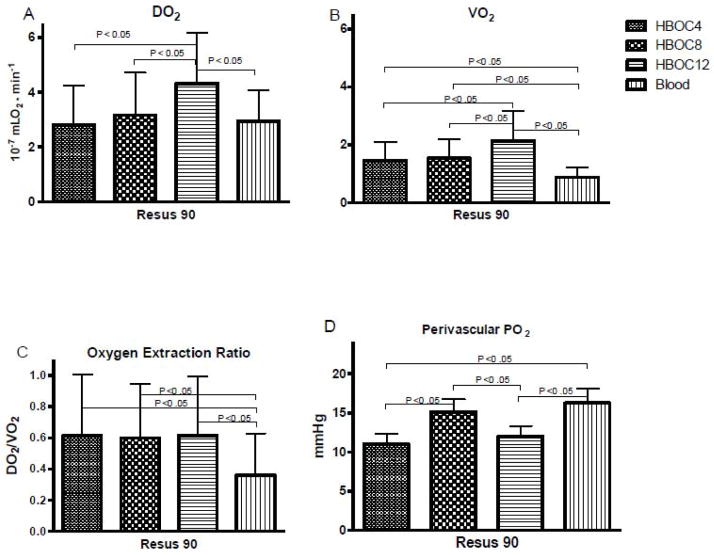
The development of an alternative to blood transfusion to treat severe hemorrhage remains a challenge, especially in far forward scenarios when blood is not available. Hemoglobin level (Hb)-based oxygen (O2) carriers (HBOCs) were developed to address this need. Hemopure (HBOC-201, bovine Hb glutamer-250; OPK Biotech, Cambridge, MA), one such HBOC, has been approved for clinical use in South Africa and Russia. At the time of its approval, however, few studies aimed to understand Hemopure's function, administration, and adverse effects compared to blood. We used intravital microscopy to study the microcirculation hemodynamics (arteriolar and venular diameters and blood flow and functional capillary density [FCD]) and oxygenation implications of Hemopure administration at different Hb concentrations-4, 8, and 12 gHb/dL-compared to fresh blood transfusion during resuscitation from hemorrhagic shock. Experiments were performed in unanesthetized hamsters instrumented with a skinfold window chamber, subjected to hemorrhage (50% of the blood volume), followed by 1-hour hypovolemic shock and fluid resuscitation (50% of the shed volume). Our results show that fluid resuscitation with Hemopure or blood restored systemic and microvascular parameters. Microcirculation O2 delivery was directly correlated with Hemopure concentration, although increased vasoconstriction was as well. Functional capillary density reflected the balance between enhanced O2 transport and reduced blood flow: 12 gHb/dL of Hemopure and blood decreased FCD compared to the lower concentrations of Hemopure (P < .05). The balance between O2 transport and tissue perfusion can provide superior resuscitation from hemorrhagic shock compared to blood transfusion by using a low Hb concentration of HBOCs relative to blood.


Conflict of interest statement

Disclosures

Author declares no competing financial interests by the results presented in this manuscript. No financial support was received from OPK Biotech for the completion of the study. This investigation was supported by the following grants: NIH R01 HL52684, R01 HL064395 and R01 HL062318 and ARMY: W81XWH-11-2-0012. The author thanks Froilan P. Barra and Cynthia Walser for the surgical preparation of the animals.

Figures

Figure 1
Figure 1
A. Model used, measured parameters and PQM set up. Top left image is an example of the window chamber preparation with the carotid and jugular catheters attached to it before the beginning experiments. Bottom left image shows a schematic representation of the PQM set up used for PO2 measurements. Top right image shows a typical capillary bed for the quantification of functional capillary density (FCD). Bottom right image shows typical arterioles and venules were blood flow is measured. B. Schematic illustration of hemorrhage shock protocol. Baseline characterization is performed prior to the hemorrhage. Hypovolemic shock is induced by withdrawning 50% of estimated animal’s BV. Hypovolemia is maintained for 60 minutes, and then resuscitation is completed by infusion of 25% of animal’s BV with the test fluid. Parameters are measured throughout protocol at 15, 30 and 50 minutes after the onset of hemorrhage shock, followed by measurements taken at 15, 30, 60 and 90 minutes post resuscitation.
Figure 2
Figure 2. Mean Arterial Pressure during protocol experiment using Blood, HBOC4, HBOC8, and HBOC12
Values are presented as means ± SD. No significant differences were found between the groups HBOC8 and HBOC12 nor between the groups HBOC12 and Blood were. †, P < 0.05 compared with Baseline, ‡, P < 0.05 compared with Shock.
Figure 3
Figure 3. Microvascular hemodynamic data relative to baseline during shock and resuscitation using Blood, HBOC4, HBOC8, and HBOC12
Values shown are mean ± SD. †, P < 0.05 compared with Baseline, ‡, P < 0.05 compared with Shock. Baseline diameters (μm, mean ± SD), (A) and (B), for each animal group were as follows: HBOC4 (arterioles [A]: 55.4 ± 7.4, n = 27; venules [V]: 59.1 ± 7.3, n = 29); HBOC8 (A: 56.8 ± 6.7, n = 30; V: 60.9 ± 6.8, n = 33); HBOC12 (A: 62.8 ± 7.5, n = 26, V: 64.4 ± 8.0, n = 29); Blood (A: 54.3 ± 5.8, n = 26, V: 53.5 ± 5.4, n = 26). Calculated baseline blood flow, (C) and (D), (nL/s, mean ± SD) for each animal group were as follows: HBOC4 (arterioles [A]: 10.2 ± 4.9, n = 27; venules [V]: 6.0 ± 2.6, n = 29); HBOC8 (A: 11.4±4.9, n=30; V: 6.7 ± 2.8, n = 33); HBOC12 (A: 15.0 ± 5.6, n = 26, V: 8.4 ± 4.0, n = 29); Blood (A: 9.9 ± 3.0, n = 26, V: 5.7 ± 1.8, n = 26), with ‘n’ indicating number of vessels studied. In (C) and (D), the values within the groups were significant when compared to their respective Shock and Baselines for all data points.
Figure 4
Figure 4. Functional Capillary Density relative to baseline during shock and resuscitation phases
Values shown are mean ± SD. The groups HBOC4 and HBOC8 were not different throughout protocol. The groups HBOC12 and Blood were not different throughout protocol. The FCD measurements at baseline (cm−1, mean ± SD) were as follows: HBOC4 (112 ± 8); HBOC8 (124 ± 14); HBOC12 (121 ± 16); Blood (107 ± 10). †P < 0.05 compared with Baseline, ‡P < 0.05 compared with Shock.
Figure 5
Figure 5. Microvascular oxygen delivery (DO2), extraction (VO2), extraction ratio (VO2/DO2) and Tissue PO2
All parameters are presented as absolute values and given as mean ± SD. A) The DO2 of groups HBOC4, HBOC8 and Blood were not significantly different. DO2 calculations per group included 27 arterioles for HBOC4, 30 arterioles for HBOC8, 26 arterioles for HBOC12 and 26 arterioles for Blood, respectively. B) The VO2 for the groups HBOC4 and HBOC8 were not significantly different. VO2 calculations pre group included all the arterioles used for DO2, and 29 venules for HBOC4, 33 venules for HBOC8, 29 venules for HBOC12 and 26 venules for Blood, respectively. C) The O2 extraction ratio (OER) (VO2/DO2) was higher for all the groups that received HBOC compared to blood. D) Tissue O2 tension was no different for HBOC8 compared to blood.

References

    1. Greenburg AG. Benefits and risks of blood transfusion in surgical patients. World J Surg. 1996;20(9):1189–93. - PubMed
    1. Kamp C, Heiden M, Henseler O, Seitz R. Management of blood supplies during an influenza pandemic. Transfusion. 2010;50(1):231–9. - PubMed
    1. Hourfar MK, Themann A, Eickmann M, Puthavathana P, Laue T, Seifried E, Schmidt M. Blood screening for influenza. Emerg Infect Dis. 2007;13(7):1081–3. - PMC - PubMed
    1. Blumberg N. Allogeneic transfusion and infection: economic and clinical implications. Semin Hematol. 1997;34(3 Suppl 2):34–40. - PubMed
    1. Stowell CP, Levin J, Spiess BD, Winslow RM. Progress in the development of RBC substitutes. Transfusion. 2001;41(2):287–99. - PubMed

Publication types