. 2014 Jan 20:449:120-32.
doi: 10.1016/j.virol.2013.11.017. Epub 2013 Nov 28.

Susceptibility of the wild-derived inbred CAST/Ei mouse to infection by orthopoxviruses analyzed by live bioluminescence imaging

Affiliations

Susceptibility of the wild-derived inbred CAST/Ei mouse to infection by orthopoxviruses analyzed by live bioluminescence imaging

Jeffrey L Americo et al. Virology. .

Abstract

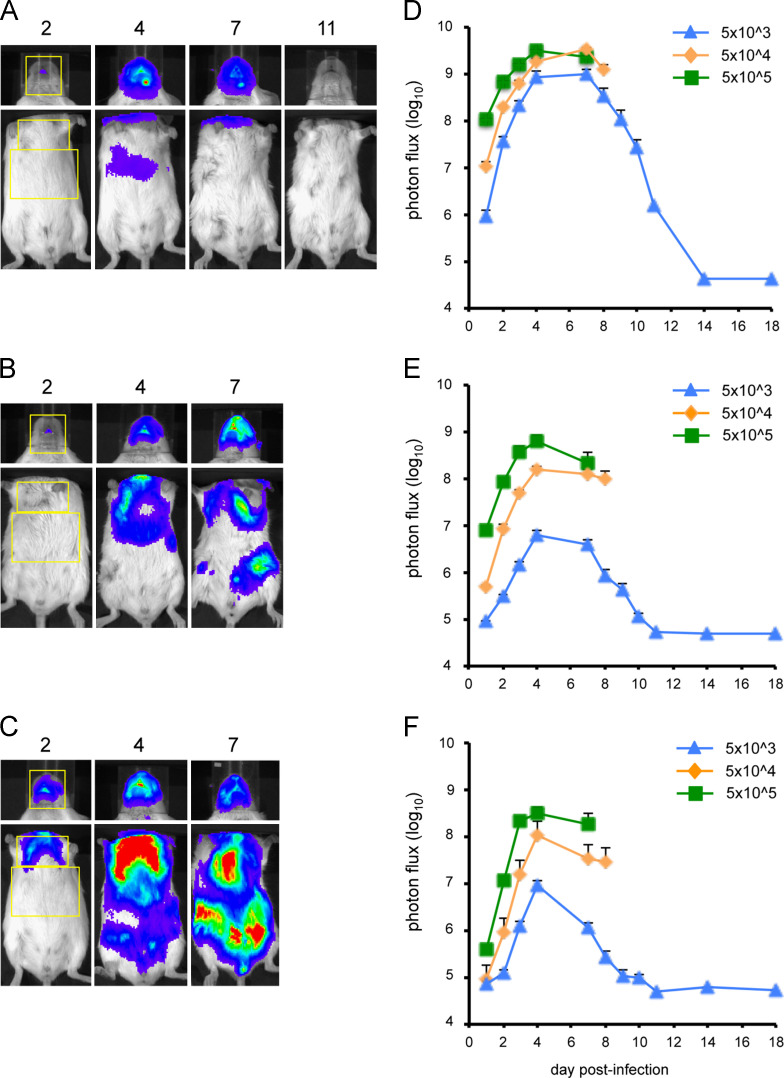
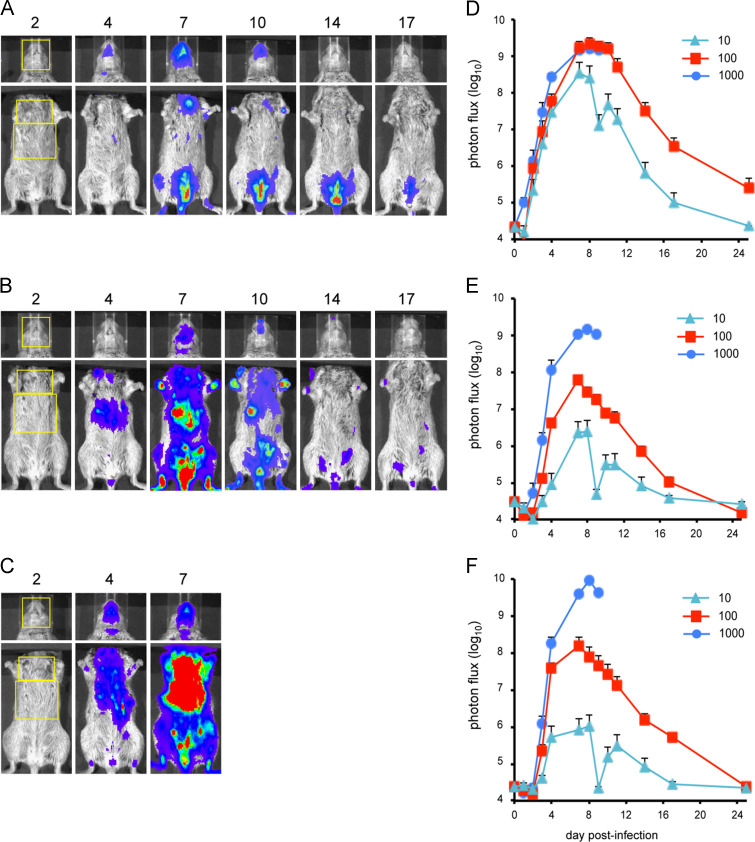
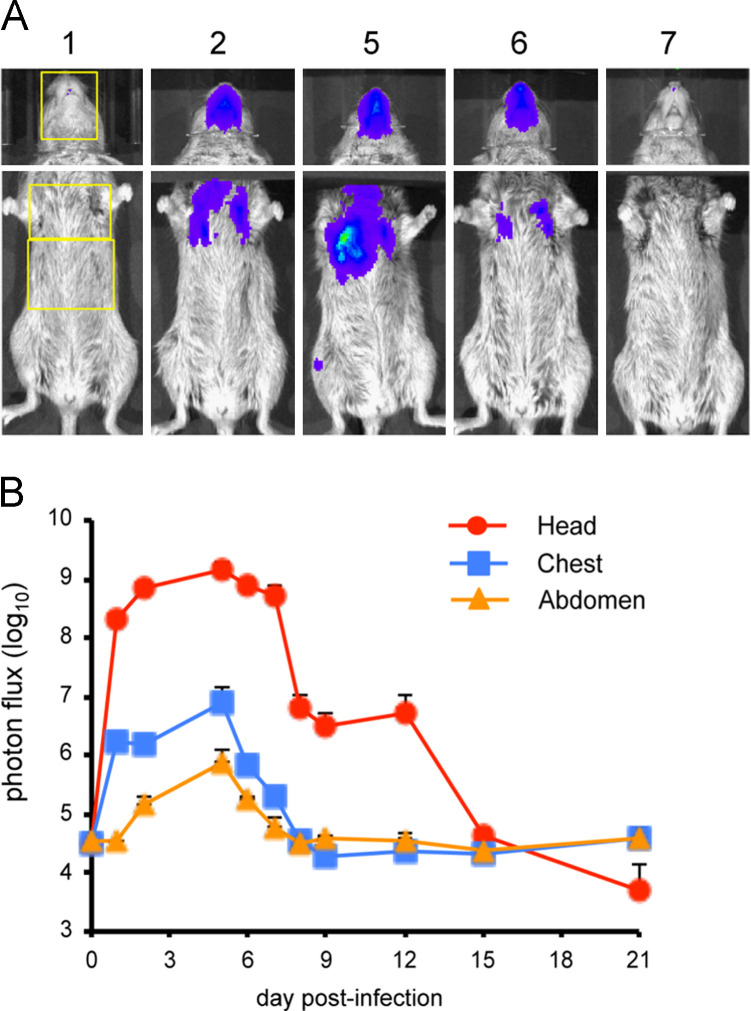
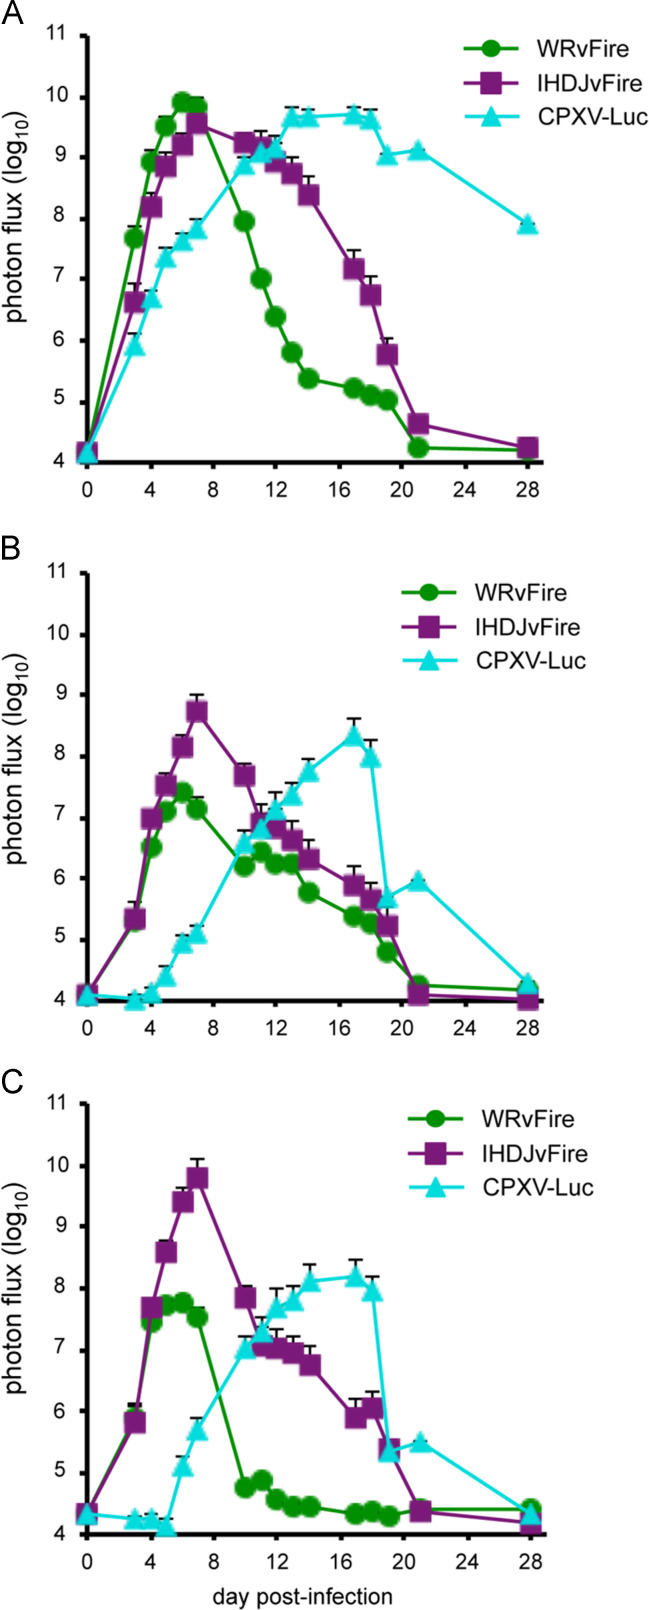
Classical inbred mice are extensively used for virus research. However, we recently found that some wild-derived inbred mouse strains are more susceptible than classical strains to monkeypox virus. Experiments described here indicated that the 50% lethal dose of vaccinia virus (VACV) and cowpox virus (CPXV) were two logs lower in wild-derived inbred CAST/Ei mice than classical inbred BALB/c mice, whereas there was little difference in the susceptibility of the mouse strains to herpes simplex virus. Live bioluminescence imaging was used to follow spread of pathogenic and attenuated VACV strains and CPXV virus from nasal passages to organs in the chest and abdomen of CAST/Ei mice. Luminescence increased first in the head and then simultaneously in the chest and abdomen in a dose-dependent manner. The spreading kinetics was more rapid with VACV than CPXV although the peak photon flux was similar. These data suggest advantages of CAST/Ei mice for orthopoxvirus studies.

Keywords: Cowpox virus pathogenesis; Poxvirus pathogenesis; Vaccinia virus pathogenesis; Wild-derived inbred mice.


Figures

Fig. 1
Fig. 1
Weight loss and survival of CAST and BALB/c mice following intranasal infection with VACV WR or ACAM2000. Groups of 4–10, 14–15 weeks old female CAST and 11 weeks old BALB/c mice were infected intranasally with escalating doses of VACV WR or ACAM2000. Animals were monitored daily for weight loss and death for 18 days. Weight loss (A) and survival (C) of CAST mice infected with VACV WR; weight loss (B) and survival (D) of BALB/c mice infected with VACV WR; weight loss of CAST mice (E) and BALB/c mice (F) infected with ACAM2000; virus titers on the day of death in lung, liver, kidney, spleen and brain (G) and ovaries (H) of CAST mice infected with VACV WR. Bars represent standard error of the mean (SEM).
Fig. 2
Fig. 2
Weight loss and survival of CAST and BALB/c mice following intranasal infection with CPXV-Br. Groups of 3–10, 14–15 weeks old female CAST and 11 weeks old BALB/c mice were infected intranasally with escalating doses of CPXV-Br. Animals were monitored daily for weight loss and death for up to 34 days. Weight loss (A) and survival (C) of CAST mice; weight loss (B) and survival (D) of BALB/c mice; (E) virus titers on the day of death in organs of CAST mice. Bars represent SEM.
Fig. 3
Fig. 3
Intranasal infection of CAST mice with LUC-expressing viruses. Groups of four 8–10 week old female mice were infected intranasally with 10, 100, or 1000 PFU of WRvFire, IHD-JvFire, or CPXV-Br-luc. Animals were monitored daily for 24 days for weight loss and death. Weight loss of mice infected with WRvFire (A), IHD-JvFire (B) and CPXV-Br-luc (C); survival of mice infected with WRvFire (D), IHD-JvFire (E), and CPXV-Br-luc (F). Bars represent SEM.
Fig. 4
Fig. 4
Bioluminescence imaging of CAST mice infected with WRvFire. Three groups of four female CAST mice were infected intranasally with (A) 10 PFU, (B) 100 PFU, or (C) 1000 PFU of WRvFire. Representative images of the heads and ventral torsos of infected mice are shown. The number above each image is the day post-infection. The yellow boxes outline the regions of interest (ROI) used to calculate photon flux. Relative LUC expression is represented by a pseudocolor heat map in which red indicates a high number of photon counts and blue indicates a low number of photon counts. Bioluminescent images of the head were obtained using an f/stop of 1, binning factor of 4, and an acquisition time of 1 s, while images of the ventral torso were obtained with an f/stop of 1, binning factor of 8, and an acquisition time of 10 s. The same color scale set between 600 and 60,000 was used for all three panels of pictures. To quantify bioluminescence signals as total photon flux (photon/s/cm2/sr), ROI analysis was performed on the (D) head, (E) chest, and (F) abdomen of infected mice. Data represent mean group values for photon flux. Bars represent SEM.
Fig. 5
Fig. 5
Bioluminescence imaging of BALB/c mice infected with WRvFire. Three groups of five female BALB/c mice were infected intranasally with (A) 5×10³ PFU, (B) 5×10⁴ PFU, or (C) 5×10⁵ PFU of WRvFire. Representative images of the heads and ventral torsos of infected mice are shown with the day post-infection indicated above the images. The yellow boxes outline the ROI used to calculate photon flux. Bioluminescence images of the head were obtained using an f/stop of 1, binning factor of 4, and an acquisition time of 1 s, while images of the ventral torso were obtained with an f/stop of 1, binning factor of 8, and an acquisition time of 10 s. In panel A the color scale was 600–30,000; for panels B and C it was 4000–60,000. Quantification of bioluminescence signals, expressed as photon flux (photons/s/cm2/sr), is shown for the head (D), chest (E), and abdomen (F). Data represent mean group values for photon flux. Bars represent SEM.
Fig. 6
Fig. 6
Bioluminescence imaging of CAST mice infected with IHD-JvFire. Three groups of four female CAST mice were infected intranasally with (A) 10 PFU, (B) 100 PFU, or (C) 1000 PFU of IHDJ-vFire. The day post-infection on which images were obtained are indicated above each image. The yellow boxes outline the ROI used to calculate photon flux. Bioluminescent images of the head were obtained using an f/stop of 1, binning factor of 4, and an acquisition time of 1 s. Images of the ventral torso were acquired using an f/stop of 1, binning factor of 8, and an acquisition time of 10 s. The same color scale set between 600 and 60,000 was used for all three picture panels. ROI analysis was performed on the (D) head, (E) chest, and (F) abdomen of infected mice to calculate total photon flux. Data represent mean group values for photon flux. Bars represent SEM (the low photon flux values on day 9 was probably due to poor injection of substrate).
Fig. 7
Fig. 7
Bioluminescence imaging of CAST mice infected with Wyeth-vFire. Three female CAST mice were infected intranasally with 107 PFU of Wyeth-vFire. (A) Representative images of the heads and ventral torsos. The day post-infection on which images were obtained is indicated above each image. The yellow boxes outline the ROI used to calculate photon flux. Bioluminescent images of the head were obtained using an f/stop of 1, binning factor of 4, and an acquisition time of 1 s. The same color scale set between 600 and 60,000 was used for all three panels of pictures. Images of the ventral torso were acquired using an f/stop of 1, binning factor of 8, and an acquisition time of 60 s. (B) ROI analysis was performed on the head, chest, and abdomen of infected mice to calculate total photon flux. Data represent mean group values for photon flux. Bars represent SEM.
Fig. 8
Fig. 8
Bioluminescence imaging of CAST mice infected with CPXV-Br-luc. Three groups of four female CAST mice were infected intranasally with CPXV-Br-luc. Representative images of mice infected with (A) 10 PFU, (B) 100 PFU, or (C) 1000 PFU of CPXV-Br-luc are shown. The day post-infection on which luminescence was measured is indicated above each image. The yellow boxes outline the ROI used to calculate photon flux. Bioluminescent images of the head were obtained using an f/stop of 1, binning factor of 4, and an acquisition time of 1 s. Images of the ventral torso were acquired using an f/stop of 1, binning factor of 8, and an acquisition time of 30 s. Color scales were as follows: 10 PFU inoculum dose, 100–4000 for the head and 100–60,000 for the torso; 100 and 1000 PFU input doses, 2000–60,000. ROI analysis was performed on the (D) head, (E) chest, and (F) abdomen of infected mice to calculate total photon flux. Data represent mean group values for photon flux. Bars represent SEM.
Fig. 9
Fig. 9
Kinetics of virus spread in CAST mice infected with WRvFire, IHD-JvFire, or CPXV-Br-luc. Groups of four female CAST mice were infected intranasally with 100 PFU of WRvFire, IHD-JvFire, or CPXV-Br-luc at the same time and imaged for 4 weeks. ROI were drawn on the (A) head, (B) chest, and (C) abdomen of infected mice and total photon flux was calculated. Data represent mean group values for photon flux. Bars represent SEM.
Fig. 10
Fig. 10
Infection of CAST and BALB/c mice with HSV-1. CAST (A) and BALB/c (B) mice were infected with 5×10³–5×10⁸ PFU of HSV-1 in one nostril. Daily weights for each group are plotted as the percent of starting weight (mean ± SEM; n=8). Survival plots of BALB/c and CAST mice infected with HSV-1 at the indicated infection multiplicities intranasally (C) or via the ocular route (D). Viral DNA loads in trigeminal ganglia of BALB/c and CAST mice infected with HSV-1 (E) intranasally (day 16 post-infection; mean ± SEM; p=0.1908; n=18) or (F) via the ocular route (day 6 post-infection; mean ± SEM; p=0.9774; n=15).

Similar articles

Cited by

References

    1. Americo J.L., Moss B., Earl P.L. Identification of wild-derived inbred mouse strains highly susceptible to monkeypox virus infection for use as small animal models. J. Virol. 2010;84:8172–8180. - PMC - PubMed
    1. Beck J.A., Lloyd S., Hafezparast M., Lennon-Pierce M., Eppig J.T., Festing M.F., Fisher E.M. Genealogies of mouse inbred strains. Nat. Genet. 2000;24:23–25. - PubMed
    1. Bengali Z., Satheshkumar P.S., Moss B. Orthopoxvirus species and strain differences in cell entry. Virology. 2012;433:506–512. - PMC - PubMed
    1. Bengali Z., Townsley A.C., Moss B. Vaccinia virus strain differences in cell attachment and entry. Virology. 2009;389:132–140. - PMC - PubMed
    1. Blasco R., Sisler J.R., Moss B. Dissociation of progeny vaccinia virus from the cell membrane is regulated by a viral envelope glycoprotein: effect of a point mutation in the lectin homology domain of the A34R gene. J. Virol. 1993;67:3319–3325. - PMC - PubMed

Publication types