. 2014 Aug;28(8):1636-46.
doi: 10.1038/leu.2014.19. Epub 2014 Jan 14.

Disruption of autophagy by the histone deacetylase inhibitor MGCD0103 and its therapeutic implication in B-cell chronic lymphocytic leukemia

Affiliations
Free PMC article

Disruption of autophagy by the histone deacetylase inhibitor MGCD0103 and its therapeutic implication in B-cell chronic lymphocytic leukemia

V El-Khoury et al. Leukemia. 2014 Aug.
Free PMC article

Abstract

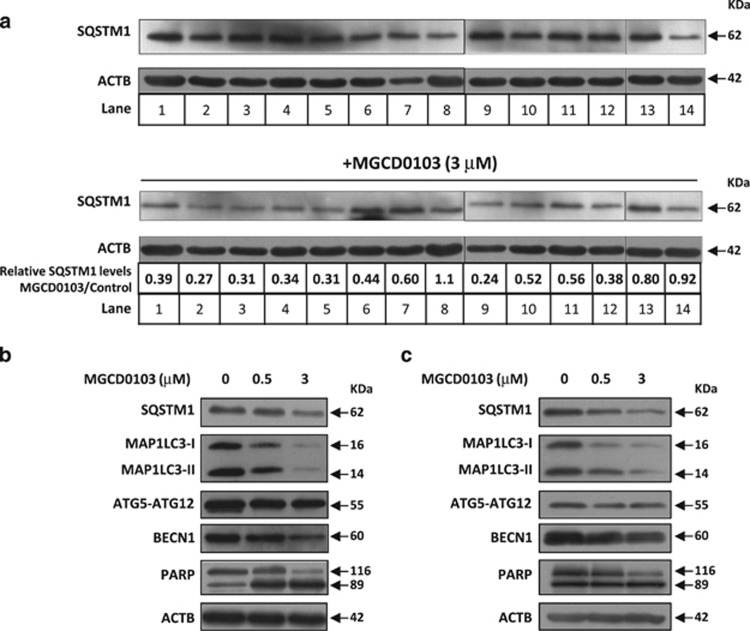
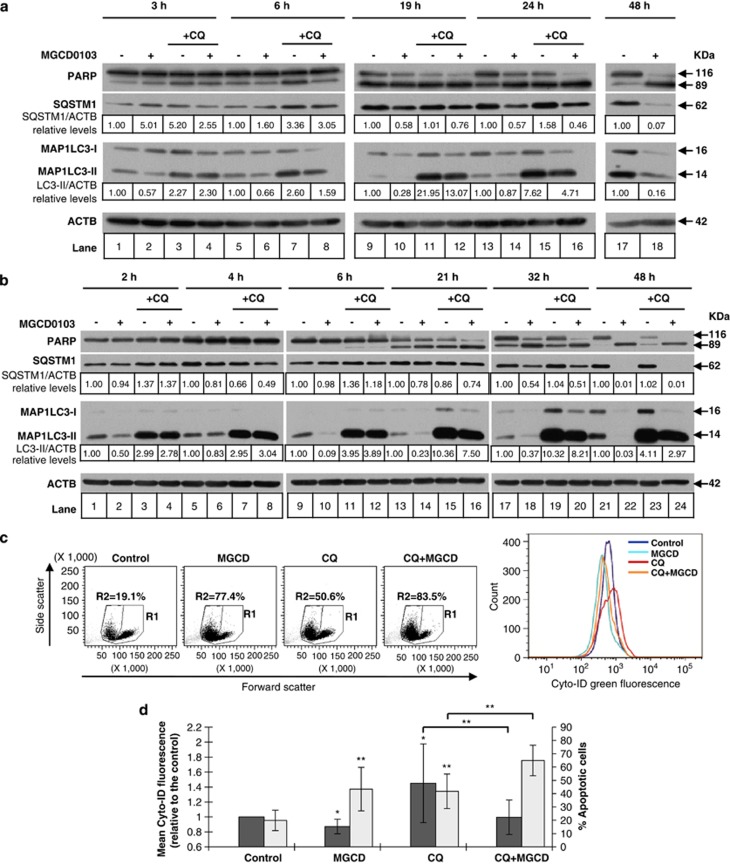
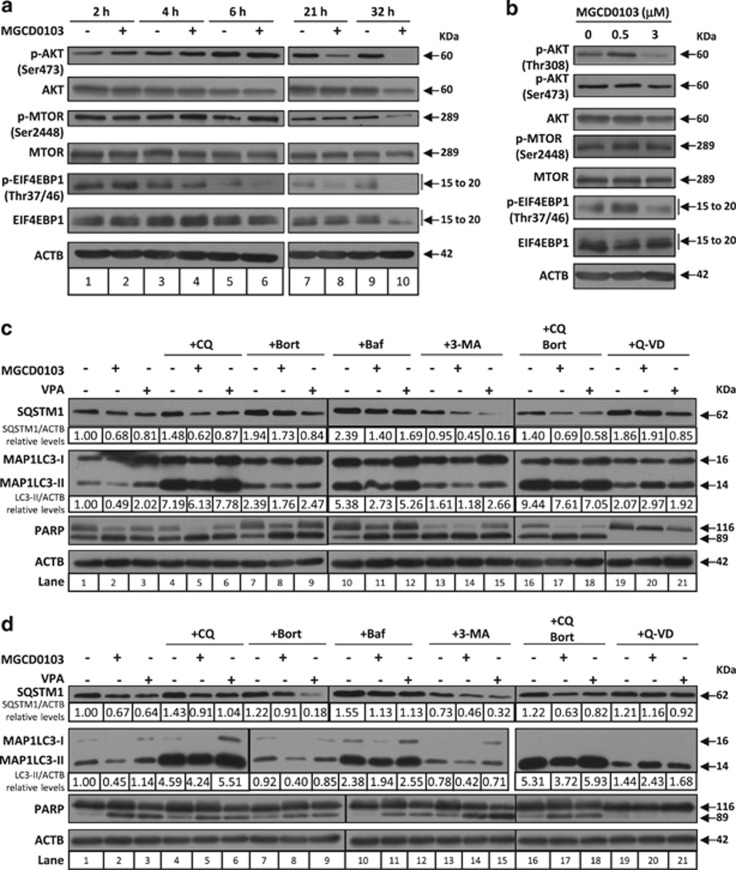
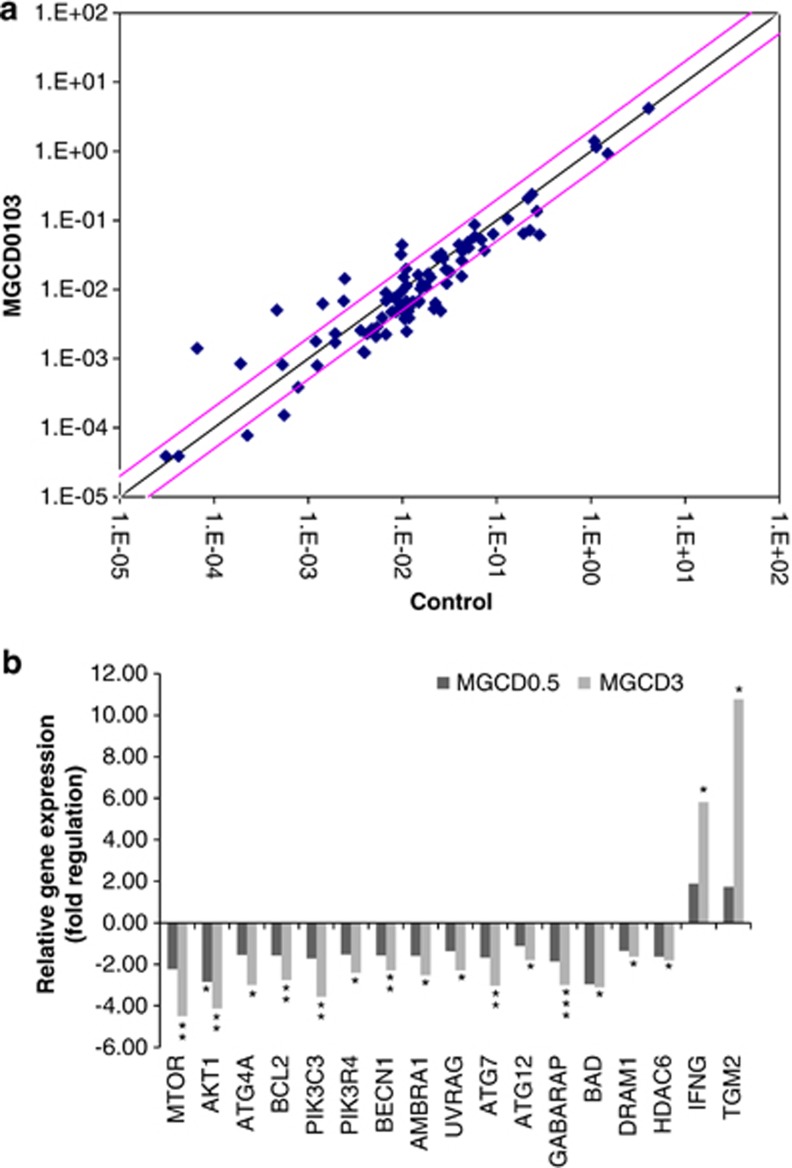
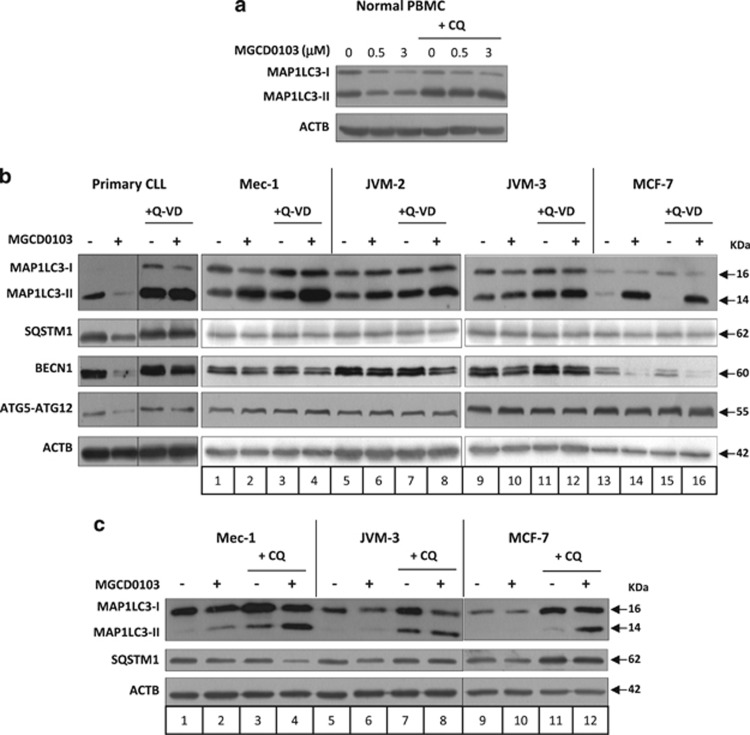
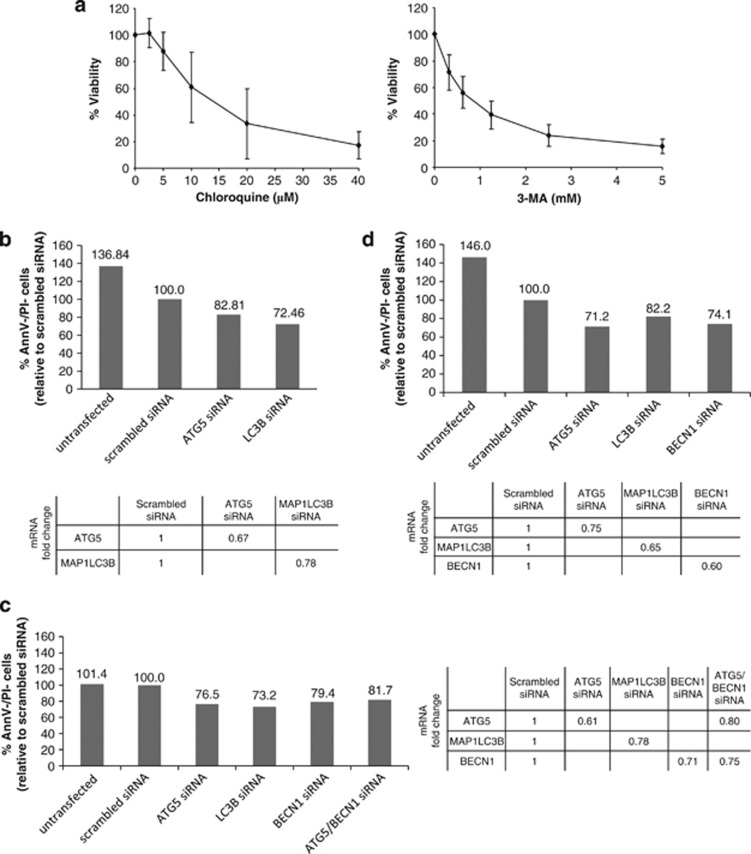
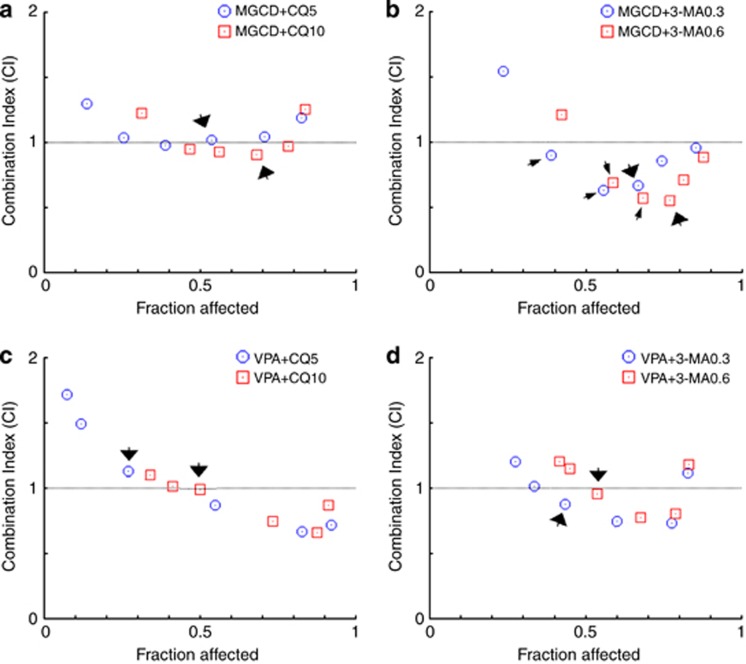
Evading apoptosis is a hallmark of B-cell chronic lymphocytic leukemia (CLL) cells and an obstacle to current chemotherapeutic approaches. Inhibiting histone deacetylase (HDAC) has emerged as a promising strategy to induce cell death in malignant cells. We have previously reported that the HDAC inhibitor MGCD0103 induces CLL cell death by activating the intrinsic pathway of apoptosis. Here, we show that MGCD0103 decreases the autophagic flux in primary CLL cells. Activation of the PI3K/AKT/mTOR pathway, together with the activation of caspases, and to a minor extent CAPN1, resulting in cleavage of autophagy components, were involved in MGCD0103-mediated inhibition of autophagy. In addition, MGCD0103 directly modulated the expression of critical autophagy genes at the transcriptional level that may contribute to autophagy impairment. Besides, we demonstrate that autophagy is a pro-survival mechanism in CLL whose disruption potentiates cell death induced by anticancer molecules including HDAC and cyclin-dependent kinase inhibitors. In particular, our data highlight the therapeutic potential of MGCD0103 as not only an inducer of apoptosis but also an autophagy suppressor in both combination regimens with molecules like flavopiridol, known to induce protective autophagy in CLL cells, or as an alternative to circumvent undesired immunomodulatory effects seen in the clinic with conventional autophagy inhibitors.


Figures

Figure 1
Figure 1
MGCD0103 decreases the levels of autophagy-related proteins in primary CLL cells. Immunoblotting analysis of protein extracts from PBMCs incubated in the absence or presence of MGCD0103 (0.5 or 3 μmol/l, as indicated) for 24 h. Autophagy-related proteins are indicated, as well as ACTB that was used as a loading control. (a) Shown are representative blots from the samples of 14 patients. The expression levels of SQSTM1 in MGCD0103-treated cells relative to the control and normalized to ACTB levels are indicated. (b, c) Shown are two representative blots from eight independent experiments.
Figure 2
Figure 2
MGCD0103 decreases the autophagic flux in primary CLL cells. (a, b) The effect of MGCD0103 (3 μmol/l) on autophagy was assessed by immunoblotting in the presence of chloroquine in time course experiments. ACTB was used as a loading control. Two representative blots (a and b) from four independent experiments are shown. The expression levels of proteins in treated cells relative to the corresponding untreated control and normalized to ACTB levels are indicated. (c, d) Autophagy was assessed by flow cytometry using the Cyto-ID green autophagy dye. For the left panel in (c), single-cell lymphocyte population was gated in R1 (live and apoptotic cells), whereas apoptotic cells were gated in R2 on the basis of cell shrinkage (decreased in forward scatter (FSC)) and increase in granularity (increase in side scatter (SSC)). Shown on the right panel of (c) are the distributions of the dye green fluorescence (channel FL1) within each R1 population. Dot plots and Cyto-ID green fluorescence intensity from a representative experiment are shown in (c). (d) Results are represented by histograms as mean Cyto-ID green fluorescence of treated cells relative to control cells (dark bars). The percentage of apoptotic cells represents the percentage of cells in R2 (bright bars). The mean values±s.d. (n=8) are shown. Values are compared with the corresponding control value. *P<0.05 and **P<0.01.
Figure 3
Figure 3
MGCD0103 inhibits autophagy in primary CLL cells through activation of the PI3K/AKT/mTOR pathway and caspases. (a, b) The effect of MGCD0103 on the PI3K/AKT/mTOR pathway was assessed in primary CLL cells by immunoblotting through the analysis of the phosphorylation status of key regulators. (a) Time course experiments were performed with 3 μmol/l of MGCD0103 and (b) the effect of the 24-h treatment was analyzed using two concentrations of MGCD0103 (0.5 and 3 μmol/l, as indicated). Relative protein quantification is available in Supplementary Table 2. Blots from three independent experiments are shown. (c, d) MGCD0103 decreases the autophagic flux in primary CLL cells in a caspase-dependent manner. Cells were incubated for 24 h alone or in the presence of MGCD0103 (3 μmol/l) or VPA (4 mmol/l), with or without chloroquine (CQ; 20 μmol/l), bafilomycin A1 (Baf; 20 nmol/l), 3-MA (1 mmol/l), bortezomib (Bort; 2 nmol/l) or Q-VD-OPh (Q-VD; 10 μmol/l). Caspase and proteasome inhibitors were added to PBMCs 1 h before and autophagy inhibitors 1 h after MGCD0103 or VPA. Two representative blots (c and d) from five independent experiments are shown. The levels of indicated proteins were analyzed by immunoblotting, using ACTB as a loading control. The expression levels of proteins in treated cells relative to the untreated control and normalized to ACTB levels are indicated.
Figure 4
Figure 4
MGCD0103 modulates autophagy gene expression at the transcriptional level in primary CLL cells. Screening for autophagy gene expression in PBMCs incubated with or without MGCD0103 for 24 h was performed using an autophagy PCR array. Results represent the mean values of four independent experiments. (a) The scatter plot graphs the expression level (2-ΔCt) of each gene in the control sample versus the MGCD0103 (3 μmol/l) sample. The black line indicates fold changes (2-ΔΔCt) of 1. The pink lines indicate a fold change of 2 in gene expression. (b) Histograms represent the fold up- or downregulation of relative gene expression in primary CLL cells incubated with MGCD0103 (0.5 and 3 μmol/l) for 24 h. When fold change values are >1, the fold regulation is equal to the fold change. When fold change values are <1, the fold regulation is the negative inverse of the fold change. *P<0.05, **P<0.01 and ***P<0.001.
Figure 5
Figure 5
MGCD0103-induced inhibition of autophagy is specific to primary CLL cells. (a) PBMCs from healthy donors (n=3) were incubated with or without MGCD0103 (0.5 or 3 μmol/l) and/or chloroquine (CQ; 20 μmol/l) for 24 h. (b, c) The effect of MGCD0103 on autophagy was assessed in cell lines. Cells were incubated with or without MGCD0103 (3 μmol/l) and/or Q-VD-OPh (10 μmol/l for CLL patient PBMCs and 20 μmol/l for cell lines) for 24 h (PBMC, JVM-2 and JVM-3) or 48 h (Mec-1 and MCF-7), and/or chloroquine (CQ; 40 μmol/l) for 24 h. The levels of indicated proteins were analyzed by immunoblotting using ACTB as a loading control. Representative blots from at least three independent experiments are shown in each panel.
Figure 6
Figure 6
Inhibition of autophagy decreases primary CLL cell viability. (a) PBMCs from CLL patients (n=5) were incubated with varying concentrations of chloroquine or 3-MA for 48 h. Viability was determined by a CCK-8 colorimetric assay. Each sample was run in triplicate and was normalized to cells incubated without drug. Data represent the mean values±s.d. (bd) PBMCs from CLL patients were transfected with autophagy gene-specific or nontargeting scrambled siRNA as indicated. Viability of CLL cells was assessed by flow cytometry following Annexin V-APC/PI staining. Results obtained with three different patient samples at (b) 24 h, (c) 48 h and (d) 72 h after transfection are shown. Viable cells (Annexin V-APC neg/PI neg cells) are represented and expressed relative to scrambled siRNA control, set at 100% viability. Expression levels of targeted genes were analyzed by real-time reverse transcription (RT)-PCR and were normalized to the 28S ribosomal RNA level of the same sample. RT-PCR values are expressed as relative fold change to the scrambled siRNA condition.
Figure 7
Figure 7
The combination of HDAC inhibitors and autophagy inhibitors synergistically/additively kills CLL cells at clinically relevant concentrations. Combination analyses were performed following the median-effect method. PBMCs from CLL patients (n=5) were exposed to an HDAC inhibitor (MGCD0103 (MGCD) or VPA) and an autophagy inhibitor (chloroquine (CQ) or 3-MA) simultaneously for 48 h. Various concentrations of HDAC inhibitors (shown as blue dots or red squares, and increasing from left to right along the x axis) were combined with fixed doses of CQ (5 and 10 μmol/l) or 3-MA (0.3 and 0.6 mmol/l). (a, b) The concentrations of MGCD0103 used for these experiments were (in μmol/l) 0.05, 0.1, 0.2, 0.4, 0.8 and 1.6, and (c, d) those of VPA were (in mmol/l) 0.25, 0.5, 1, 2, 4 and 8. CIs for different levels of cell death (fraction affected) were calculated using the CompuSyn software. CI<1, CI=1 and CI>1 indicate synergism, additive effect and antagonism, respectively.

References

    1. Zenz T, Mertens D, Kuppers R, Dohner H, Stilgenbauer S. From pathogenesis to treatment of chronic lymphocytic leukaemia. Nat Rev Cancer. 2010;10:37–50. - PubMed
    1. Burger JA. Targeting the microenvironment in chronic lymphocytic leukemia is changing the therapeutic landscape. Curr Opin Oncol. 2012;24:643–649. - PubMed
    1. Rikiishi H. Autophagic and apoptotic effects of HDAC inhibitors on cancer cells. J Biomed Biotechnol. 2011;2011:830260. - PMC - PubMed
    1. True O, Matthias P. Interplay between histone deacetylases and autophagy—from cancer therapy to neurodegeneration. Immunol Cell Biol. 2012;90:78–84. - PubMed
    1. Gammoh N, Lam D, Puente C, Ganley I, Marks PA, Jiang X. Role of autophagy in histone deacetylase inhibitor-induced apoptotic and nonapoptotic cell death. Proc Natl Acad Sci USA. 2012;109:6561–6565. - PMC - PubMed

Publication types

MeSH terms