. 2014 Feb;42(2):368-87.
doi: 10.1007/s10439-013-0922-3. Epub 2013 Oct 12.

Computational biorheology of human blood flow in health and disease

Affiliations

Computational biorheology of human blood flow in health and disease

Dmitry A Fedosov et al. Ann Biomed Eng. 2014 Feb.

Abstract

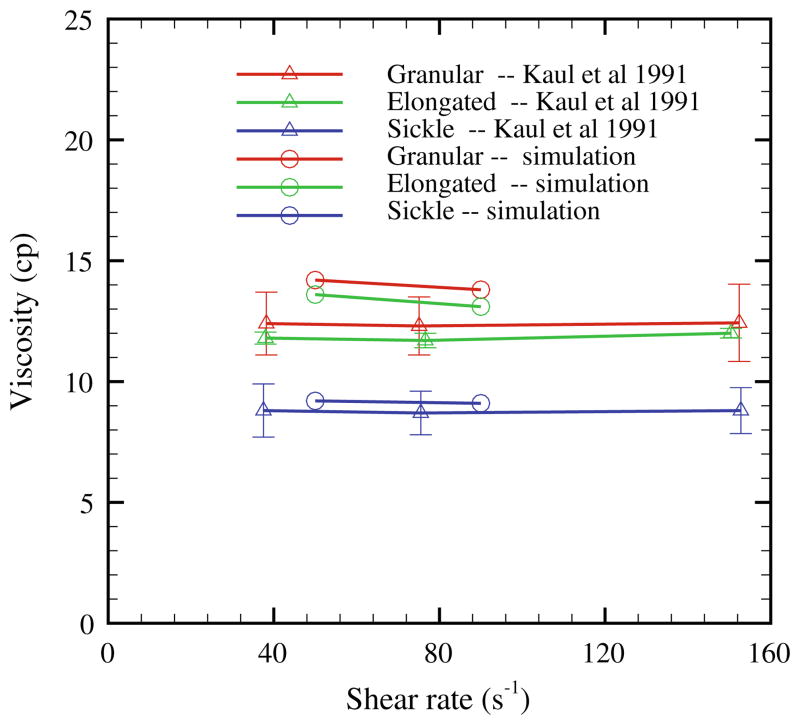
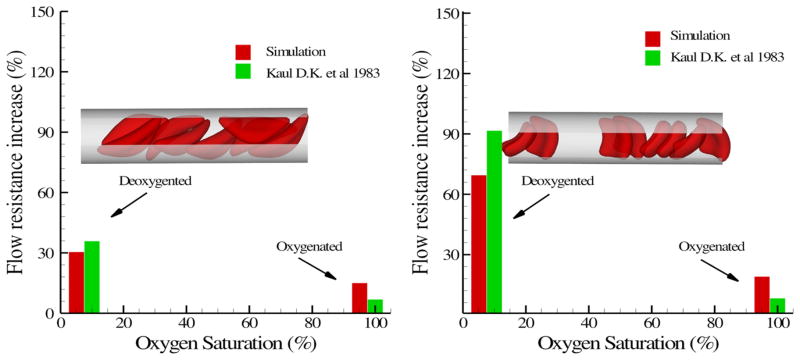
Hematologic disorders arising from infectious diseases, hereditary factors and environmental influences can lead to, and can be influenced by, significant changes in the shape, mechanical and physical properties of red blood cells (RBCs), and the biorheology of blood flow. Hence, modeling of hematologic disorders should take into account the multiphase nature of blood flow, especially in arterioles and capillaries. We present here an overview of a general computational framework based on dissipative particle dynamics (DPD) which has broad applicability in cell biophysics with implications for diagnostics, therapeutics and drug efficacy assessments for a wide variety of human diseases. This computational approach, validated by independent experimental results, is capable of modeling the biorheology of whole blood and its individual components during blood flow so as to investigate cell mechanistic processes in health and disease. DPD is a Lagrangian method that can be derived from systematic coarse-graining of molecular dynamics but can scale efficiently up to arterioles and can also be used to model RBCs down to the spectrin level. We start from experimental measurements of a single RBC to extract the relevant biophysical parameters, using single-cell measurements involving such methods as optical tweezers, atomic force microscopy and micropipette aspiration, and cell-population experiments involving microfluidic devices. We then use these validated RBC models to predict the biorheological behavior of whole blood in healthy or pathological states, and compare the simulations with experimental results involving apparent viscosity and other relevant parameters. While the approach discussed here is sufficiently general to address a broad spectrum of hematologic disorders including certain types of cancer, this paper specifically deals with results obtained using this computational framework for blood flow in malaria and sickle cell anemia.


Figures

FIGURE 1
FIGURE 1
A simulation snapshot of blood flow (RBCs only) in a tube of a diameter D = 20 μm and at tube hematocrit Ht = 0.45. The thin layer between the RBC core and the tube walls is the cell-free layer.
FIGURE 2
FIGURE 2
(a) Ratio of tube (Ht) to the discharge (Hd) hematocrit, and (b) Relative apparent viscosity (ηrel), for different Ht values and tube diameters D. The symbols correspond to the DPD simulations in Lei et al., while the curves are the fits to experimental data. The figure is adopted with permission from Lei et al.
FIGURE 3
FIGURE 3
Cell-free layer thickness for different hematocrits and tube diameters. The figure is adopted with permission from Pan et al.
FIGURE 4
FIGURE 4
(a) Local hematocrit values in blood flow across the tube for different Ht values and tube diameters. (b) Local RBC deformation in tube flow characterized by the largest eigenvalue (λmax) of the RBC gyration tensor for different tube diameters and Ht values. The horizontal dashed line denotes the equilibrium value of λmax equal to approximately 4.77. The figure is adopted with permission from Lei et al.
FIGURE 5
FIGURE 5
A simulation snapshot showing sample RBC-rouleaux structures in equilibrium.
FIGURE 6
FIGURE 6
Non-Newtonian relative viscosity of blood (the cell suspension viscosity divided by the solvent viscosity) as a function of shear rate at Ht = 0.45. The simulation curves are: dashed—whole blood model; solid—non-aggregating RBC suspension. The experimental data are as follows: Whole blood: green crosses—Merril et al., black circles—Chien et al., black squares—Skalak et al. Non-aggregating RBC suspension: red circles—Chien et al., red squares—Skalak et al.. The insets show simulation snapshots at different shear rates. The figure is reproduced with permission from Fedosov et al.
FIGURE 7
FIGURE 7
Casson plots for the extrapolated yield stress (using a polynomial fit) for simulated MS-RBC suspensions with and without aggregations at Ht = 0.45. The figure is reproduced with permission from Fedosov et al.
FIGURE 8
FIGURE 8
WBC center-of-mass distribution for various Ht values. The position y is normalized by the width of a channel W such that y = 0 corresponds to the wall position and y/W = 0.25 to the WBC radius. The figure is reproduced with permission from Fedosov et al.
FIGURE 9
FIGURE 9
Probability diagram of WBC margination for various flow rates characterized by a non-dimensional shear rate γ̇* and Ht values. The WBC is assumed to be rigid. The “○” symbols correspond to the simulations performed. The figure is reproduced with permission from Fedosov et al.
FIGURE 10
FIGURE 10
(a) Experimental images of ring-stage P. falciparum-infected (red arrows) and uninfected (blue arrows) RBCs in the channels at a pressure gradient of 0.24 Pa/μm. The small fluorescent dot inside the infected cell is the GFP-transfected parasite. At 8.3 s, it is clear that the uninfected cell moved about twice as far as each infected cell. (b) DPD simulation images of P. falciparum-infected RBCs traveling in channels of converging (left) and diverging (right) opening geometry at 0.48 Pa/μm. The figure is reproduced with permission from Bow et al.
FIGURE 11
FIGURE 11
Average velocity of uninfected and ring-stage malaria infected RBCs as a function of pressure gradient and comparison of simulation and experimental results. Results are for diverging (a) and converging (b) geometries. The figure is reproduced with permission from Bow et al.
FIGURE 12
FIGURE 12
Flow resistance in malaria: (a) Healthy (red) and Pf-RBCs (blue) in Poiseuille flow in a tube of diameter D = 20 μm. Ht = 0.45, parasitemia level 25%. Plotted is the relative apparent viscosity of blood in malaria for various parasitemia levels and tube diameters. Symbol “x” corresponds to the schizont stage with a near-spherical shape. Experimental data from the empirical fit by Pries et al. The figure is reproduced with permission from Fedosov et al. (b) Bulk viscosity vs. parasitemia level for 30% hematocrit using a Couette device setup at shear rate 230 s−1. The square symbols are measurements from Raventos-Suarez et al. and the triangles are simulations of Huan Lei (Brown University).
FIGURE 13
FIGURE 13
Shear viscosity of the sickle blood flow with different cell morphologies reported in Kaul et al., Hct = 40%; the simulation data are from Lei and Karniadakis.
FIGURE 14
FIGURE 14
Increase of the flow resistance induced by the sickle blood flow for both sickle (left) and granular (right) shapes. The inset plot shows a snapshot of the sickle cells in the tube flow. The figure is reproduced with permission from Lei and Karniadakis.

References

    1. Abbitt KB, Nash GB. Rheological properties of the blood influencing selectin-mediated adhesion of flowing leukocytes. Am J Physiol. 2003;285:H229–H240. - PubMed
    1. Abkarian M, Faivre M, Viallat A. Swinging of red blood cells under shear flow. Phys Rev Lett. 2007;98:188302. - PubMed
    1. Abkarian M, Faivre M, Horton R, Smistrup K, Best-Popescu CA, Stone HA. Cellular-scale hydrodynamics. Biomed Mater. 2008;3:034011. - PubMed
    1. Abkarian M, Lartigue C, Viallat A. Tank treading and unbinding of deformable vesicles in shear flow: determination of the lift force. Phys Rev Lett. 2002;88:068103. - PubMed
    1. Alizadehrad D, Imai Y, Nakaaki K, Ishikawa T, Yamaguchi T. Quantification of red blood cell deformation at high-hematocrit blood flow in microvessels. J Biomech. 2012;45:2684–2689. - PubMed

Publication types

MeSH terms

LinkOut - more resources