

Noncontrast mapping of arterial delay and functional connectivity using resting-state functional MRI: a study in Moyamoya patients
- PMID: 24419985
- PMCID: PMC4096618
- DOI: 10.1002/jmri.24558
Noncontrast mapping of arterial delay and functional connectivity using resting-state functional MRI: a study in Moyamoya patients
Abstract
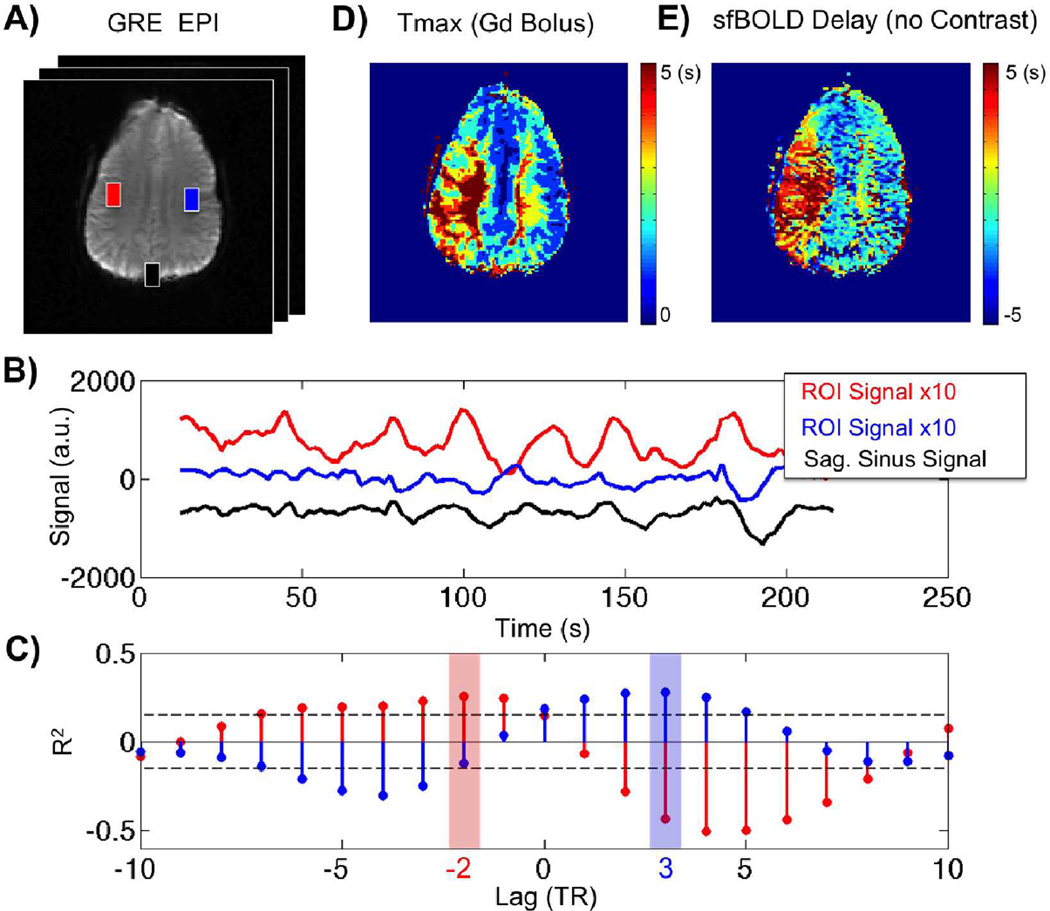
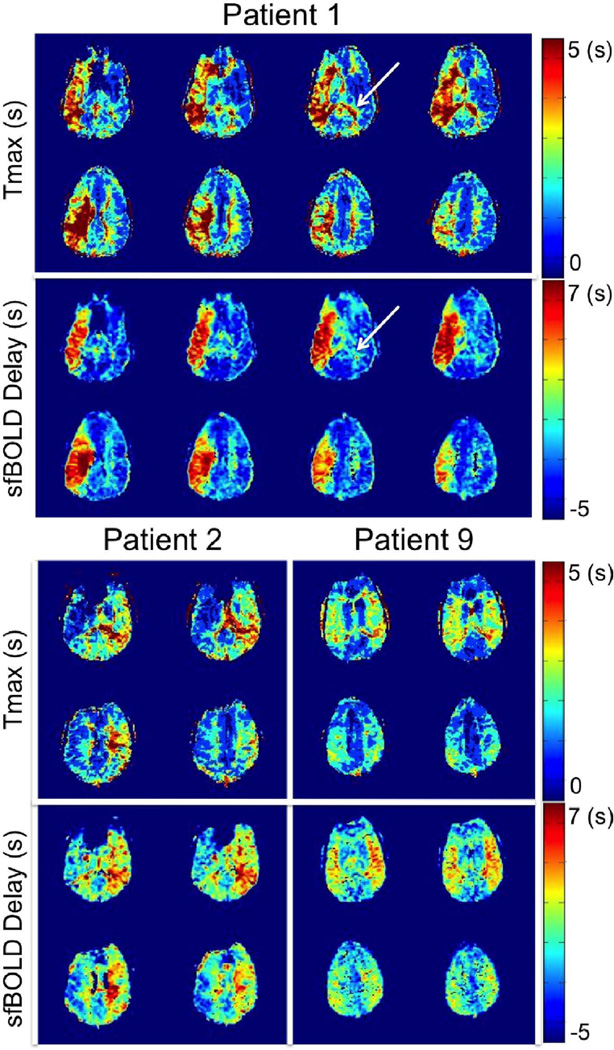
Purpose: To investigate if delays in resting-state spontaneous fluctuations of the BOLD (sfBOLD) signal can be used to create maps similar to time-to-maximum of the residue function (Tmax) in Moyamoya patients and to determine whether sfBOLD delays affect the results of brain connectivity mapping.
Materials and methods: Ten patients were scanned at 3 Tesla using a gradient-echo echo planar imaging sequence for sfBOLD imaging. Cross correlation analysis was performed between each brain voxel signal and a reference signal comprised of either the superior sagittal sinus (SSS) or whole brain (WB) average time course. sfBOLD delay maps were created based on the time shift necessary to maximize the correlation coefficient, and compared with dynamic susceptibility contrast Tmax maps. Standard and time-shifted resting-state BOLD connectivity analyses of the default mode network were compared.
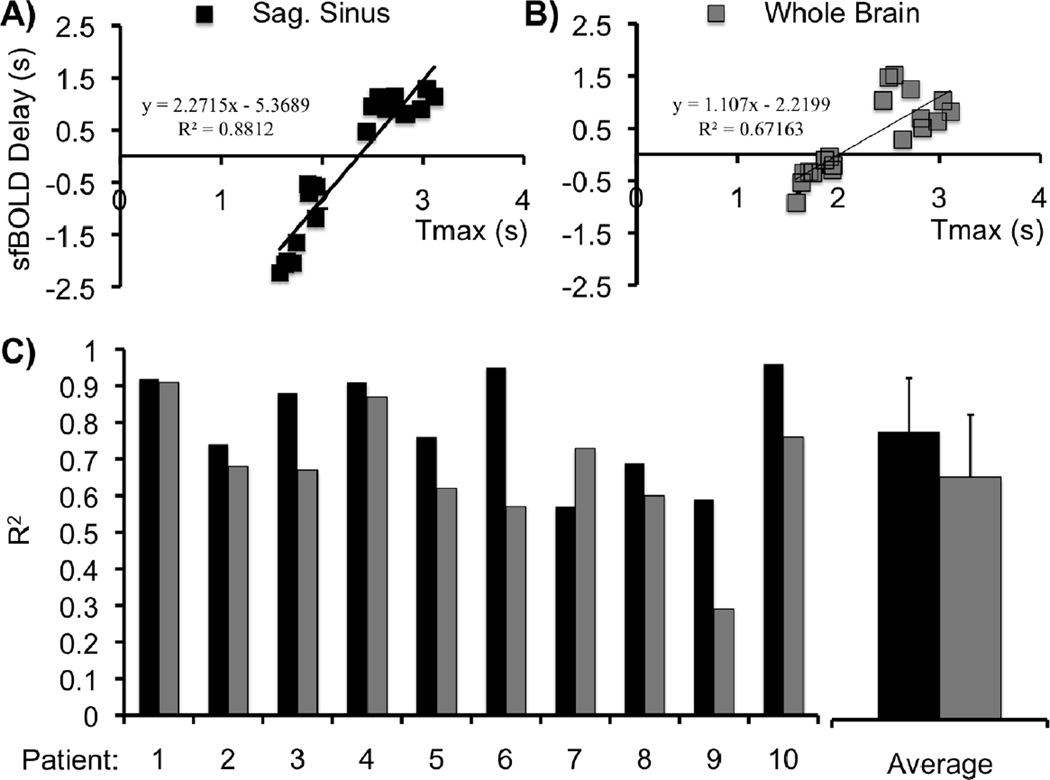
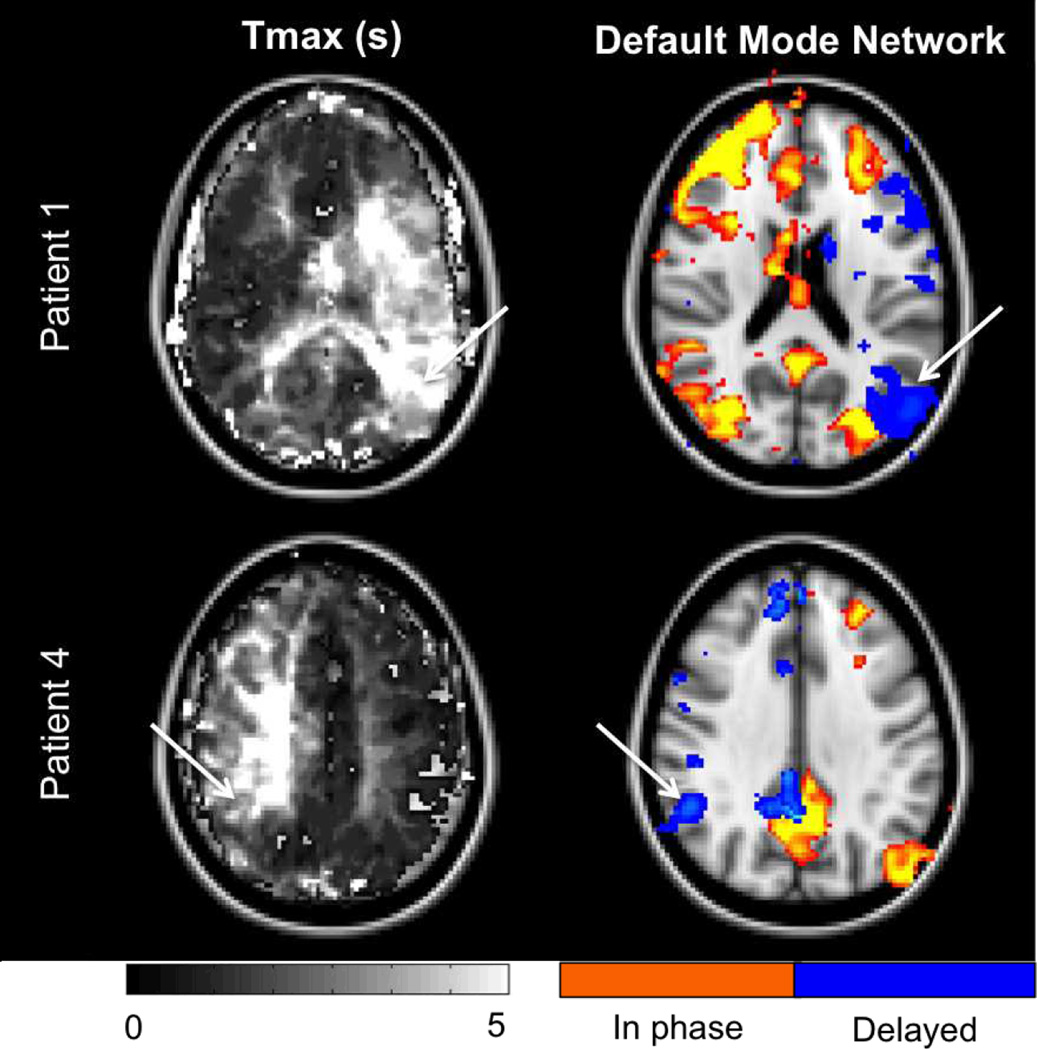
Results: Good linear correlations were found between sfBOLD delays and Tmax using the SSS as reference (r(2) = 0.8, slope = 1.4, intercept = -4.6) or WB (r(2) = 0.7, slope = 0.8, intercept = -3.2). New nodes of connectivity were found in delayed regions when accounting for delays in the analysis.
Conclusion: Resting-state sfBOLD imaging can create delay maps similar to Tmax maps without the use of contrast agents in Moyamoya patients. Accounting for these delays may affect the results of functional connectivity maps.
Keywords: BOLD contrast; MRI; Moyamoya disease; functional connectivity; perfusion; resting-state fMRI.
© 2014 Wiley Periodicals, Inc.
Conflict of interest statement
Figures
References
-
- Fox MD, Raichle ME. Spontaneous fluctuations in brain activity observed with functional magnetic resonance imaging. Nat Rev Neurosci. 2007 Sep;8(9):700–711. - PubMed
-
- Van den Heuvel MP, Hulshoff Pol HE. Exploring the brain network: a review on resting-state fMRI functional connectivity. Eur Neuropsychopharmacol J Eur Coll Neuropsychopharmacol. 2010 Aug;20(8):519–534. - PubMed
-
- De Luca M, Beckmann CF, De Stefano N, Matthews PM, Smith SM. fMRI resting state networks define distinct modes of long-distance interactions in the human brain. NeuroImage. 2006 Feb 15;29(4):1359–1367. - PubMed
-
- Glover GH, Li TQ, Ress D. Image-based method for retrospective correction of physiological motion effects in fMRI: RETROICOR. Magn Reson Med Off J Soc Magn Reson Med Soc Magn Reson Med. 2000 Jul;44(1):162–167. - PubMed
-
- Lv Y, Margulies DS, Cameron Craddock R, Long X, Winter B, Gierhake D, et al. Identifying the perfusion deficit in acute stroke with resting-state functional magnetic resonance imaging. Ann Neurol. 2013 Jan;73(1):136–140. - PubMed
Publication types
MeSH terms
Substances
Grants and funding
LinkOut - more resources
Full Text Sources
Other Literature Sources
Medical
