. 2014 Feb;20(1):39-53.
doi: 10.1007/s13365-013-0227-1. Epub 2014 Jan 14.

Antiretroviral drugs induce oxidative stress and neuronal damage in the central nervous system

Affiliations

Antiretroviral drugs induce oxidative stress and neuronal damage in the central nervous system

Cagla Akay et al. J Neurovirol. 2014 Feb.

Erratum in

Abstract

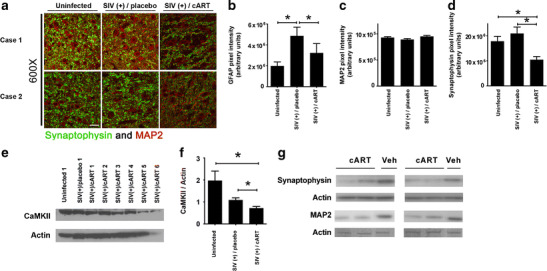
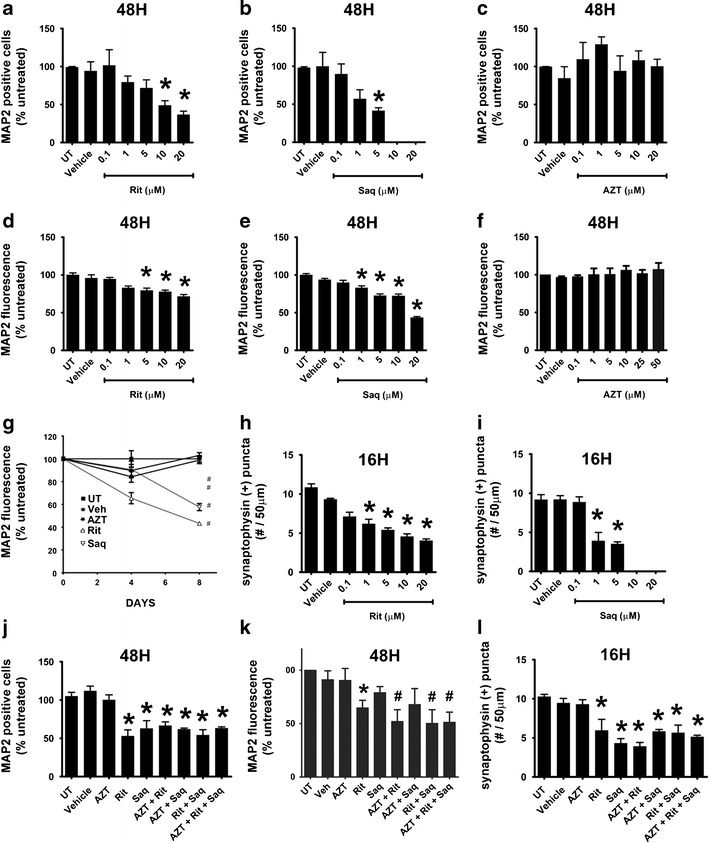
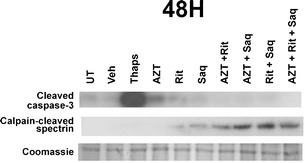
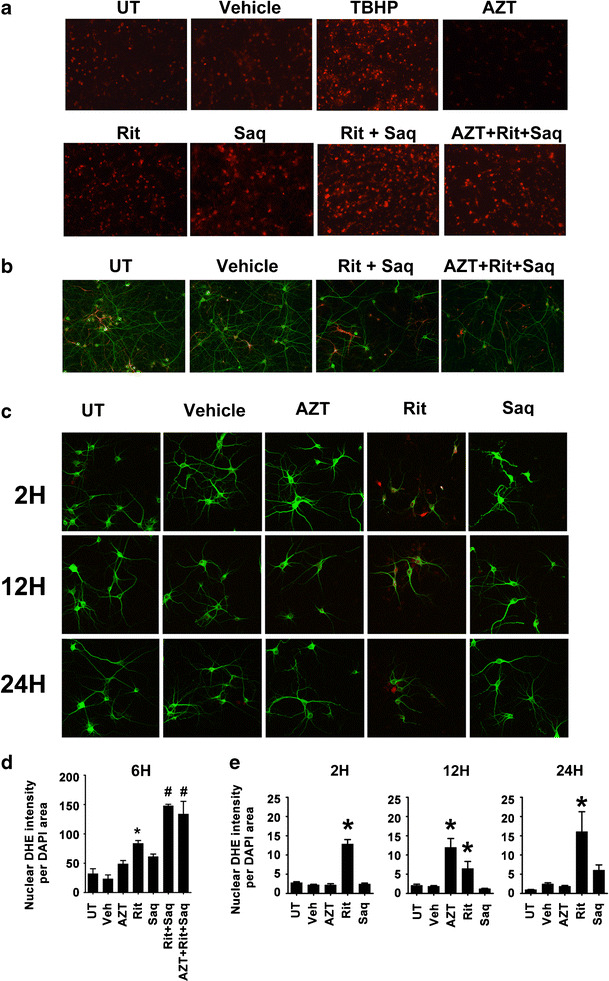
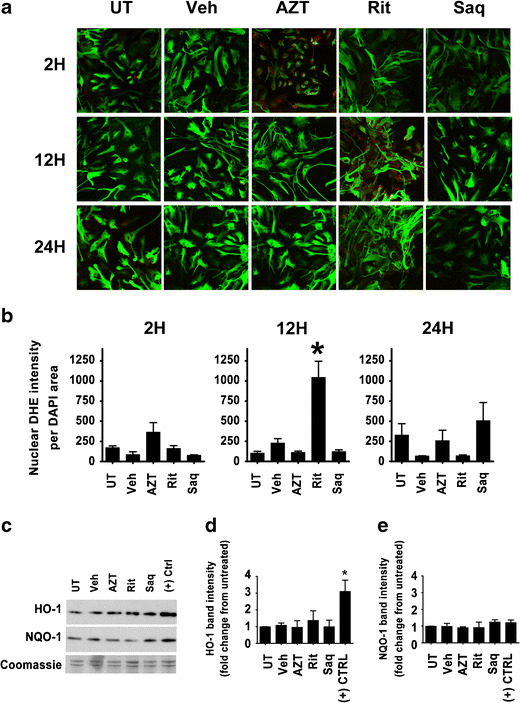
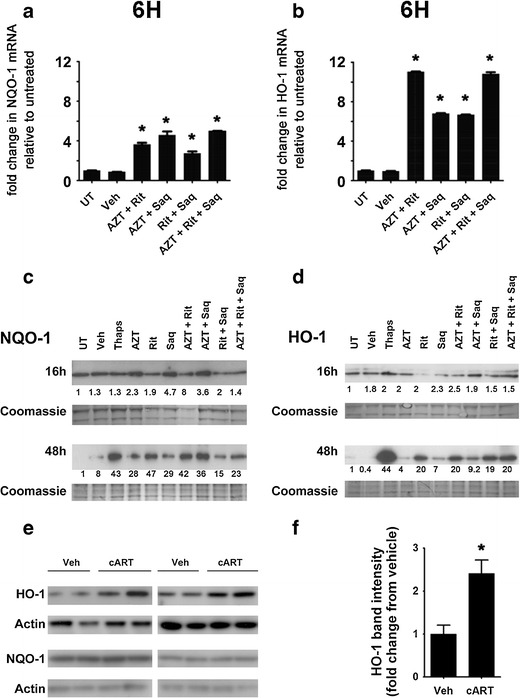
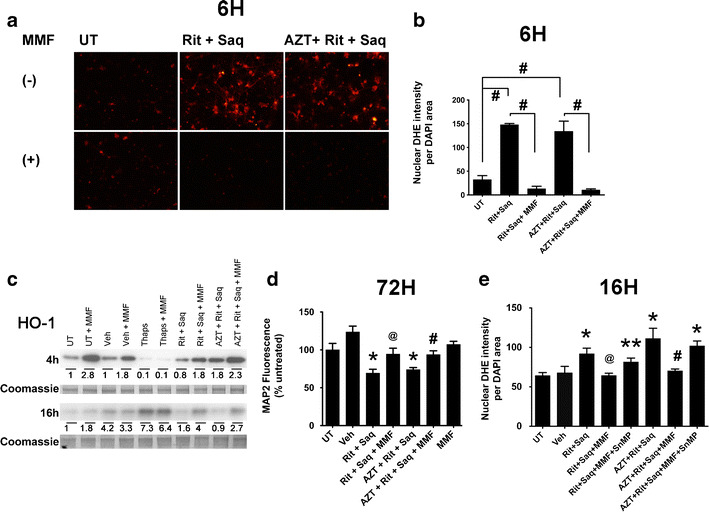
HIV-associated neurocognitive disorder (HAND), characterized by a wide spectrum of behavioral, cognitive, and motor dysfunctions, continues to affect approximately 50 % of HIV(+) patients despite the success of combination antiretroviral drug therapy (cART) in the periphery. Of note, potential toxicity of antiretroviral drugs in the central nervous system (CNS) remains remarkably underexplored and may contribute to the persistence of HAND in the cART era. Previous studies have shown antiretrovirals (ARVs) to be neurotoxic in the peripheral nervous system in vivo and in peripheral neurons in vitro. Alterations in lipid and protein metabolism, mitochondrial damage, and oxidative stress all play a role in peripheral ARV neurotoxicity. We hypothesized that ARVs also induce cellular stresses in the CNS, ultimately leading to neuronal damage and contributing to the changing clinical and pathological picture seen in HIV-positive patients in the cART era. In this report, we show that ARVs are neurotoxic in the CNS in both pigtail macaques and rats in vivo. Furthermore, in vitro, ARVs lead to accumulation of reactive oxygen species (ROS), and ultimately induction of neuronal damage and death. Whereas ARVs alone caused some activation of the endogenous antioxidant response in vitro, augmentation of this response by a fumaric acid ester, monomethyl fumarate (MMF), blocked ARV-induced ROS generation, and neuronal damage/death. These findings implicate oxidative stress as a contributor to the underlying mechanisms of ARV-induced neurotoxicity and will provide an access point for adjunctive therapies to complement ARV therapy and reduce neurotoxicity in this patient population.


Conflict of interest statement

All authors declare that they have no conflict of interest.

Figures

Fig. 1
Fig. 1
Antiretroviral drugs induce neuronal damage in vivo. ad Formalin-fixed, paraffin-embedded tissue sections from hippocampus of pig-tailed macaques that were either uninfected (n = 6), SIV infected but not cART treated (n = 7), or SIV infected and treated with cART (tenofovir, atazanavir, saquinavir, and L-870812a; n = 4) were prepared for immunofluorescent analysis and were triple labeled for MAP2 (red), synaptophysin (green), and GFAP. Sections were visualized by laser confocal microscopy and images were quantified for MAP2, synaptophysin and GFAP expression. a Representative composite images of two cases per group which were stained with MAP2 and synaptophysin are shown. Scale bar = 30 μm. b Quantification shows the resolution of GFAP immunoreactivity in SIV(+)/cART group, compared with SIV(+)/placebo group (one-way ANOVA, *p < 0.05). No changes were observed in MAP2 expression between groups (c), but there were statistically significant decreases in synaptophysin immunoreactivity (d) in SIV(+)/cART group, as compared with SIV(+)/untreated and uninfected groups (one-way ANOVA, *p < 0.05, ns not significant). e, f Fresh-frozen tissue sections from the frontal cortex of pig-tailed macaques that were either uninfected (n = 3), SIV infected but not cART treated (n = 6), or SIV infected and cART treated (n = 6) were used for standard protein extraction and subsequent immunoblotting for the expression of CaMKII. Actin was used as a loading control. A representative immunoblot is shown. Quantification shows statistically significant decreases in CaMKII in the cART-treated group, as compared with the uninfected group or the SIV(+)/untreated group (one-way ANOVA, *p < 0.05). g Whole cell lysates prepared from hippocampus of rats treated for 7 days with AZT/Rit/Saq (n = 4) or vehicle (n = 2) were immunoblotted for synaptophysin and MAP2. A band from the coomassie blue staining is included to control for equal loading and protein degradation
Fig. 2
Fig. 2
Therapeutically relevant combination antiretroviral drug treatments are neurotoxic in vitro. ac Primary rat cortical neuroglial cultures aged 21 days in vitro (DIV) on coverslips were exposed to Rit (a), Saq (b), or AZT (c) at increasing doses for 48 h, followed by hand counting for MAP2-positive cells (n = 3; vehicle, 0.04 % DMSO; * p < 0.05, one-way ANOVA with post-hoc Newman–Keuls). df 21DIV primary neuroglial cultures grown in 96-well plates were treated with increasing doses of Rit (d), Saq (e), or AZT (f) for 48 h, followed by MAP2 cell-based ELISA (n = 2; vehicle, 0.04 % DMSO; * p < 0.05, one-way ANOVA with post-hoc Newman–Keuls). g Primary neuroglial cultures were treated with AZT (25 μM), Rit (10 μM), or Saq (1 μM) at day zero. Ninety percent of the media was changed with conditioned media supplemented with a fresh drug stock every 2 days, and cultures were analyzed by MAP2 cell-based ELISA at days 4 and 8 (n = 2; vehicle, 0.04 % DMSO; * p < 0.05, one-way ANOVA with post-hoc Newman–Keuls). h, i Cultures grown on coverslips were exposed to the indicated treatments and synaptophysin-positive puncta were determined (n = 3; vehicle, 0.04 % DMSO; * p < 0.05, one-way ANOVA with post-hoc Newman–Keuls). j, k Primary neuroglial cultures were exposed to the indicated drug combinations (AZT, 25 μm; Rit, 10 μm; Saq, 1 μm) for 48 h, followed by hand counting for MAP2-positive cells (j) or MAP2 cell-based ELISA (k) (n = 2; vehicle,: 0.04 % DMSO; * p < 0.05; # p < 0.01, one-way ANOVA with post-hoc Newman–Keuls). l Primary neuroglial cultures that were exposed to the indicated drug combinations (AZT, 25 μm; Rit, 10 μm; Saq, 1 μm) for 16 h were analyzed for synaptophysin-positive puncta (n = 2; vehicle, 0.04 % DMSO; * p < 0.05, one-way ANOVA with post-hoc Newman–Keuls)
Fig. 3
Fig. 3
Activation of Calpain in antiretroviral drug-treated neurons. Whole cell lysates were prepared from neuroglial cultures treated with the indicated single or combination drugs (AZT, 25 μm; Rit, 10 μm; Saq, 1 μm), or with Thapsigargin (1 μM) as a positive control, for 48 h. Calpain activation was assessed using an antibody to detect the accumulation of calpain-cleaved spectrin and an antibody raised against the cleaved and active form of caspase-3 was used for detection of caspase activity. A band revealed by coomassie staining of the gel was used as a loading control (n = 2; vehicle, 0.04 % DMSO)
Fig. 4
Fig. 4
Combination antiretroviral drug treatments induce oxidative stress in neurons. a, d Cortical neuroglial cultures grown on coverslips were treated for 6 h with the indicated drugs (AZT, 25 μm; Rit, 10 μm; Saq, 1 μm) and the presence of ROS was detected by DHE staining (red fluorescence). a The images were captured with epifluorescent microscopy with uniform settings. d Quantification of DHE fluorescence was generated by measurement of DHE pixel intensity per DAPI area (n = 3; *p < 0.05; #p < 0.01, one-way ANOVA, post-hoc Newman–Keuls). b Cortical neuroglial cultures grown on coverslips for 21 days and exposed to the indicated treatments (AZT, 25 μm; Rit, 10 μm; Saq, 1 μm) were immunofluorescently labeled for MAP2 (green) and GFAP (red). Note that the cultures are enriched for neurons; c 21 DIV pure cortical neuronal cultures grown on coverslips were treated with AZT (25 μm), Rit (10 μm), or Saq (1 μm) for 2, 12, or 24 h. The presence of ROS was detected by DHE staining (red fluorescence) and MAP2 was used to stain neurons (green fluorescence). e The images captured with confocal microscopy with uniform settings were analyzed for DHE pixel intensity per DAPI area (n = 3; *p < 0.05, one-way ANOVA, post-hoc Newman–Keuls)
Fig. 5
Fig. 5
Antiretroviral drugs do not induce an endogenous antioxidant response in astrocytes. a Pure astrocytic cultures grown on coverslips were treated with AZT (25 μm), Rit (10 μm), or Saq (1 μm) for 2, 12, or 24 h. The accumulation of ROS was detected by DHE staining (red fluorescence) and GFAP was used to label astrocytes (green fluorescence). b The images captured with confocal microscopy with uniform settings were analyzed for DHE pixel intensity per DAPI area (n = 3; * p < 0.05, One-Way ANOVA, post-hoc Newman–Keuls). ce Whole cell lysates from pure astrocytic cultures treated with the indicated drugs (AZT, 25 μm; Rit, 10 μm; Saq, 1 μm) for 16 h were immunoblotted for HO-1 and NQO-1. Representative blots from three independent experiments are shown in (c). Coomassie staining of gels were used as loading controls and fold changes over untreated lysates were determined. The quantification of HO-1 and NQO-1 band intensities from three independent experiments is shown in (d) and (e) (n = 3; *p < 0.05, one-way ANOVA, post-hoc Newman–Keuls)
Fig. 6
Fig. 6
Combination antiretroviral drug treatments induce the endogenous antioxidant response in primary neuroglial cultures. a, b Cortical neuroglial cultures were exposed to the indicated treatments (AZT, 25 μm; Rit, 10 μm; Saq, 1 μm) for 6 h to determine changes in NQO-1 (a) and HO-1 (b) mRNA levels. A representative of three experiments is shown. Actin was used as internal control and fold changes were determined by the ΔΔCT method (*p < 0.0001, one-way ANOVA, post-hoc Newman–Keuls). c, d Whole cell lysates from cortical neuroglial cultures treated with the indicated drug combinations (AZT, 25 μm; Rit, 10 μm; Saq, 1 μm) for 16 and 48 h were immunoblotted for NQO-1 (c) and HO-1 (d). Representative blots from three independent experiments are shown. Coomassie staining of gels were used as loading controls and fold changes over untreated lysates are indicated below each band of interest. e, f Whole cell lysates prepared from hippocampus of rats treated for 7 days with AZT/Rit/Saq (n = 4) or vehicle (n = 2) were immunoblotted for HO-1 and NQO-1 (e) and fold change in HO-1 protein levels in the cART group compared with the vehicle group is shown (f) (*p < 0.05, Student's t test)
Fig. 7
Fig. 7
MMF induces activation of a cellular antioxidant response and blocks neuronal damage/death. a In the absence (top) or presence (bottom) of MMF (100 μM), 21 DIV rat neuroglial cultures on coverslips were treated for 6 h with Rit/Saq or AZT/Rit/Saq (AZT, 25 μm; Rit, 10 μm; Saq, 1 μm) or were left untreated. ROS generation was detected by DHE staining (red fluorescence). b Quantification of nuclear DHE was done as described above (n = 3; *p < 0.01, one-way ANOVA with post-hoc Newman–Keuls). c Whole cell lysates of cultures exposed to Rit/Saq or AZT/Rit/Saq treatments (AZT, 25 μm; Rit, 10 μm; Saq, 1 μm) in the absence or presence of MMF (100 μM) for 4 or 16 h were immunoblotted for HO-1. A representative blot from three independent experiments is shown. A coomassie band from the gel was used as loading control. Quantification of band intensities is shown under each corresponding lane. d Primary cortical neuroglial cultures were either pretreated with MMF (100 μM) for 30 min or received no pretreatment; cultures were then treated with Rit/Saq or AZT/Rit/Saq (AZT, 25 μm; Rit, 10 μm; Saq, 1 μm) for 72 h to assess neuronal damage/death by MAP2 ELISA (n = 3; vehicle = 0.04 % DMSO; *p < 0.05 vs. untreated; @p < 0.05 vs. Rit/Saq; #p < 0.05 vs. AZT/Rit/Saq, one-way ANOVA with post-hoc Newman–Keuls). e Primary cortical neuroglial cultures were preincubated with SnMP (20 μM) and/or MMF (100 μM) for 30 min before the addition of the indicated antiretroviral drugs (AZT, 25 μm; Rit, 10 μm; Saq, 1 μm) and were assessed for nuclear DHE accumulation at 16 (n = 3; *p < 0.01 vs. untreated; **p < 0.05 vs. untreated; @p < 0.01 vs. Rit/Saq; #p < 0.05 vs. AZT/Rit/Saq, one-way ANOVA with post-hoc Newman–Keuls)

Similar articles

Cited by

References

    1. Akay C, Lindl KA, Shyam N, Nabet B, Goenaga-Vazquez Y, Ruzbarsky J, Wang Y, Kolson DL, Jordan-Sciutto KL (2011a) Activation status of integrated stress response pathways in neurons and astrocytes of HAND cortex. Neuropathol Appl Neurobiol 118(6):1113–1123 - PMC - PubMed
    1. Akay C, Lindl KA, Wang Y, White MG, Isaacman-Beck J, Kolson DL, Jordan-Sciutto KL (2011b) Site-specific hyperphosphorylation of pRb in HIV-induced neurotoxicity. Mol Cell Neurosci 47:154–165 - PMC - PubMed
    1. Ances BM, Roc AC, Korczykowski M, Wolf RL, Kolson DL (2008) Combination antiretroviral therapy modulates the blood oxygen level-dependent amplitude in human immunodeficiency virus-seropositive patients. J Neurovirol 14:418–424 - PMC - PubMed
    1. Anderson PL, Rower JE (2010) Zidovudine and lamivudine for HIV infection. Clin Med Rev Ther 2:a2004 - PMC - PubMed
    1. Anonymous (2011) Trial watch: phase III success for Biogen’s oral multiple sclerosis therapy. Nature Reviews Drug Discovery 10:404 - PubMed

Publication types

MeSH terms

Substances