. 2014 Apr;63(4):827-38.
doi: 10.1161/HYPERTENSIONAHA.113.02637. Epub 2014 Jan 13.

Base-resolution maps of 5-methylcytosine and 5-hydroxymethylcytosine in Dahl S rats: effect of salt and genomic sequence

Affiliations

Base-resolution maps of 5-methylcytosine and 5-hydroxymethylcytosine in Dahl S rats: effect of salt and genomic sequence

Yong Liu et al. Hypertension. 2014 Apr.

Abstract

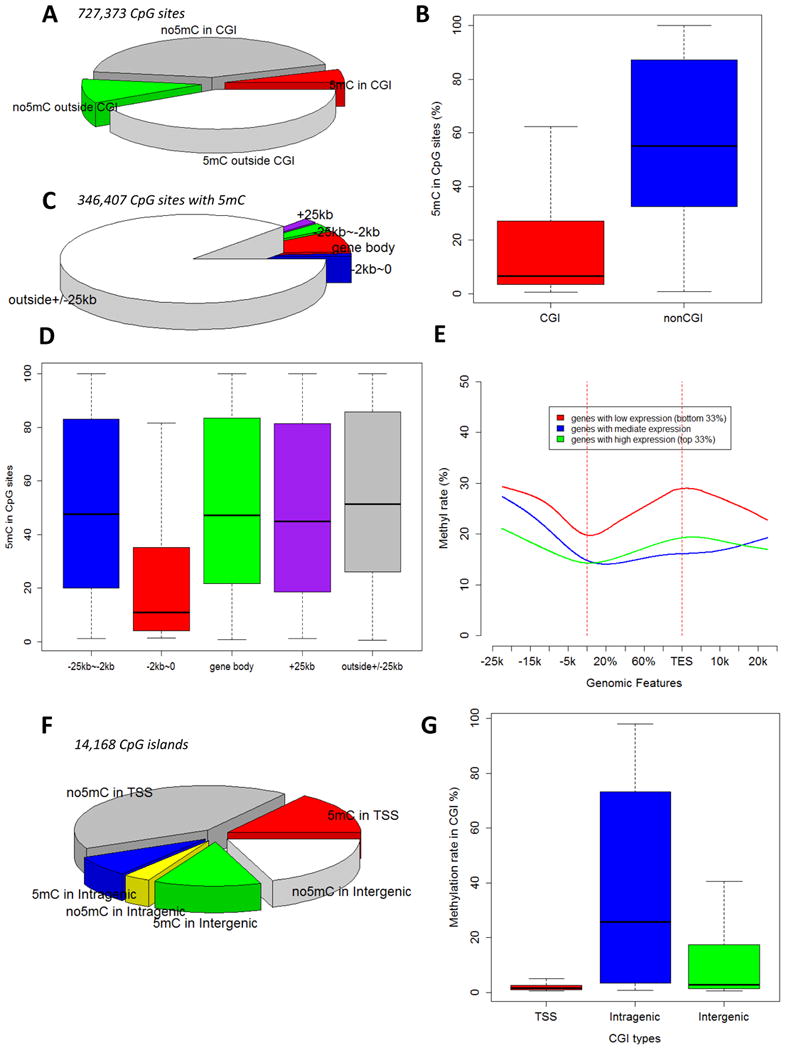
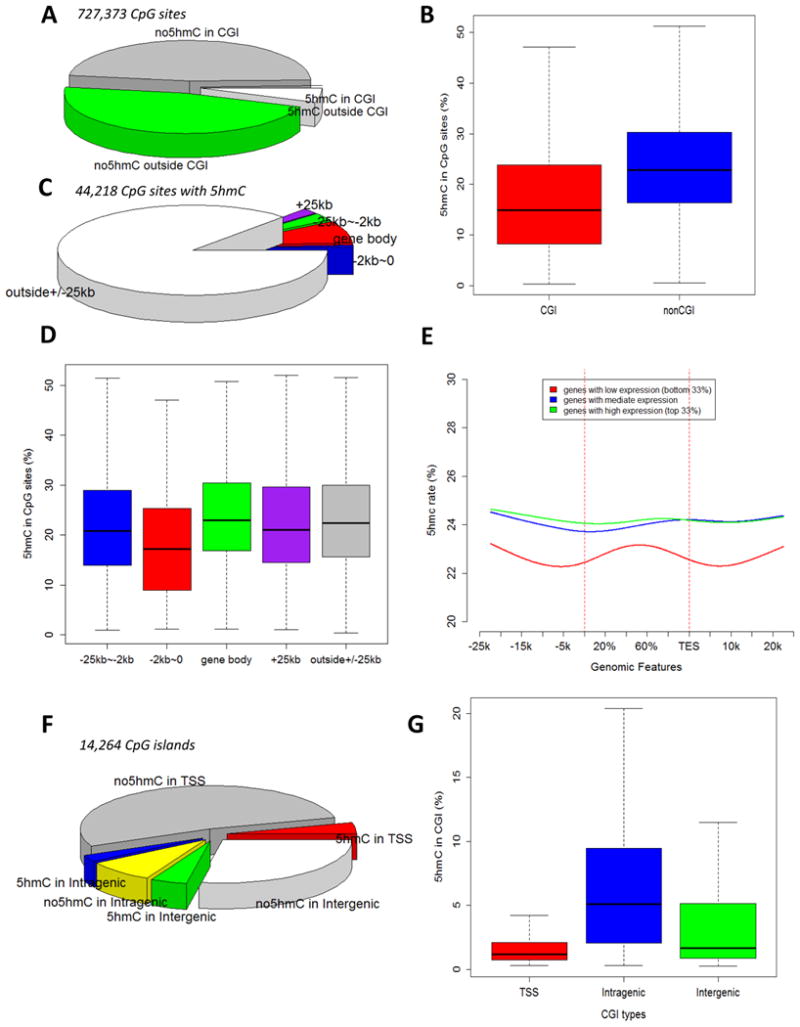
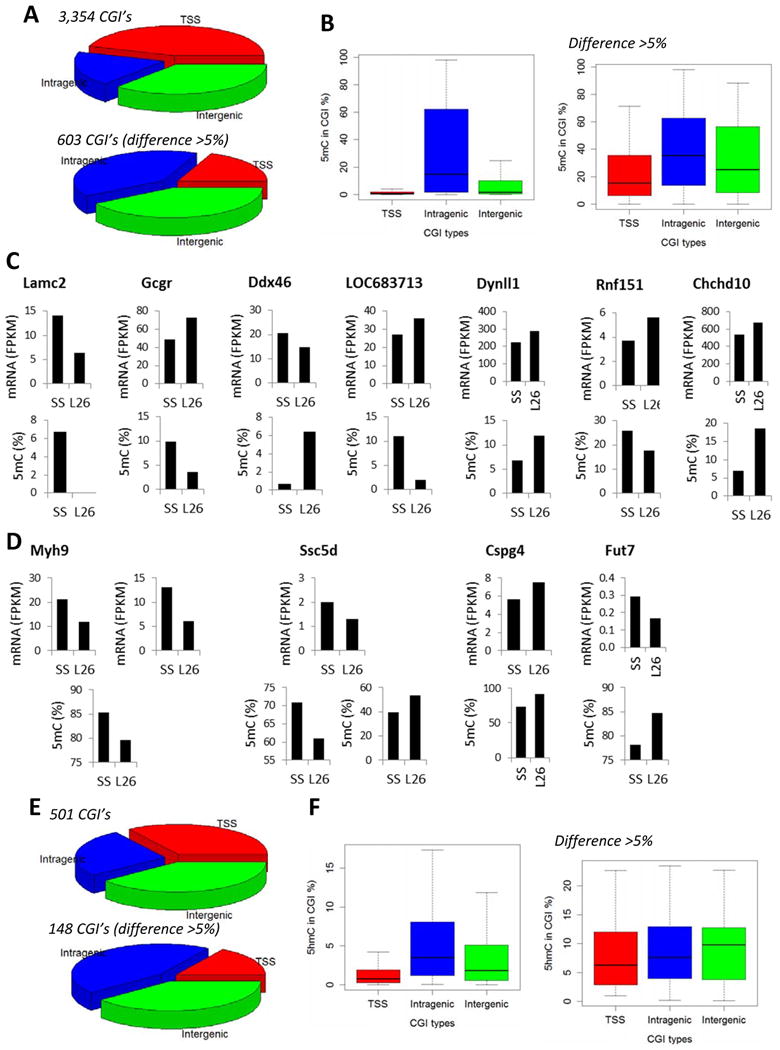
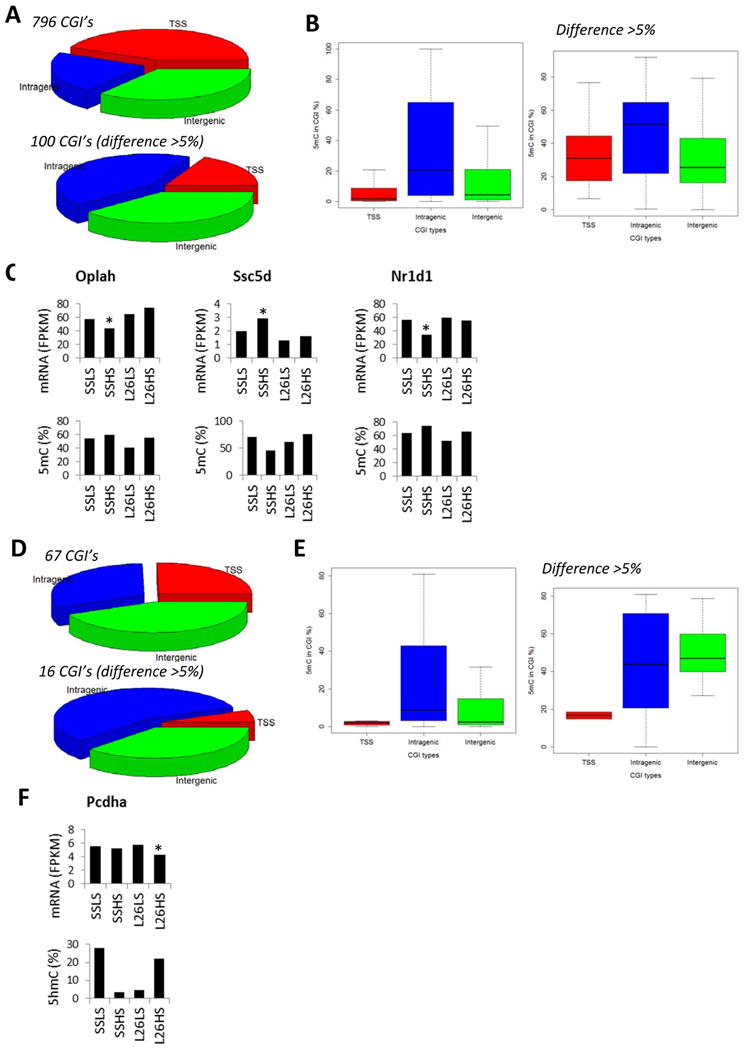
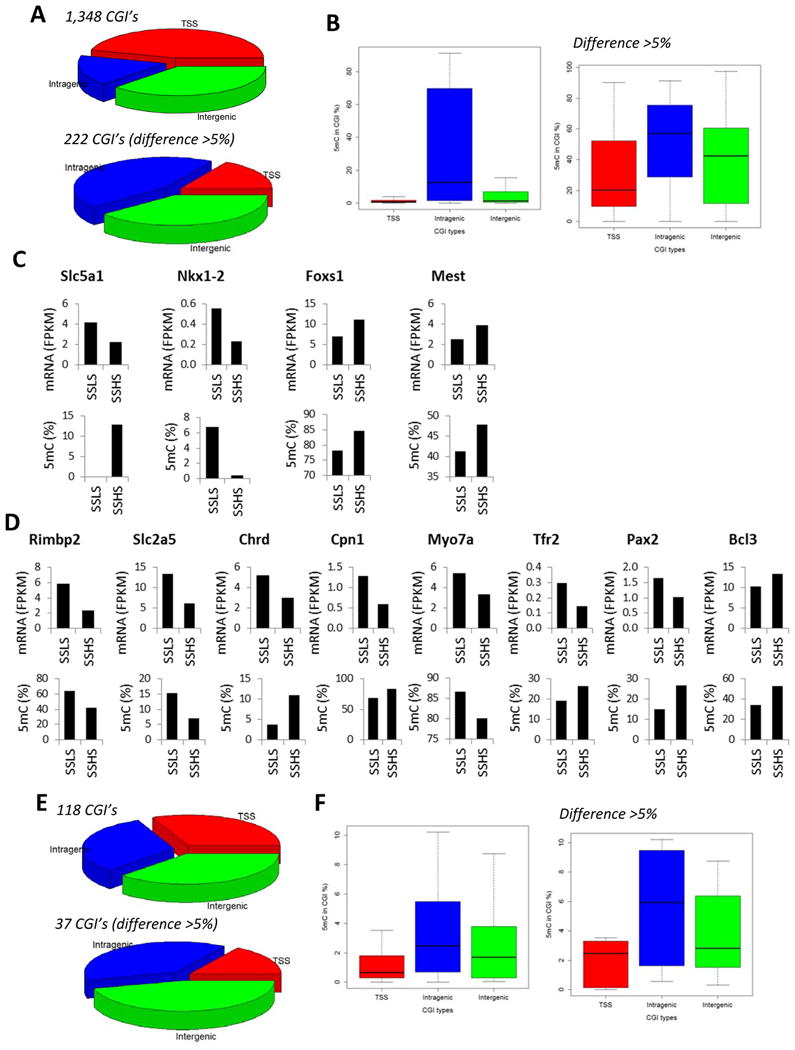
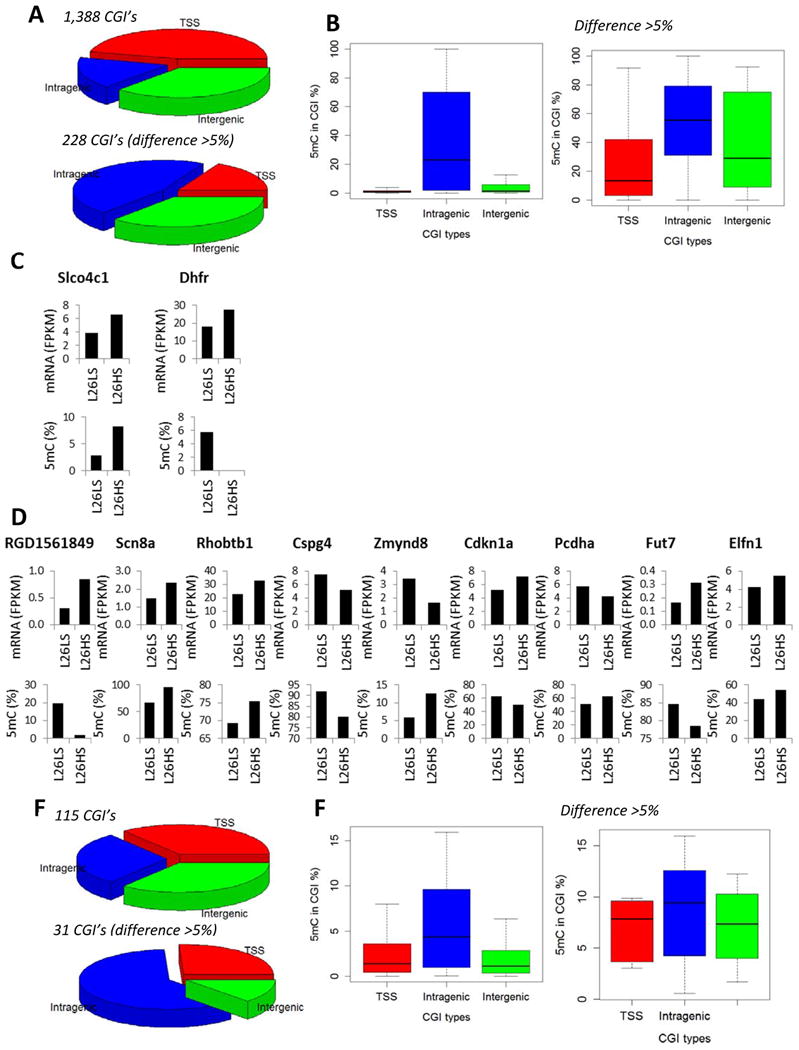
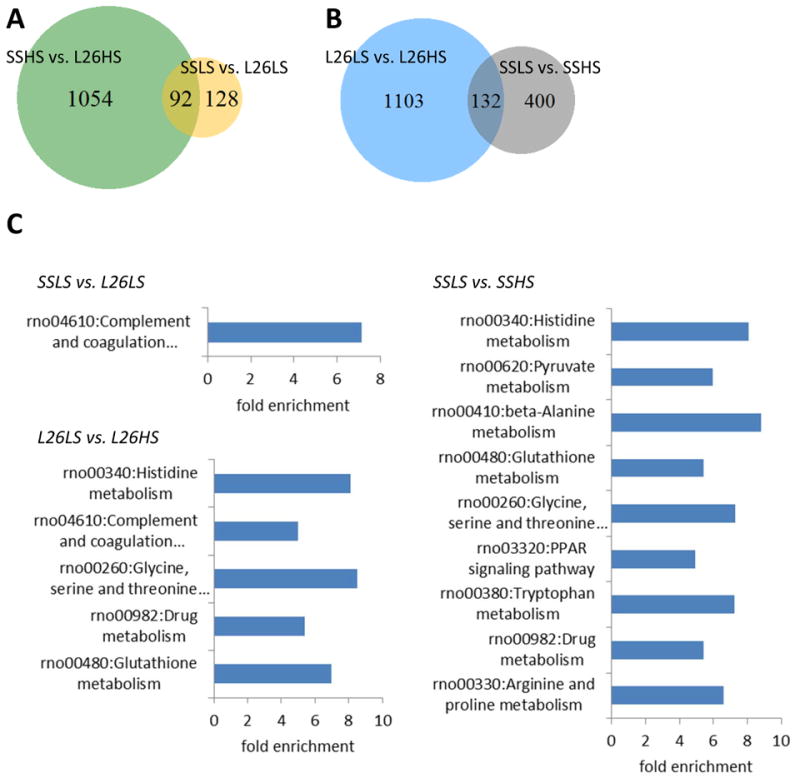
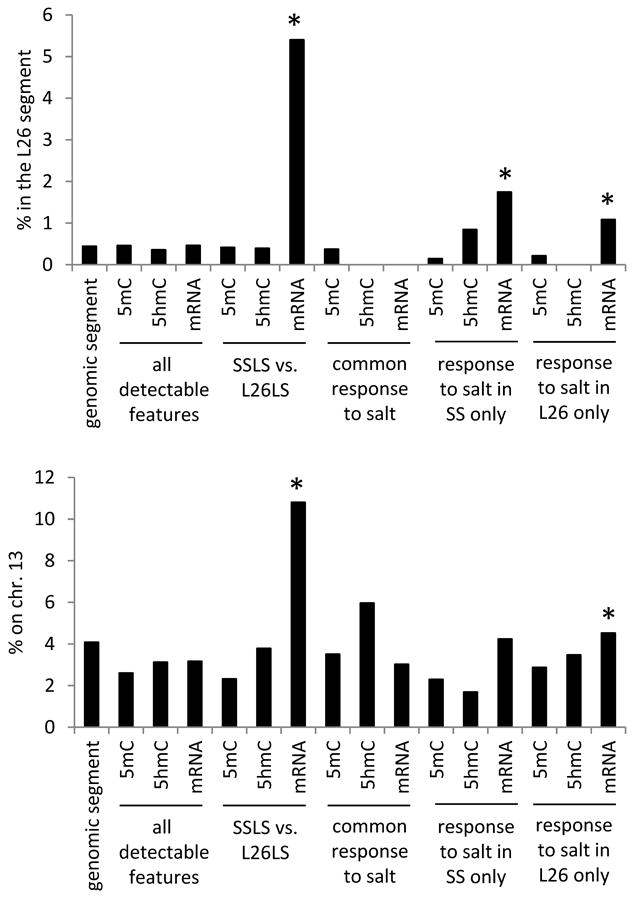
Analysis of 5-hydroxymethylcytosine (5hmC) at single-base resolution has been largely limited to studies of stem cells or developmental stages. Given the potential importance of epigenetic events in hypertension, we have analyzed 5hmC and 5-methylcytosine (5mC) at single-base resolution in the renal outer medulla of the Dahl salt-sensitive rat and examined the effect of disease-relevant genetic or environmental alterations on 5hmC and 5mC patterns. Of CpG sites that fell within CpG islands, 11% and 1% contained significant 5mC and 5hmC, respectively. 5mC levels were substantially higher for genes with lower mRNA abundance and showed a prominent nadir around the transcription start site. In contrast, 5hmC levels were higher in genes with higher expression. Substitution of a 12.9-Mbp region of chromosome 13, which attenuates the hypertensive and renal injury phenotypes in salt-sensitive rats, or exposure to a high-salt diet, which accelerates the disease phenotypes, was associated with differential 5mC or 5hmC in several hundred CpG islands. Nearly 80% of the CpG islands that were differentially methylated in response to salt and associated with differential mRNA abundance were intragenic CpG islands. The substituted genomic segment had significant cis effects on mRNA abundance but not on DNA methylation. The study established base-resolution maps of 5mC and 5hmC in an in vivo model of disease and revealed several characteristics of 5mC and 5hmC important for understanding the role of epigenetic modifications in the regulation of organ systems function and complex diseases.

Keywords: DNA methylation; epigenenomics; genomics; hypertension; kidney.


Figures

Figure 1
Figure 1. 5mC patterns in the renal outer medulla of SS rats
A. Distribution of CpG sites (covered by at least 20 reads) with or without significant 5mC in and outside of CpG islands. B. 5mC rates of CpG sites that contained significant 5mC. C. Distribution of 5mC-containing CpG sites relative to gene bodies. D. 5mC rates of 5mC-containing CpG sites categorized by their spatial relationship with gene bodies. E. 5mC rates across gene body and 25 kbp up- or down-stream of gene body and the relationship with mRNA abundance. 5mC rates were calculated based on CpG sites in 2 kbp windows moving at 100 bp steps. Genes were divided into three groups according to mRNA abundance levels. F. Distribution of CpG islands with or without significant 5mC in transcription start site (+/- 1 kbp), intragenic, and intergenic regions. G. 5mC rates of CpG islands located in the three regions. CGI, CpG island; TSS, transcription start site region.
Figure 2
Figure 2. 5hmC patterns in the renal outer medulla of SS rats
A. Distribution of CpG sites (covered by at least 20 reads) with or without significant 5hmC in and outside of CpG islands (CGI). B. 5hmC rates of CpG sites that contained significant 5hmC. C. Distribution of 5hmC-containing CpG sites relative to gene bodies. D. 5hmC rates of 5hmC-containing CpG sites categorized by their spatial relationship with gene bodies. E. 5hmC rates across gene body and 25 kbp up- or down-stream of gene body and the relationship with mRNA abundance. 5hmC rates were calculated based on CpG sites in 2 kbp windows moving at 100 bp steps. Genes were divided into three groups according to mRNA abundance levels. F. Distribution of CpG islands with or without significant 5hmC in transcription start site (TSS +/- 1 kbp), intragenic, and intergenic regions. G. 5hmC rates of CpG islands located in the three regions.
Figure 3
Figure 3. Effect of a chromosome 13 segment substitution on 5mC and 5hmC patterns
A. Distribution of CpG islands (CGI) containing differential 5mC levels between SS and SS.13BN26 rats. The rats were maintained on a 0.4% NaCl diet. The top graph represented CpG islands with FDR < 0.05. The bottom graph represented CpG islands with FDR < 0.05 and difference > 5% 5mC rate. B. 5mC rates of CpG islands containing differential 5mC levels between SS and SS.13BN26 rats. C. Genes showing differential 5mC in CpG islands in transcription start site regions and differential mRNA expression between SS and SS.13BN26 rats. L26 represents SS.13BN26 rats. D. Genes showing differential 5mC in CpG islands in intragenic regions and differential mRNA expression between SS and SS.13BN26 rats. E. Distribution of CpG islands containing differential 5hmC levels between SS and SS.13BN26 rats. The top graph represented CpG islands with FDR < 0.05. The bottom graph represented CpG islands with FDR < 0.05 and difference > 5% 5hmC rate. F 5hmC rates of CpG islands containing differential 5hmC levels between SS and SS.13BN26 rats.
Figure 4
Figure 4. 5mC and 5hmC altered by a high-salt diet in both SS and SS.13BN26 rats
A. Distribution of CpG islands of which 5mC levels were altered by 7 days of a 4% NaCl diet in both SS and SS.13BN26 rats. The top graph represented CpG islands with FDR < 0.05. The bottom graph represented CpG islands with FDR < 0.05 and difference > 5% 5mC rate. B. 5mC rates of CpG islands of which 5mC levels were altered by 7 days of a 4% NaCl diet in both SS and SS.13BN26 rats. C. Genes showing differential 5mC in CpG islands in intragenic regions in response to the high-salt diet in both SS and SS.13BN26 rats and differential mRNA expression in at least one of the rat strains. D. Distribution of CpG islands of which 5hmC levels were altered by 7 days of a 4% NaCl diet in both SS and SS.13BN26 rats. The top graph represented CpG islands with FDR < 0.05. The bottom graph represented CpG islands with FDR < 0.05 and difference > 5% 5hmC rate. E. 5hmC rates of CpG islands of which 5hmC levels were altered by 7 days of a 4% NaCl diet in both SS and SS.13BN26 rats. F. A gene showing differential 5hmC in a CpG island in the intragenic region in response to the high-salt diet in both SS and SS.13BN26 rats and differential mRNA expression in SS.13BN26. L26, SS.13BN26 rat; LS, 0.4% NaCl diet; HS, 7 days of 4% NaCl diet. *, P<0.05 vs the LS group of the same strain.
Figure 5
Figure 5. 5mC and 5hmC altered by a high-salt diet in SS rats, but not in SS.13BN26 rats
A. Distribution of CpG islands of which 5mC levels were altered by 7 days of a 4% NaCl diet in SS rats, but not in SS.13BN26 rats. The top graph represented CpG islands with FDR < 0.05. The bottom graph represented CpG islands with FDR < 0.05 and difference > 5% 5mC rate. B. 5mC rates of CpG islands of which 5mC levels were altered by 7 days of a 4% NaCl diet in SS rats, but not in SS.13BN26 rats. C. Genes showing differential 5mC in CpG islands in transcription start site regions in response to the high-salt diet in in SS rats, but not in SS.13BN26 rats, and differential mRNA expression in SS rats. D. Genes showing differential 5mC in CpG islands in intragenic regions in response to the high-salt diet in SS rats, but not in SS.13BN26 rats, and differential mRNA expression in SS rats. E. Distribution of CpG islands of which 5hmC levels were altered by 7 days of a 4% NaCl diet in SS rats, but not in SS.13BN26 rats. The top graph represented CpG islands with FDR < 0.05. The bottom graph represented CpG islands with FDR < 0.05 and difference > 5% 5hmC rate. F. 5hmC rates of CpG islands of which 5hmC levels were altered by 7 days of a 4% NaCl diet in SS rats, but not in SS.13BN26 rats. LS, 0.4% NaCl diet; HS, 7 days of 4% NaCl diet.
Figure 6
Figure 6. 5mC and 5hmC altered by a high-salt diet in SS.13BN26 rats, but not in SS rats
A. Distribution of CpG islands of which 5mC levels were altered by 7 days of a 4% NaCl diet in SS.13BN26 rats, but not in SS rats. The top graph represented CpG islands with FDR < 0.05. The bottom graph represented CpG islands with FDR < 0.05 and difference > 5% 5mC rate. B. 5mC rates of CpG islands of which 5mC levels were altered by 7 days of a 4% NaCl diet in SS.13BN26 rats, but not in SS rats. C. Genes showing differential 5mC in CpG islands in transcription start site regions in response to the high-salt diet in SS.13BN26 rats, but not in SS rats, and differential mRNA expression in SS.13BN26 rats. D. Genes showing differential 5mC in CpG islands in intragenic regions in response to the high-salt diet in SS.13BN26 rats, but not in SS rats, and differential mRNA expression in SS.13BN26 rats. E. Distribution of CpG islands of which 5hmC levels were altered by 7 days of a 4% NaCl diet in SS.13BN26 rats, but not in SS rats. The top graph represented CpG islands with FDR < 0.05. The bottom graph represented CpG islands with FDR < 0.05 and difference > 5% 5hmC rate. F. 5hmC rates of CpG islands of which 5hmC levels were altered by 7 days of a 4% NaCl diet in SS.13BN26 rats, but not in SS rats. L26, SS.13BN26 rat; LS, 0.4% NaCl diet; HS, 7 days of 4% NaCl diet.
Figure 7
Figure 7. Transcriptome differences between SS and SS.13BN26 rats on 0.4% or 4% NaCl diet
A. The numbers of genes differentially expressed between SS and SS.13BN26 rats maintained on a 0.4% NaCl diet or switched to a 4% NaCl diet for 7 days. B. The numbers of genes differentially expressed in SS or SS.13BN26 rats in response to 7 days of a 4% NaCl diet. C. KEGG pathways significantly enriched (FDR < 0.05) in the differentially expressed genes. L26, SS.13BN26 rat; LS, 0.4% NaCl diet; HS, 7 days of 4% NaCl diet.
Figure 8
Figure 8. Genomic segment enrichment of altered 5mC, 5hmC, and mRNA abundance
The graphs showed percentage of genomic segment, CpG islands, or genes located within the substituted chr. 13 L26 segment (top) or on chr. 13 (bottom). All detected CpG islands with significant 5mC or 5hmC, all expressed genes, CpG islands with differential 5mC or 5hmC, or genes with differential mRNA abundance in the indicated comparisons were examined. L26, SS.13BN26 rat; LS, 0.4% NaCl diet.*, P<0.05 vs. all detectable features (chi-square test).

References

    1. Kotchen TA, Cowley AW, Jr, Frohlich ED. Salt in health and disease--a delicate balance. N Engl J Med. 2013;368:1229–1237. - PubMed
    1. Cowley AW., Jr The genetic dissection of essential hypertension. Nat Rev Genet. 2006;7:829–840. - PubMed
    1. Rapp JP. Genetic analysis of inherited hypertension in the rat. Physiol Rev. 2000;80:135–172. - PubMed
    1. Gopalakrishnan K, Kumarasamy S, Abdul-Majeed S, Kalinoski AL, Morgan EE, Gohara AF, Nauli SM, Filipiak WE, Saunders TL, Joe B. Targeted disruption of Adamts16 gene in a rat genetic model of hypertension. Proc Natl Acad Sci U S A. 2012;109:20555–20559. - PMC - PubMed
    1. Liang M, Cowley AW, Jr, Mattson DL, Kotchen TA, Liu Y. Epigenomics of hypertension. Semin Nephrol. 2013;33:392–399. - PMC - PubMed

Publication types

MeSH terms