. 2014 Mar;65(3):871-84.
doi: 10.1093/jxb/ert444. Epub 2014 Jan 13.

Coordination between zinc and phosphate homeostasis involves the transcription factor PHR1, the phosphate exporter PHO1, and its homologue PHO1;H3 in Arabidopsis

Affiliations

Coordination between zinc and phosphate homeostasis involves the transcription factor PHR1, the phosphate exporter PHO1, and its homologue PHO1;H3 in Arabidopsis

Ghazanfar Abbas Khan et al. J Exp Bot. 2014 Mar.

Abstract

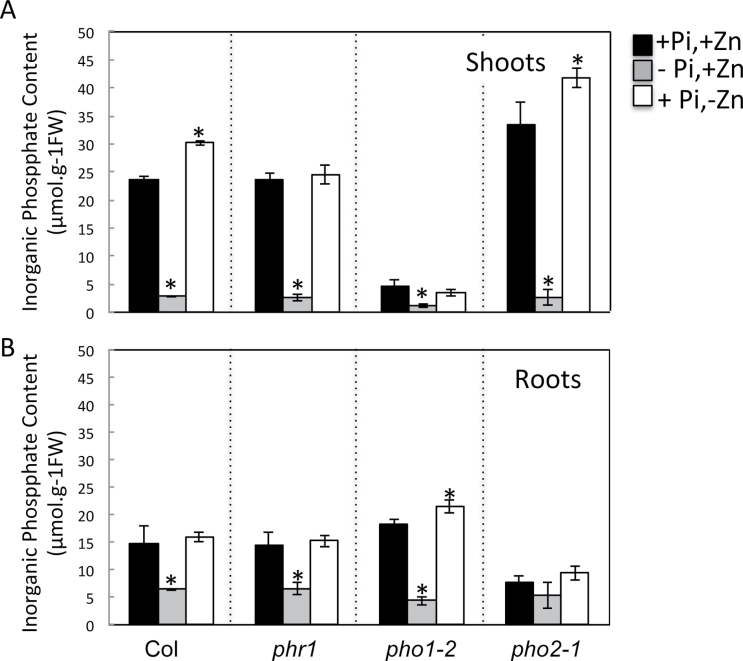
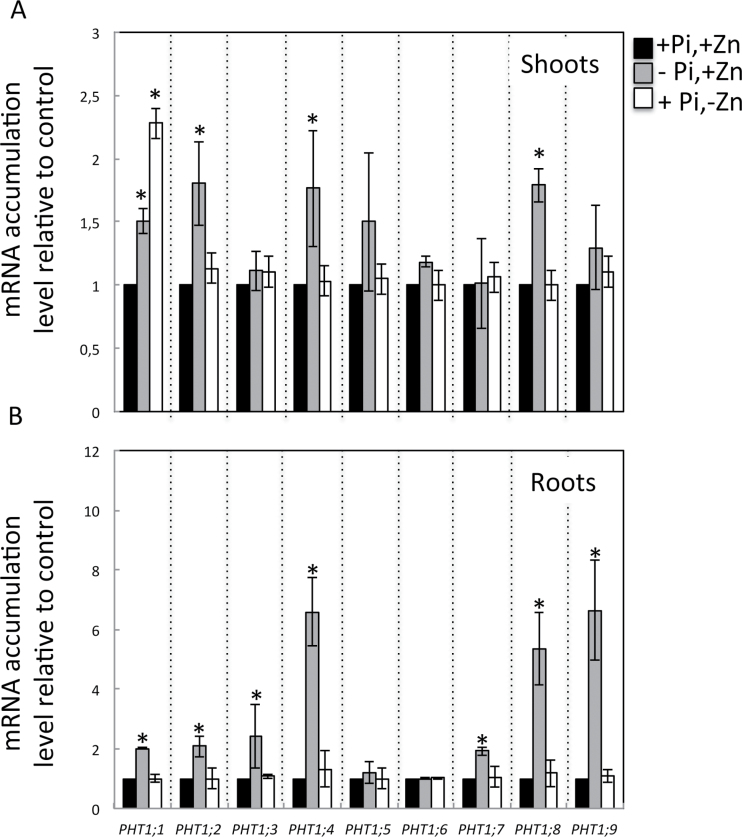
Interactions between zinc (Zn) and phosphate (Pi) nutrition in plants have long been recognized, but little information is available on their molecular bases and biological significance. This work aimed at examining the effects of Zn deficiency on Pi accumulation in Arabidopsis thaliana and uncovering genes involved in the Zn-Pi synergy. Wild-type plants as well as mutants affected in Pi signalling and transport genes, namely the transcription factor PHR1, the E2-conjugase PHO2, and the Pi exporter PHO1, were examined. Zn deficiency caused an increase in shoot Pi content in the wild type as well as in the pho2 mutant, but not in the phr1 or pho1 mutants. This indicated that PHR1 and PHO1 participate in the coregulation of Zn and Pi homeostasis. Zn deprivation had a very limited effect on transcript levels of Pi-starvation-responsive genes such as AT4, IPS1, and microRNA399, or on of members of the high-affinity Pi transporter family PHT1. Interestingly, one of the PHO1 homologues, PHO1;H3, was upregulated in response to Zn deficiency. The expression pattern of PHO1 and PHO1;H3 were similar, both being expressed in cells of the root vascular cylinder and both localized to the Golgi when expressed transiently in tobacco cells. When grown in Zn-free medium, pho1;h3 mutant plants displayed higher Pi contents in the shoots than wild-type plants. This was, however, not observed in a pho1 pho1;h3 double mutant, suggesting that PHO1;H3 restricts root-to-shoot Pi transfer requiring PHO1 function for Pi homeostasis in response to Zn deficiency.

Keywords: Homeostasis; interaction; phosphate; signalling; transport; zinc..


Figures

Fig. 1.
Fig. 1.
Effect of Zn availability on Pi contents in roots and shoots of Arabidopsis. Wild-type and phr1, pho1-2 and pho2-1 mutant plants were grown vertically on agar-solidified media containing 1mM Pi and 15 μM Zn (+Pi,+Zn), 15 μM Zn and no Pi (–Pi,+Zn), or 1mM Pi and no Zn (+Pi,–Zn). Pi concentrations were quantified in shoots (A) and roots (B) of 20-d-old plants. Individual measurements were obtained from the analysis of shoots or roots collected from a pool of at least seven plants. Error bars correspond to standard deviation from three biological replicates. Asterisks indicate statistically significant differences compared to the +Pi,+Zn treatment within each genotype (P < 0.05).
Fig. 2.
Fig. 2.
mRNA accumulation of PHR1, AT4, IPS1, miR399, PHO2, and ZIP5 in response to the availability of Pi and Zn in shoots (A) and roots (B). Wild-type plants were grown vertically for 20 d on agar-solidified media containing 1mM Pi and 15 μM Zn (+Pi,+Zn), 15 μM Zn and no Pi (–Pi,+Zn), or 1mM Pi and no Zn (+Pi,–Zn). mRNA accumulation was quantified by quantitative reverse-transcription PCR. mRNA abundance of PHR1, AT4, IPS1, miR399b, miR399d, PHO2, and ZIP5 was normalized to mRNA abundance of the UBQ10 control gene and expressed as relative values against wild-type plants grown in +Pi,+Zn medium. Individual measurements were obtained from the analysis of shoots or roots collected from a pool of at least 10 plants. Error bars correspond to standard deviation from three biological replicates. Asterisks indicate statistically significant differences compared to the +Pi +Zn treatment for each gene (P <0.05).
Fig. 3.
Fig. 3.
mRNA accumulation of members of the PHT1 high-affinity phosphate transporter family in response to the availability of Pi and Zn in shoots (A) and roots (B). Wild-type plants were grown vertically on agar-solidified media containing 1mM Pi and 15 μM Zn (+Pi,+Zn), 15 μM Zn and no Pi (–Pi,+Zn), or 1mM Pi and no Zn (+Pi,–Zn). Shoots and roots of 20-d-old plants were harvested separately and mRNA accumulation was quantified by quantitative reverse-transcription PCR. mRNA abundance of the PHT1 genes was normalized to the mRNA abundance of the UBQ10 control gene and expressed as relative values against wild-type plants grown in +Pi,+Zn medium. Individual measurements were obtained from the analysis of shoots or roots collected from a pool of at least 12 plants. Error bars correspond to standard deviation from three biological replicates. Asterisks indicate statistically significant differences compared to the +Pi +Zn treatment for each gene (P <0.05).
Fig. 4.
Fig. 4.
mRNA accumulation of members of the PHO1 gene family in response to the availability of Pi and Zn in shoots (A) and roots (B). Wild-type plants were grown in a vertical position on agar-solidified media containing 1mM Pi and 15 μM Zn (+Pi,+Zn), 15 μM Zn and no Pi (–Pi,+Zn), or 1mM Pi and no Zn (+Pi,–Zn). Shoots and roots of 20-d-old plants were separately harvested and mRNA accumulation was quantified by quantitative reverse-transcription PCR. mRNA abundance was normalized to the mRNA abundance of the UBQ10 control gene and expressed as relative values against wild-type plants grown in +Pi,+Zn medium. Individual measurements were obtained from the analysis of shoots or roots collected from a pool of at least 10 plants. Error bars correspond to standard deviation from three biological replicates. Asterisks indicate statistically significant differences compared to the +Pi +Zn treatment for each gene (P <0.05).
Fig. 5.
Fig. 5.
Spatial localization of PHO1;H3 expression. (A) GUS staining of transgenic plants expressing the GUS reporter gene under the control of the PHO1;H3 promoter grown on Zn-free agar medium; GUS expression is detectable in vascular tissues of the petiole (1) and of the primary and secondary roots (1,2), in the mature zone of the root (3), and in the root vascular cylinder (4). (B) GUS activity in plants containing the PHO1:H3 promoter::GUS reporter; plants were grown in Zn-deficient or Zn-sufficient media for 19 d. MU, 4-methylumberlliferyl.
Fig. 6.
Fig. 6.
Expression pattern of PHO1;H3-GFP in Arabidopsis. pho1;h3 mutant was transformed with a PHO1;H3-GFP fusion construct expressed under the PHO1;H3 promoter and fluorescence examined in roots (A–C) and cotyledons (D–F) of 5-d-old seedlings. (A) PHO1;H3-GFP expression (green) in roots, (B) propidium iodine staining of the cell wall of root epidermal and cortical cells (magenta), and (C) overlay of A and B. (D) PHO1;H3-GFP expression (green) in epidermal cells of cotyledon, (E) transmission image, and (F) overlay of D and E. Bars = 20 μm.
Fig. 7.
Fig. 7.
Coexpression of PHO1;H3-GFP with different subcellular markers in tobacco epidermal cells. Tobacco leaves were coinfiltrated with Agrobacterium tumefaciens harbouring PHO1;H3-GFP and the plasma membrane marker CBL1-OFP (A), the ER marker Er-rK-mCherry (B), the Golgi marker ManI-RFP (C), the trans-Golgi marker RFP-SYP61 (D), or PHO1-RFP (E). GFP signal is shown in green in the left panel while mCherry-, RFP- and OFP-signals are shown in magenta in the middle panel as indicated. Colocalization of green and magenta signals appears in white in the right panel. Bars = 10 μm.
Fig. 8.
Fig. 8.
Effect of the availability of Pi and Zn on Pi content in shoots of wild-type and mutant plants. Wild-type, pho1-2, pho1;h3-1, pho1;h3-2, and pho1-2/pho1;h3-1 mutant plants as well as transgenic pho1;h3-1 mutant plants expressing a PHO1;H3::GFP fusion (PHO1;H3c) were grown vertically on agar-solidified media containing 1mM Pi and 15 μM Zn (+Pi,+Zn), 15 μM Zn and no Pi (–Pi,+Zn), or 1mM Pi and no Zn (+Pi,–Zn). Pi concentrations were quantified in shoots of 20-d-old plants. Individual measurements were obtained from the analysis of shoots collected from a pool of at least 10 plants. Error bars correspond to standard deviation from three biological repeats. Asterisks indicate statistically significant differences compared to the +Pi +Zn treatment within each genotype (P <0.05). Hashes indicate statistically significant differences between wild type and mutants under –Zn condition.
Fig. 9.
Fig. 9.
mRNA accumulation of the PHO1 gene in response to the availability of Zn in wild-type and pho1;h3 mutant plants. Plants were grown vertically on agar-solidified media containing 1mM Pi and 15 μM Zn (+Pi,+Zn), 15 μM Zn and no Pi (–Pi,+Zn), or 1mM Pi and no Zn (+Pi,–Zn). Roots of 20-d-old plants were separately harvested and mRNA accumulation was quantified by quantitative reverse-transcription PCR. mRNA abundance was normalized to the mRNA abundance of the UBQ10 control gene and expressed as relative values against wild-type plants grown in +Pi,+Zn medium. Individual measurements were obtained from the analysis of roots collected from a pool of at least 10 plants. Error bars correspond to standard deviation from three biological replicates.

References

    1. Alonso JM, Stepanova AN, Leisse TJ, et al. , 2003. Genome-wide insertional mutagenesis of Arabidopsis thaliana . Science 301, 653–657 - PubMed
    1. Ames BN. 1966. Assay of inorganic phosphate, total phosphate and phosphatases. Methods in Enzymology 8, 115–118
    1. Arpat AB, Magliano P, Wege S, Rouached H, Stefanovic A, Poirier Y. 2012. Functional expression of PHO1 to the Golgi and trans-Golgi network and its role in export of inorganic phosphate. The Plant Journal 71, 479–491 - PubMed
    1. Aung K, Lin S, Wu C, Huang Y, Su C, Chiou T. 2006. pho2, a phosphate overaccumulator, is caused by a nonsense mutation in a microRNA399 target gene. Plant Physiology 141, 1000–1011 - PMC - PubMed
    1. Batistic O, Waadt R, Steinhorst L, Held K, Kudla J. 2010. CBL-mediated targeting of CIPKs facilitates the decoding of calcium signals emanating from distinct cellular stores. The Plant Journal 61, 211–222 - PubMed

Publication types

MeSH terms