. 2015 Jun;25(6):1676-84.
doi: 10.1093/cercor/bht425. Epub 2014 Jan 12.

Imaging patterns of brain development and their relationship to cognition

Affiliations

Imaging patterns of brain development and their relationship to cognition

Guray Erus et al. Cereb Cortex. 2015 Jun.

Abstract

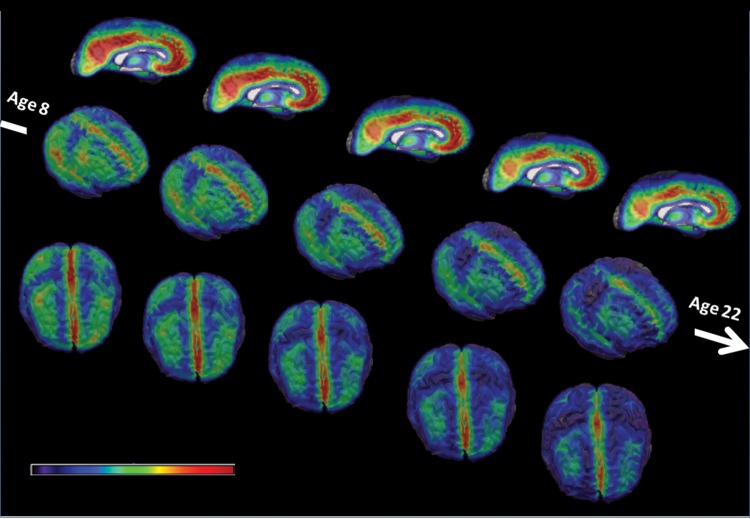
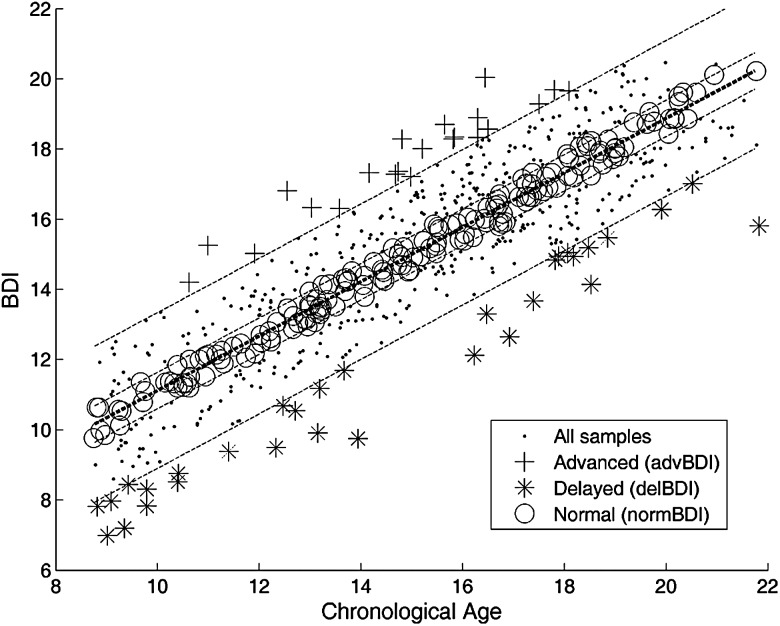
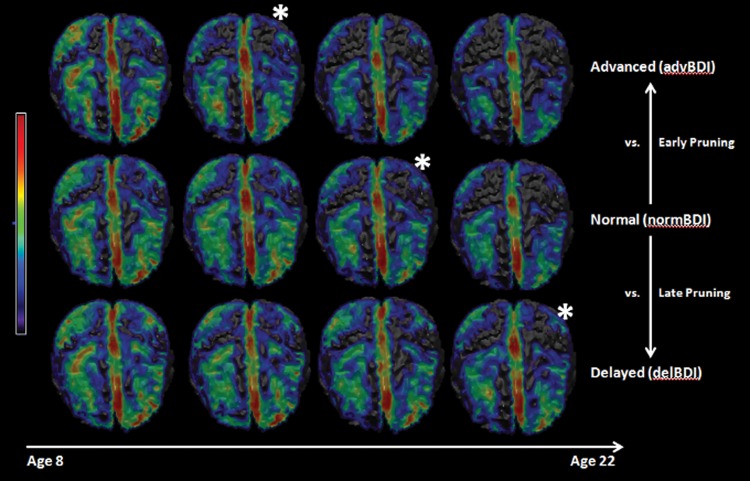
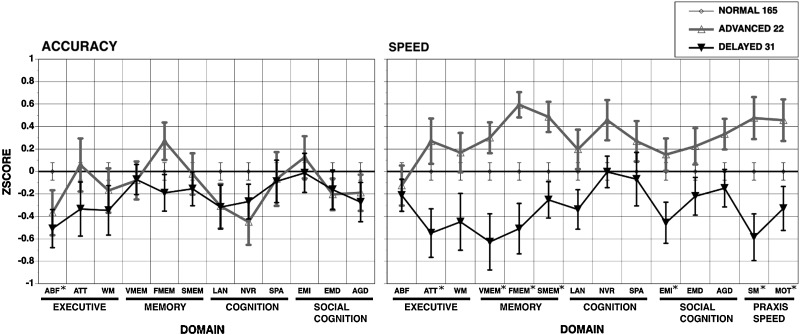
We present a brain development index (BDI) that concisely summarizes complex imaging patterns of structural brain maturation along a single dimension using a machine learning methodology. The brain was found to follow a remarkably consistent developmental trajectory in a sample of 621 subjects of ages 8-22 participating in the Philadelphia Neurodevelopmental Cohort, reflected by a cross-validated correlation coefficient between chronologic age and the BDI of r = 0.89. Critically, deviations from this trajectory related to cognitive performance. Specifically, subjects whose BDI was higher than their chronological age displayed significantly superior cognitive processing speed compared with subjects whose BDI was lower than their actual age. These results indicate that the multiparametric imaging patterns summarized by the BDI can accurately delineate trajectories of brain development and identify individuals with cognitive precocity or delay.

Keywords: DTI; MRI; SVR; age prediction; brain development index.


Figures

Figure 1.
Figure 1.
Right mesial, right lateral, and top views of the average GM RAVENS Maps for age groups 8–22. The color map represents lower RAVENS values (i.e., less GM) in blue and higher RAVENS values (i.e., more GM) in red. The GM volume decreases with age in the whole brain, with region specific patterns of maturation.
Figure 2.
Figure 2.
Scatter plot of BDIs versus chronological ages of 621 subjects. The BDIs were calculated through 10-fold cross-validation, using the model trained on the combination of all image maps. The correlation between the chronological age and the BDI is r = 0.89. The bold dotted line shows the linear regression line. 90% and 30% prediction intervals are shown with dotted lines. The subjects outside the 90% prediction interval have been labeled as outliers (advanced or delayed brain development). The subjects within the 30% prediction interval have been labeled as normally developed.
Figure 3.
Figure 3.
The visualization of the SVR weight vector for the SVR model trained using all image maps from all subjects as input. The highlighted areas in each image map show the brain regions that obtained a high positive (red) or negative (blue) weight.
Figure 4.
Figure 4.
Scatter plot of chronological ages versus BDIs of female and male subjects calculated using sex-specific prediction models. Left: the BDIs for male and female subjects calculated using the model trained on the male subjects only. The linear regression line is shown in black for males and in gray for females. Right: the BDIs for female and male subjects calculated using the model trained on the female subjects only. The linear regression line is shown in black for females and in gray for males. Ten-fold cross validation is used when the model is trained and tested on the same sex.
Figure 5.
Figure 5.
Top views of average GM RAVENS Maps in different age groups for the advanced, delayed, and normal subjects. The color map represents lower RAVENS values (i.e., less GM) in blue and higher RAVENS values (i.e., more GM) in red. A consistent developmental pattern is observed for all groups similar to that shown in Figure 1. However a shift can be observed between the 3 groups, where the GM decrease happens earlier in the advanced group, and later in the delayed group, compared with normal group. The * has been used to show the correspondences, as an indicator of this developmental shift.
Figure 6.
Figure 6.
Mean(±SEM) scores in each cognitive domain for subjects in normal, advanced, and delayed groups. The scores in each cognitive domain were normalized to those whose BDI age is within 30% CI of chronological age (NORMAL), such that the normal group has zero mean and SD equal to one. The cognitive domains with significant group differences are marked with *. See domain abbreviations in Materials and methods.

References

    1. Asato MR, Terwilliger R, Woo J, Luna B. 2010. White matter development in adolescence: a DTI study. Cereb Cortex. 20:2122–2131. - PMC - PubMed
    1. Ashtari M, Cervellione KL, Hasan KM, Wu J, McIlree C, Kester H, Ardekani BA, Roofeh D, Szeszko PR, Kumra S. 2007. White matter development during late adolescence in healthy males: a cross-sectional diffusion tensor imaging study. NeuroImage. 35:501–510. - PubMed
    1. Bachman P, Niendam TA, Jalbrzikowkski M, Park CY, Daley M, Cannon TD, Bearden CE. 2012. Processing speed and neurodevelopment in adolescent-onset psychosis: cognitive slowing predicts social function. J Abnorm Child Psychol. 40:645–654. - PMC - PubMed
    1. Ball WS, Byars AW, Schapiro M, Bommer W, Carr A, German A, Dunn S, Rivkin MJ, Waber D, Mulkern R, et al. 2012. Total and regional brain volumes in a population-based normative sample from 4 to 18 years: the NIH MRI study of normal brain development. Cereb Cortex. 22:1–12. - PMC - PubMed
    1. Barnea-Goraly N, Menon V, Eckert M, Tamm L, Bammer R, Karchemskiy A, Dant CC, Reiss AL. 2005. White matter development during childhood and adolescence: a cross-sectional diffusion tensor imaging study. Cereb Cortex. 15:1848–1854. - PubMed

Publication types