

Identifying Optimal Overload and Taper in Elite Swimmers over Time
- PMID: 24421726
- PMCID: PMC3873657
Identifying Optimal Overload and Taper in Elite Swimmers over Time
Abstract
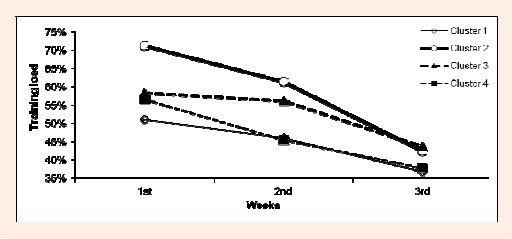
The aim of this exploratory study was to identify the most influential training designs during the final six weeks of training (F6T) before a major swimming event, taking into account athletes' evolution over several seasons. Fifteen female and 17 male elite swimmers were followed for one to nine F6T periods. The F6T was divided into two sub-periods of a three-week overload period (OP) and a three-week taper period (TP). The final time trial performance was recorded for each swimmer in his or her specialty at the end of both OP and TP. The change in performances (ΔP) between OP and TP was recorded. Training variables were derived from the weekly training volume at several intensity levels as a percentage of the individual maximal volume measured at each intensity level, and the individual total training load (TTL) was considered to be the mean of the loads at these seven intensity levels. Also, training patterns were identified from TTL in the three weeks of both OP and TP by cluster analysis. Mixed-model was used to analyse the longitudinal data. The training pattern during OP that was associated with the greatest improvement in performance was a training load peak followed by a linear slow decay (84 ± 17, 81 ± 22, and 80 ± 19 % of the maximal training load measured throughout the F6T period for each subject, Mean ± SD) (p < 0.05). During TP, a training load peak in the 1(st) week associated with a slow decay design (57 ± 26, 45 ± 24 and 38 ± 14%) led to higher ΔP (p < 0.05). From the 1(st) to 3(rd) season, the best results were characterized by maintenance of a medium training load from OP to TP. Progressively from the 4(th) season, high training loads during OP followed by a sharp decrease during TP were associated with higher ΔP. Key PointsDuring the overload training period, a medium training load peak in the first week followed by an exponential slow decay training load design was linked to highest performance improvement.During the taper period, a training load peak in the first week associated with a slow decay design led to higher performances.Over the course of the swimmers' athletic careers, better performances were obtained with an increase in training load during the overload period followed by a sharper decrease in the taper period.Training loads schedules during the final six weeks of training before a major swimming event and changes over time could be prescribed on the basis of the model results.
Keywords: Repeated measures; elite swimmers; monitoring training; periodization; pre-taper and taper; random-effects methodology.
Figures


References
-
- Banister E.W., Carter J.B., Zarcadas P.C.(1999). Training theory and taper: validation in triathlon athletes. European Journal of Applied Physiology 79(2), 182-191 - PubMed
-
- Bonifazi M., Sardella F., Luppo C.(2000). Preparatory versus main competitions: differences in performances, lactate responses and pre-competition plasma cortisol concentrations in elite male swimmers. European Journal of Applied Physiology 82, 368-373 - PubMed
-
- Bosquet L., Montpetit J., Arvisais D., Mujika I.(2007). Effects of tapering on performance: A meta-analysis. Medicine and Sciences in Sports and Exercise 39, 1358-1365 - PubMed
-
- Busso T., Denis C., Bonnefoy R.(1997). Modeling of adaptations to physical training by using a recursive least squares algorithm. Journal of Applied Physiology 82, 1685-1693 - PubMed
LinkOut - more resources
Full Text Sources
Miscellaneous