. 2013 Dec 26:7:204.
doi: 10.3389/fncir.2013.00204. eCollection 2013.

Adult neurogenesis modifies excitability of the dentate gyrus

Affiliations

Adult neurogenesis modifies excitability of the dentate gyrus

Taruna Ikrar et al. Front Neural Circuits. .

Abstract

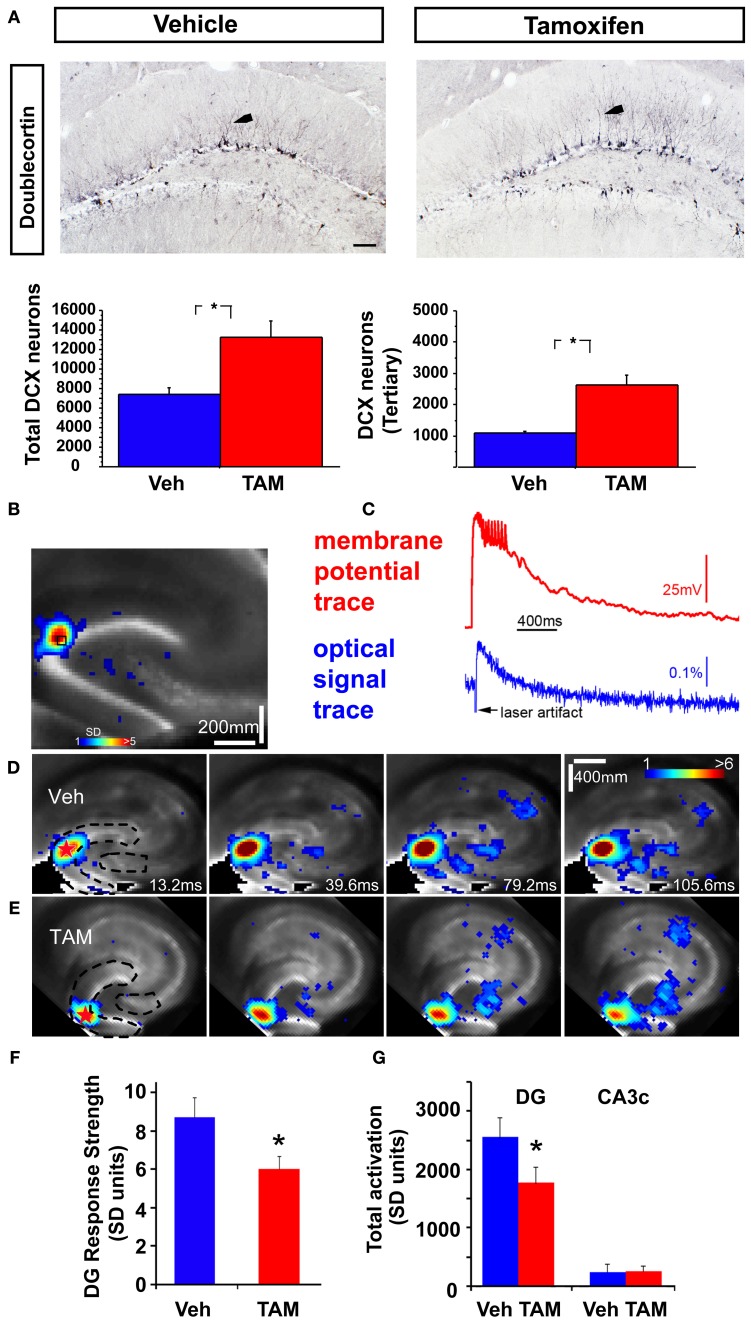
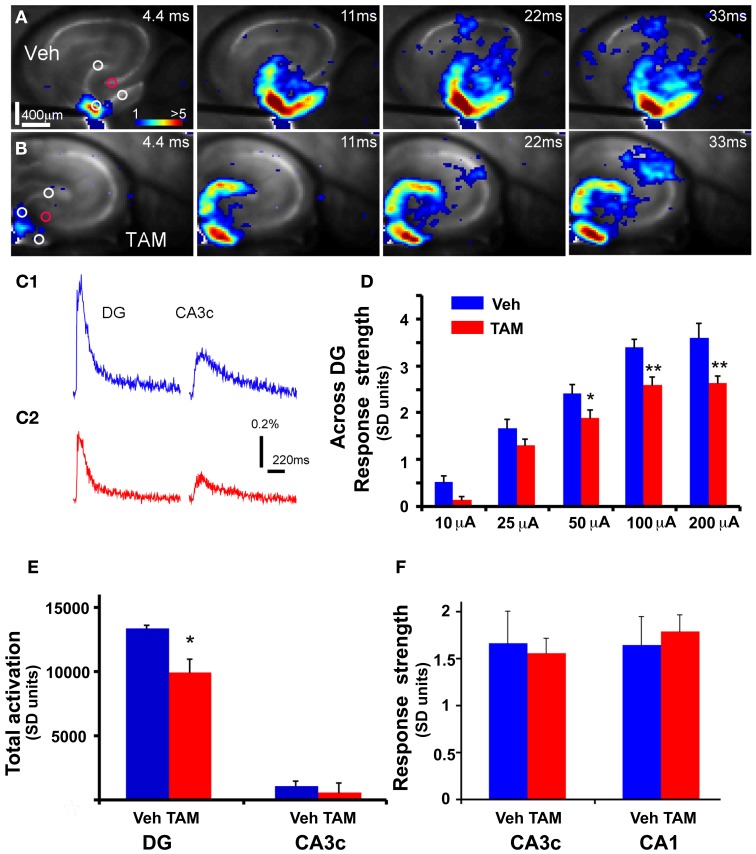
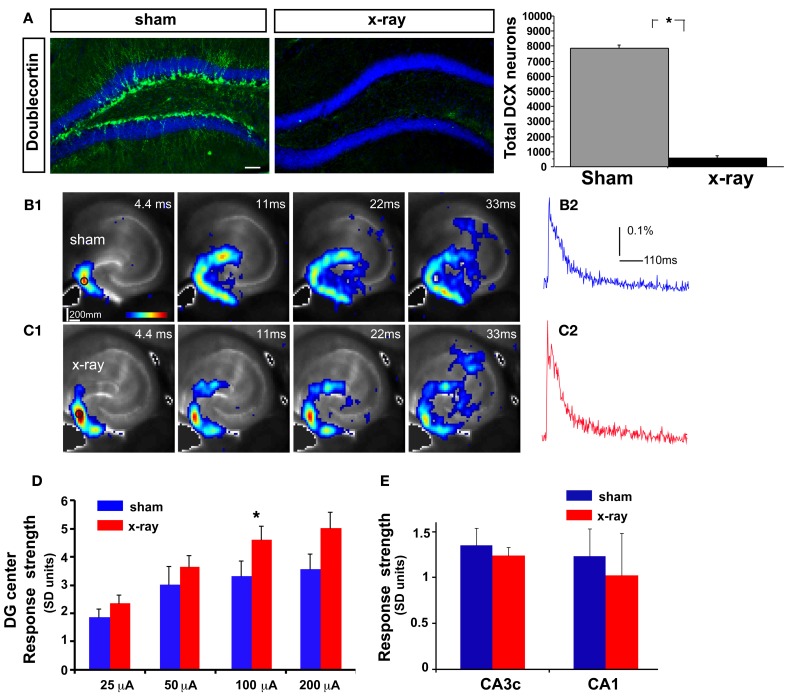
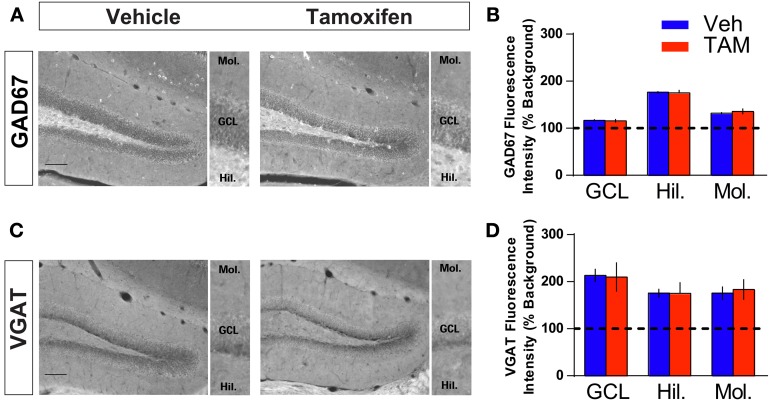
Adult-born dentate granule neurons contribute to memory encoding functions of the dentate gyrus (DG) such as pattern separation. However, local circuit-mechanisms by which adult-born neurons partake in this process are poorly understood. Computational, neuroanatomical and electrophysiological studies suggest that sparseness of activation in the granule cell layer (GCL) is conducive for pattern separation. A sparse coding scheme is thought to facilitate the distribution of similar entorhinal inputs across the GCL to decorrelate overlapping representations and minimize interference. Here we used fast voltage-sensitive dye (VSD) imaging combined with laser photostimulation and electrical stimulation to examine how selectively increasing adult DG neurogenesis influences local circuit activity and excitability. We show that DG of mice with more adult-born neurons exhibits decreased strength of neuronal activation and more restricted excitation spread in GCL while maintaining effective output to CA3c. Conversely, blockade of adult hippocampal neurogenesis changed excitability of the DG in the opposite direction. Analysis of GABAergic inhibition onto mature dentate granule neurons in the DG of mice with more adult-born neurons shows a modest readjustment of perisomatic inhibitory synaptic gain without changes in overall inhibitory tone, presynaptic properties or GABAergic innervation pattern. Retroviral labeling of connectivity in mice with more adult-born neurons showed increased number of excitatory synaptic contacts of adult-born neurons onto hilar interneurons. Together, these studies demonstrate that adult hippocampal neurogenesis modifies excitability of mature dentate granule neurons and that this non-cell autonomous effect may be mediated by local circuit mechanisms such as excitatory drive onto hilar interneurons. Modulation of DG excitability by adult-born dentate granule neurons may enhance sparse coding in the GCL to influence pattern separation.

Keywords: adult neurogenesis; dentate granule neurons; dentate gyrus; encoding; excitability; inhibition; pattern separation.


Figures

Figure 1
Figure 1
Increasing adult hippocampal neurogenesis decreases photostimulation evoked DG excitability without affecting CA3c activation. (A) Representative DCX immunostained coronal hippocampal sections of Veh and TAM treated NCff mice. Arrows in insets indicate DCX neurons with at least tertiary dendrites. Quantification of DCX population. Total DCX+ neurons: Veh: 7435.5 ± 629.2, TAM: 13228.5 ± 1720.2, Mean ± SEM, p = 0.0195, n = 4/gp, DCX expressing neurons with tertiary dendrites: Veh: 1089.0 ± 55, TAM: 2623.5 ± 309.2, Mean ± SEM, p = 0.0027, n = 4/gp. Scale bar: 100 μm. (B,C) VSD imaging and simultaneous whole cell recording indicate that photostimulation evoked VSD signals are closely related to membrane potential depolarization of individual neurons. The measurements are taken from a DG site of a wild type C57BL/6J mouse slice, as indicated by the small black square, in response to spatially restricted photostimulation. The photostimulation locations are labeled with red stars. The VSD image frame in (B) is plotted beginning at the peak membrane depolarization of the recorded neuron. Color-coded activity is superimposed on the background slice image. The color scale codes VSD signal amplitude expressed as SD (standard deviation) multiples above the mean baseline. Warmer colors indicate greater excitation. (C) Shows the aligned optical signal trace [VSD signal in the percent change of pixel intensity (ΔI/I%)] and current-clamp recording trace. (D,E) Time series data of VSD imaging of photostimulation-evoked circuit activity in example slices from Veh and TAM treated NCff mice, respectively. The stimulation site in DG is indicated by a red star; the image frames are labeled with the specified times after the stimulation onset. Dashed lines in first panels of (D,E) indicate delineated regions for measurement of VSD activity. (F) Average DG response strength at the photostimulation sites between Vehicle and TAM treated NCff mice (n = 7 mice per group). Overall mean: Veh: 8.72 ± 1.01, n = 7 slices, TAM: 5.98 ± 0.70 (mean ± SE SD units), n = 8 slices, p < 0.05. (G) DG activation and output response. Total DG responses (summed amplitudes of activated pixels across 10 peak response frames): Veh: 2552 ± 346 and TAM, 1766 ± 279.2, n = 7 slices each, p < 0.05, (mean ± SE SD units). The proximal CA3 (CA3c) activation followed with DG photostimulation did not differ between the groups. Total response values: Veh: 257.5 ± 94.7 and TAM: 235.8 ± 138.6 (mean ± SE SD units). *p < 0.05.
Figure 2
Figure 2
DG of iBaxnestin mice shows decreased strength of neuronal activation following electrical stimulation. (A) Time series data of VSD imaging of hippocampal circuit activity in response to electrical stimulation (100 μA, 1 ms) at DG with a bipolar extracellular stimulation electrode in a Vehicle treated NCff mouse slice. The color scale codes VSD signal amplitude expressed as SD multiples above the mean baseline. Warmer colors indicate stronger excitatory responses. (B) Time series data of VSD imaging of the circuit activity in response to DG electrical stimulation (100 μA, 1 ms) in a TAM treated NCff mouse slice. (C1) The time courses of VSD signal [in the percent change of pixel intensity (ΔI/I%)] from the regions indicated by the small circles in the first frame in DG apex and CA3c of (A), respectively. (C2) The time courses of VSD signal from the small regions indicated in the first frame in DG apex and CA3c of (B). (D) Comparisons of the average VSD response strength across DG (measured from 3 regions indicated by the three white circles at the DG granule cell layer) to electrical stimulation in the DG center of different amplitudes for the control and experimental groups. The data points (mean ± SE) are from 7 mice (22–26 slices total) each group, calculated for each slice and averaged for each animal. Because of slice conditions, responses for all stimulation intensities were not obtained from all slices. Two-Way repeated measures ANOVA, (treatment) F(1, 4) = 10.5, p = 0.03. *p ≤ 0.05, **p ≤ 0.01. (E) VSD response strength of CA3c (delineated by red circle) to DG electric stimulation (100 μA) between Vehicle and TAM treated NCff mice. (F) Total DG and CA3c activation (summed amplitudes of activated pixels across 10 peak response frames) in response to DG electric stimulation (100 μA) between Vehicle and TAM treated NCff mice.
Figure 3
Figure 3
DG excitability is increased in mice in which adult hippocampal neurogenesis is ablated. (A) Representative DCX immunostained coronal hippocampal sections of sham and x-irradiated mice. Total DCX counts: sham, 7873 ± 176.9, x-ray, 564.6 ± 148.9, Mean ± SEM, n = 3/gp, p < 0.0001. (B1–C1) (B1) and (C1) show time series data of VSD imaging of hippocampal circuit activity in response to electrical stimulation (100 μA, 1 ms) at DG with a bipolar extracellular stimulation electrode in sham and x-rayed mouse slices, respectively. (B2) and (C2) display the time courses of VSD signal [in the percent change of pixel intensity (ΔI/I%)] from the regions indicated by the small circles in the first frame in the DG center in (B1) and (C1), respectively. (D) Comparisons of the average peak strength of VSD response to electrical stimulation at center of DG of different amplitudes for the control and experimental groups. The data points (mean ± SE) are from 6 to 8 mice in each group (18–21 slices total), calculated for each slice and averaged for each animal. Because of slice conditions, responses for all stimulation intensities were not obtained from all slices. VSD response strength to DG electric stimulation (100 μA) differed significantly between sham and x-irradiated slices, p < 0.05. Analysis across all stimulation intensities showed a trend toward increased cellular activation in x-irradiated mice. Two-Way repeated measures ANOVA, (treatment) F(1, 11) = 2.7, p = 0.12, (stimulation intensity × treatment) F(3, 33) = 1, p = 0.4. (E) Total DG and CA3c activation (summed amplitudes of activated pixels across 10 peak response frames) in response to DG electric stimulation (100 μA) between sham and x-irradiated groups. *p <0.05.
Figure 4
Figure 4
Increasing adult hippocampal neurogenesis does not affect presynaptic GABAergic innervation of mature dentate granule neurons. (A,B) GAD67 immunohistochemistry and quantification of GAD67 levels in (GCL), hilus and molecular layers of DG (inset). NCff (Veh and TAM) mice show similar levels of GAD67 in the DG. (C,D) VGAT immunohistochemistry and quantification of VGAT levels in GCL, hilus and molecular layers of DG (inset). NCff (Veh and TAM) mice show similar levels of VGAT in the DG. Scale bar: 500 μm.
Figure 5
Figure 5
Mature dentate granule neurons in iBaxnestin mice show redistribution of inhibitory synaptic weights without changes in pattern of mIPSC generation. (A) Recording from a representative mature dentate granule cell. Left, top: A low magnification image showing a patch electrode on a neuron located in the outer blade. The area outlined by the white square is shown below in higher magnification. Right: The same neuron processed for biocytin, which was placed inside the recording pipette. Green: biocytin, Blue: DAPI. (B) No significant difference in the average mIPSC frequency (top left, Veh: 8.7 ± 0.89 Hz; TAM: 9.2 ± 1.03 Hz; t-test: p = 0.71) and the average mIPSC amplitude (bottom left, Veh: 45 ± 3.3 pA, n = 11; TAM: 42 ± 3.2 pA, n = 20; t-test: p = 0.57) between control and iBaxnestin mice. Top right: Representative mIPSC traces. Bottom right: Average mIPSC traces. There was no difference in the kinetics of the mIPSCs between the two groups (10–90 rise: Veh: 1.9 ± 0.07 ms; TAM: 1.9 ± 0.05 ms, p = 0.85; decay time constant: Veh: 6.1 ± 0.45 ms; TAM: 6.5 ± 0.28 ms, p = 0.41). (C) No change in pattern of mIPSC generation between two groups. Top: Cumulative probability of mIPSC interevent intervals from control and iBaxnestin mice. No significant difference between the two groups (Kolmogorov-Smirnov test: p = 0.1). Bottom: Subtraction of the two cumulative probability graphs (Veh–TAM) confirms a minimal change in the distribution of mIPSCs interevent intervals. (D) Changes in the distribution of inhibitory synaptic weight in iBaxnestin mice Top: Cumulative probability of mIPSC amplitudes from control and iBaxnestin mice. There was a significant difference between the two groups (Kolmogorov-Smirnov test: p < 0.001). Bottom: Subtraction of the two cumulative probability graphs (Veh–TAM) reveals a significant increase in the fraction of smaller and larger mIPSCs in the TAM treated group.
Figure 6
Figure 6
Inducible recombination of Bax in progenitors in adult DG increases the number of excitatory synaptic contacts of adult-born dentate granule neurons with hilar interneurons. (A,B) Representative images of DG of Bax +/+ and Bax f/f littermates processed for GAD67, GFP, and DAPI and quantification showing increased number of 4 weeks old GFP+ adult-born dentate granule neurons in Bax f/f mice. (C) Confocal images in xy, xz, and yz planes showing GFP+ contacts of small MFT with GAD67+ processes in hilus of Bax +/+ and Bax f/f mice. (D) DG of Bax f/f mice (140.7 ± 12.9) show a significant increase in GFP+ MFTs in hilus compared to Bax +/+ littermates (53.16 ± 7.24) (n = 12 hemisections from 2 Bax +/+ mice, n = 17 hemisections from 3 Bax f/f mice, p < 0.001, unpaired t-test). (E) Hilus of Bax f/f (2.55 ± 0.22) and Bax +/+ (2.22 ± 0.21) littermates show equivalent number of contacts with GAD67 processes per MFT (n = 75 MFTs from 2 Bax +/+ mice and n = 70 MFTs from 3 Bax f/f mice, p = 0.27, unpaired t-test). Scale bar: 100 μ m (A), 2 μ m (C). Results are Mean ± SE. *p <0.05.
Figure 7
Figure 7
Model showing how increasing adult hippocampal neurogenesis modulates DG excitability while maintaining output to CA3c (A). In control animals, adult-born and mature dentate granule neurons exert feed-back inhibition onto mature dentate granule neurons through excitatory contacts with hilar interneurons. Young adult-born dentate granule neurons are insensitive to this feed-back inhibition. The extent of DG activation dictates the strength of feed-forward excitation and di-synaptic feed-forward inhibition to CA3c mediated by excitatory contacts of mature and adult-born dentate granule neurons onto CA3c neurons and CA3c neurons via SL interneurons, respectively. (B) When the number of adult-born dentate granule neurons is increased, excitatory drive onto hilar interneurons is increased, thereby increasing feed-back inhibition onto mature dentate granule neurons. Consequently, feed-forward excitation and di-synaptic feed forward inhibition to CA3c mediated by mature dentate granule neurons is decreased. However, feed-forward excitation and di-synaptic feed forward inhibition mediated by adult-born dentate granule neurons to CA3c is increased. Thus, the integration of young adult-born dentate granule neurons into the DG-CA3 circuit directly and indirectly dictates the extent to which feed forward excitation and inhibition is recruited by young adult-born and mature dentate granule neurons, respectively, to activate CA3c. IN: hilar or stratum lucidum interneuron, EC, entorhinal cortex; mf, mossy fiber; MC, mossy cell. Size of line indicates strength of connection.

References

    1. Acsady L., Kamondi A., Sik A., Freund T., Buzsaki G. (1998). GABAergic cells are the major postsynaptic targets of mossy fibers in the rat hippocampus. J. Neurosci. 18, 3386–3403 - PMC - PubMed
    1. Aimone J. B., Deng W., Gage F. H. (2011). Resolving new memories: a critical look at the dentate gyrus, adult neurogenesis, and pattern separation. Neuron 70, 589–596 10.1016/j.neuron.2011.05.010 - DOI - PMC - PubMed
    1. Airan R. D., Meltzer L. A., Roy M., Gong Y., Chen H., Deisseroth K. (2007). High-speed imaging reveals neurophysiological links to behavior in an animal model of depression. Science 317, 819–823 10.1126/science.1144400 - DOI - PubMed
    1. Andrews-Zwilling Y., Gillespie A. K., Kravitz A. V., Nelson A. B., Devidze N., Lo I., et al. (2012). Hilar GABAergic interneuron activity controls spatial learning and memory retrieval. PLoS ONE 7:e40555 10.1371/journal.pone.0040555 - DOI - PMC - PubMed
    1. Antonio A. S., Liban K., Ikrar T., Tsyganovskiy E., Xu X. (2013). Distinct physiological and developmental properties of hippocampal CA2 subfield revealed using anti-Purkinje cell protein 4 (PCP4) immunostaining. J. Comp. Neurol. [Epub ahead of print]. 10.1002/cne.23486 - DOI - PMC - PubMed

Publication types