. 2013 Dec 26:7:120.
doi: 10.3389/fnsys.2013.00120. eCollection 2013.

Donor/recipient enhancement of memory in rat hippocampus

Affiliations

Donor/recipient enhancement of memory in rat hippocampus

Sam A Deadwyler et al. Front Syst Neurosci. .

Abstract

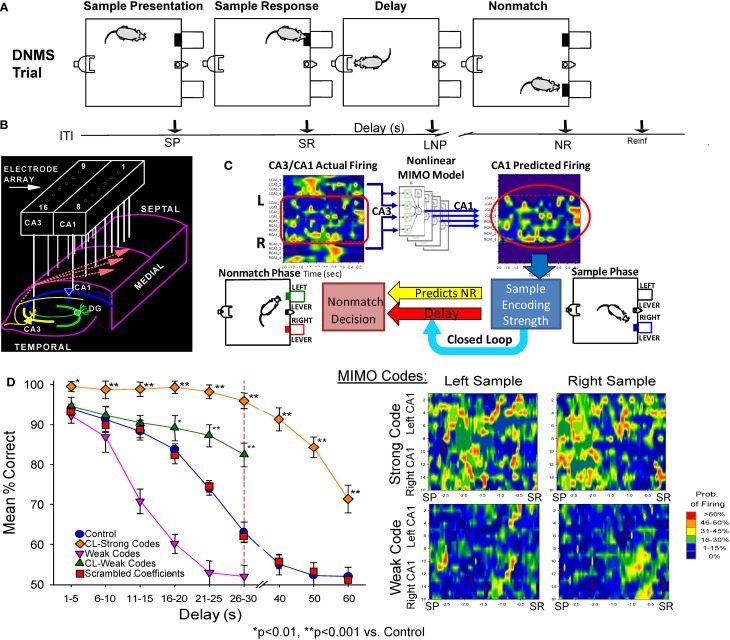
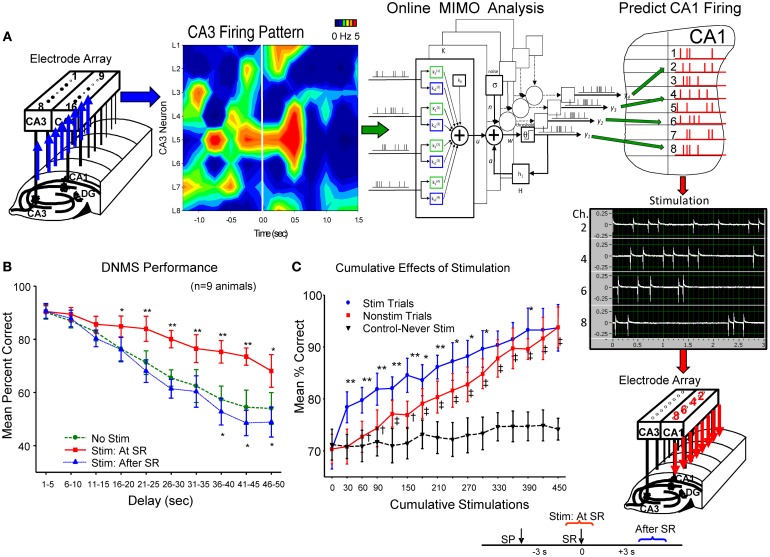
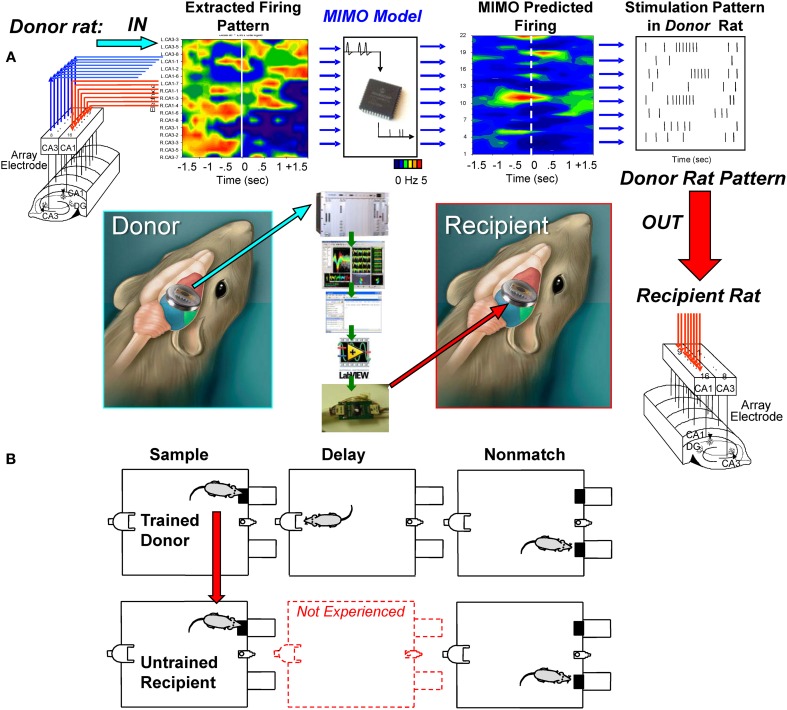
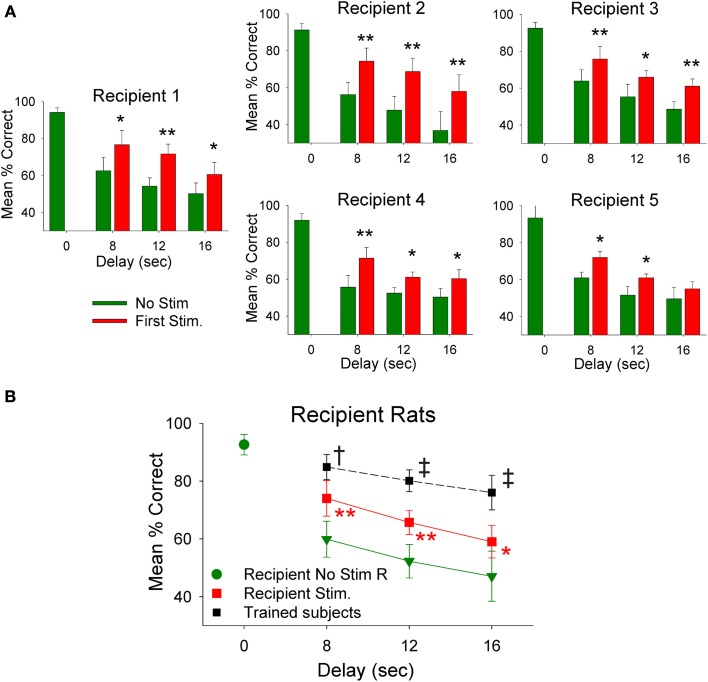
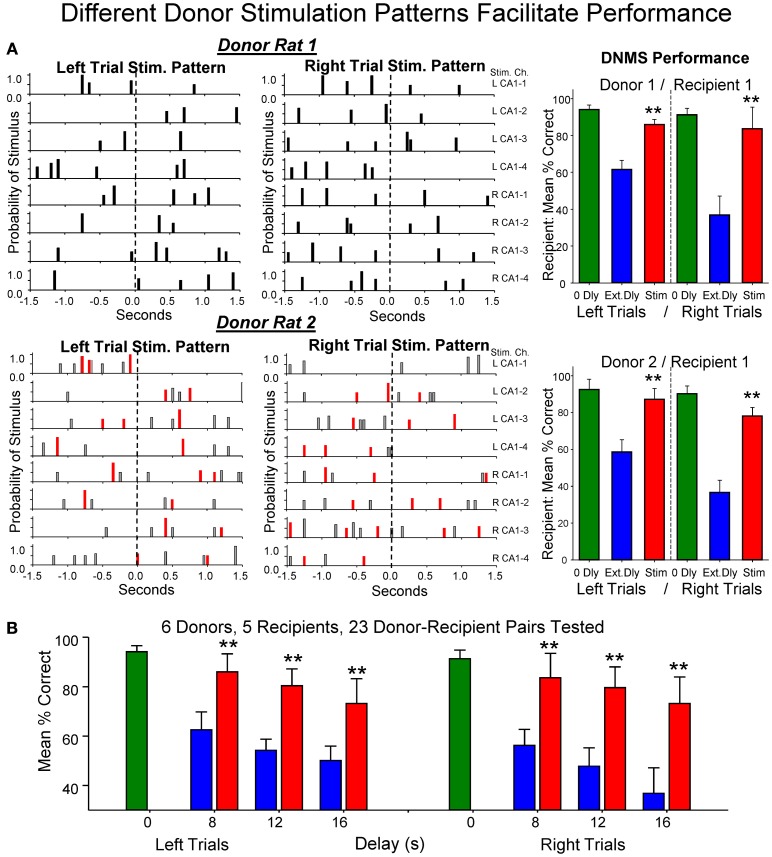
The critical role of the mammalian hippocampus in the formation, translation and retrieval of memory has been documented over many decades. There are many theories of how the hippocampus operates to encode events and a precise mechanism was recently identified in rats performing a short-term memory task which demonstrated that successful information encoding was promoted via specific patterns of activity generated within ensembles of hippocampal neurons. In the study presented here, these "representations" were extracted via a customized non-linear multi-input multi-output (MIMO) mathematical model which allowed prediction of successful performance on specific trials within the testing session. A unique feature of this characterization was demonstrated when successful information encoding patterns were derived online from well-trained "donor" animals during difficult long-delay trials and delivered via online electrical stimulation to synchronously tested naïve "recipient" animals never before exposed to the delay feature of the task. By transferring such model-derived trained (donor) animal hippocampal firing patterns via stimulation to coupled naïve recipient animals, their task performance was facilitated in a direct "donor-recipient" manner. This provides the basis for utilizing extracted appropriate neural information from one brain to induce, recover, or enhance memory related processing in the brain of another subject.

Keywords: electrical stimulation; ensemble; memory-transfer; non-linear model; rodent.


Figures

Figure 1
Figure 1
Delayed non-match to sample (DNMS) task, MIMO model and associated hippocampal ensemble activity. (A) DNMS Trial Diagram. Sample lever presentation (SP) and Sample response (SR) are followed by a variable delay interval which required a nosepoke (NP) in a photocell on opposite wall. The Non-match phase began after delay timeout, with both levers presented simultaneously for reward contingent Non-match Response (NR) on the lever opposite the SR position. Correct non-match responses produced 0.2 ml of water delivered to the trough between the levers. Timeline below shows sequence of task phases: ITI–intertrial interval; SP–Sample Lever presentation; SR–Sample response; Delay–Delay interval; LNP–last required nosepoke during Delay; NR–Non-match (decision) response; Reinf.—Delivery of water reward. (B) Hippocampal recording array: two rows of 8 stainless steel 20 μm wires positioned longitudinally within hippocampus at 200 μm intervals for each electrode pair in CA3 and CA1 cell layers. Arrays were implanted bilaterally in both hippocampi providing a total of 32 indwelling chronic electrodes per animal. (C) Heatmap display (left) showing online array monitored hippocampal ensemble single neuron (actual firing) activity. Low-to-high (blue-to-red) firing rates are indicated at the separate CA3/CA1 locations on the array (B) during the occurrence of the SR (time 0.0 s). Schematic of non-linear MIMO model: Spike trains X1–X8 recorded from CA3 electrodes (CA3 input) on the hippocampal array (left) are input to the model and used to predict CA1 firing across the other 8 recording locations shown in the diagram on the right (1–8, predicted CA1) at the time of the SR. The schematic of the non-linear analysis used to construct the CA1 predicted outputs which illustrates estimation of the spatiotemporal relationship between each CA1 output (Y) and multiple CA3 inputs (X) modeled via Volterra kernels which are then combined to form the MIMO model for all CA1 locations (see Supplemental Material). The output of the model (right) is then employed to vary the delay interval of the DNMS task on the same trial in a closed loop manner as shown by the diagram below. Lower Right: MIMO Codes: Heatmap displays of MIMO model predicted CA1 firing in both hemispheres during the response on the Sample lever on individual trials during sample presentation (SP and response (SR) for trials both Left and Right sample lever presentation. Strong Codes: MIMO predicted CA1 sample lever firing on successful trials. Weak Codes: MIMO prediction of the same CA1 cell firing on error trials. Firing rates indicated by the scale bar at right. (D) MIMO mediated closed loop control of DNMS performance (mean ± s.e.m. % correct) summed over all animals, n = 15). Trials in which strong (diamonds) and weak (triangles) SR codes occurred are plotted as a function of length of delay, shown compared to Control performance on trials not sorted by code strength. Performance on trials with extended delays (40, 50, or 60 s, vertical dashed line) was significantly higher than on trials with the same delays (Control, 40–60 s) presented without MIMO Closed Loop regulation [F(1, 401) = 18.39, p < 0.001, *p < 0.01, **p < 0.001, Closed Loop vs. Control trials]. DNMS (performance) for trials of 1–30 s delay (Control) is also shown compared to performance on trials in which only weak SR codes (Weak Codes) occurred [F(1, 401) = 11.81, p < 0.001]. Performance on trials in which the MIMO model coefficients were randomly assigned (i.e., scrambled) to CA1 firing are also shown in the curve for scrambled coefficients (squares) as having no difference from Control performance.
Figure 2
Figure 2
Electrical stimulation utilizing MIMO predicted CA1 output patterns, facilitates DNMS performance. (A) Patterns of recorded CA3 cell firing in hippocampal array, shown as a heatmap (left), constitutes the input for online implementation of the MIMO model (center) to predict CA1 firing pattern (Figure 1C) indicated by red “tick” marks in hippocampal (CA1) layout (at right). This MIMO output pattern is fed to a programmable 8 channel stimulator (Supplemental Material) which delivers up to 3.0 s trains of bipolar electrical stimulation pulses (middle right) to the CA1 electrode locations showing the same firing pattern in each hemisphere. Stimulator output (photo display) is shown for 4 of the 8 channels to indicate different frequencies and intensities of stimulus trains delivered to separate CA1 locations (Supplemental Material). The time lag between CA3 recording, MIMO calculation and output of CA1 stimulation was approximately 50 ms. (B) DNMS performance graph of trained animals (n = 9) for delays of 1–60 s compares effects of 3.0 s stimulation delivered either: (1) at the time the SR occurred (Stim at SR) vs. No Stim [F(1, 731) = 11.50, p < 0.001], or (2) delayed for 3.0 s after the SR was made (Stim after SR) vs. No Stim [F(1, 731) = 3.17, n.s.] (see inset lower right). Asterisks (*p < 0.01, **p < 0.001) indicate significant difference in DNMS performance compared to control (No Stim.) trials (Berger et al., 2011). (C) Cumulative effects of MIMO generated SR stimulation over successive trials (Hampson et al., 2012a) shows progressive increase in overall mean (± s.e.m.) % correct performance in 30 trial blocks for animals (n = 5) receiving 25–30 SR stimulation trials (Stim Trials) per session for 15 sessions. Red curve (squares) shows overall performance on remaining trials within the same behavioral sessions in which no stimulation was delivered (No Stim). Inverted triangles (dotted line) shows performance over the same number of successive trials of equivalently trained animals (n = 20) that never received SR stimulation (Never Stim). Stim vs. Non-stim trials: F(1, 145) = 9.42, *p < 0.01,**p < 0.001, Stim. vs. Never Stim: F(1, 1349) = 15.72, p < 0.001, Non-stim vs. Never Stim. F(1, 1349) = 11.29, p < 0.01, p < 0.001.
Figure 3
Figure 3
Transference of successful MIMO coded ensemble firing patterns from trained “donor” rats to task-naïve “recipient” rats. (A) Recordings were obtained online from well-trained animals (i.e., donor rats) with validated effective MIMO SR CA1 stimulation patterns as shown in Figure 2. A second group of delay-naïve animals (recipient rats) were only trained to perform the operant responses in the DNMS task in sequence without exposure to variable and extended delay intervals interposed between the SR and NR task phases requiring completion of the nosepoke response on the opposite wall (red middle diagram). (B) Donor-Recipient rat “pairs” were recorded from and tested simultaneously in different chambers with DNMS trial execution synchronized by presentation of the sample lever in the same position at the same time. During performance of trials within the simultaneous sessions, donor rat hippocampal ensemble activity was monitored for presence of CA3 firing predictions of effective strong SR code CA1 stimulation patterns (Figure 2). When such donor rat strong code patterns occurred, the associated MIMO-predicted SR CA1 stimulation pattern was routed instead to the CA1 electrodes in the recipient rat hippocampus while performing the SR within 1–3 s after detection of donor rat strong SR code. Delay intervals of 8, 12, or 16s were then introduced on the same trial for the recipient rat which required the previously learned selection of the opposite lever in the Non-match phase of the task after timeout of the unfamiliar delay periods. All trials on which delays were imposed to recipient rats were determined when strong SR codes were generated by donor rats; hence occurrence of all delay trials during recipient rat sessions was essentially random and unpredictable.
Figure 4
Figure 4
Recipient rat performance on DNMS trials with unfamiliar superimposed delays facilitated by donor rat mediated SR stimulation. (A) Individual DNMS performance of five different recipient rats subjected to trials with 8, 12, and 16 s delays shown for trials in which no stimulation was delivered (No Stim) or on trials on which a simultaneously paired donor rat delivery of MIMO SR CA1 stimulation pattern was delivered (Stim). The similarity across each graph indicates generality of facilitated performance on imposed delay trials with delivery of donor rat MIMO generated CA1 SR stimulation. Asterisks *p < 0.01, **p < 0.001, Stim donor rat vs. No Stim. (B) Overall performance of recipient rats (n = 5) is shown as mean (±s.e.m.) % correct trials with no delays (green dot−0.0 s values) in comparison to trials with variable delays (8, 12, 16 s) without donor rat stimulation (green triangles-No Stim) delivered during the trial [F(3, 279) = 3.61, p < 0.001]; and performance on trials with the same delays but including donor rat MIMO strong SR code stimulation (Recipient Stim, red squares) which significantly improved performance compared to No Stim trials [F(1, 279) = 9.82, p < 0.001]. For comparison a plot of the average performance level of rats fully trained (n = 20) on the task at the same delays (Trained subjects) is shown (black squares) for comparison to recipient rat performance on stimulated trials [F(1, 1349) = 13.48, p = 0.001, Trained subjects > recipient rats]. Symbols: *p < 0.01, **p < 0.001, p < 0.01, p = 0.001.
Figure 5
Figure 5
Enhancement of performance of the same recipient rat by different donor rats. (A) Left: Delivered MIMO SR CA1 stimulation patterns showed for left and right lever trials from Donor rat 1 (upper) and Donor rat 2 (lower). Red marks in Donor rat 2 patterns reflect occurrences of identical pulses delivered in Donor rat 1 pattern (above) for direct comparison of the two SR Stimulation patterns delivered to the same Recipient rat on different trials. Right: Overall performance of the same Recipient rat for sessions in which SR Stimulation (Stim) on delay trials was contributed by Donor rat 1 (upper) and Donor rat 2 (lower) for left and right Sample lever trials summed over all delays (red) compared with delay trials in which SR stimulation was not delivered (blue). Green bars represent performance by the same Recipient rat on trials with no delay (0 Dly) presented in the same sessions as described above. (B) Lower plot shows overall average performance for all Donor/Recipient sessions (n = 23) for trials with Left and Right SR position and those which received donor rat SR stimulation (red) vs. no stimulation trials (blue) as a function of delay (0, 8, 12, 16 s). Plots include all Donor/Recipient pairs, 5 different recipient rats paired with one or more donor rats (n = 6). Asterisks (**p < 0.001) indicate significant difference compared to trials with no donor rat stimulation (No Stim).
Figure 6
Figure 6
Possible synaptic basis for facilitative Donor/Recipient MIMO SR stimulation. (A) Illustration of hippocampal synaptic connections between CA3 and CA1 cells in the same hippocampal region occupied by the same electrode array used to deliver SR Stimulation (Figures 1–3). Arrows show divergent projections from a single CA3 cell to multiple CA1 cells via Shaffer collateral connections used to determine changes in CA1 (small red arrows) local field potentials (LFPs) elicited by stimulation delivered to a single CA3 locus (large red arrow) before (Pre) and after (Post) behavioral sessions with MIMO SR Stimulation vs. non-stimulated sessions. (B) Average CA1 LFPs elicited by CA3 stimulation are plotted as differences (Post-Prediff) in voltage amplitude measured at the indicated time points (10 ms) of the LFP after stimulus pulse delivery (vertical black line). Red: Mean Post-Prediffs in LFP amplitudes recorded prior to and following non-stimulation sessions for trained animals. Blue: Average Post-Prediffs in LFP amplitude following sessions in which SR stimulation was delivered to facilitate performance. Positive Post-Prediffs reflect average voltage changes related to increased CA1 LFP components after the behavioral session relative to voltages elicited by the same CA3 current intensities prior to the session. These Post-Prediffs for sessions in which SR stimulation facilitated task performance (blue curve) are shown compared to Post-Prediffs for those sessions in which stimulation was not delivered (red curve). Dotted: Diff-Diff shows average difference between CA1 LFP Post-Prediffs for SR stim vs. non-stim sessions (Stim-Non-stim) measured in 6 of the Donor rats (all animals A1-non-stim).

References

    1. Berger T. W., Hampson R. E., Song D., Goonawardena A., Marmarelis V. Z., Deadwyler S. A. (2011). A cortical neural prosthesis for restoring and enhancing memory. J. Neural Eng. 8, 046017 10.1088/1741-2560/8/4/046017 - DOI - PMC - PubMed
    1. Berger T. W., Song D., Chan R. H. M., Marmarelis V. Z., LaCoss J., Wills J., et al. (2012). A hippocampal cognitive prosthesis: multi-input, multi-output nonlinear modeling and VLSI implementation. Trans. Neural. Syst. Rehabil. Eng. 20, 198–211 10.1109/TNSRE.2012.2189133 - DOI - PMC - PubMed
    1. Boettiger C. A., D'Esposito M. (2005). Frontal networks for learning and executing arbitrary stimulus-response associations. J. Neurosci. 25, 2723 10.1523/JNEUROSCI.3697-04.2005 - DOI - PMC - PubMed
    1. Deadwyler S. A., Hampson R. E. (1997). The significance of neural ensemble codes during behavior and cognition, in Annual Review of Neuroscience, Vol. 20, eds Cowan W. M., Shooter E. M., Stevens C. F., Thompson R. F. (Palo Alto, CA: Annual Reviews, Inc; ), 217–244 10.1146/annurev.neuro.20.1.217 - DOI - PubMed
    1. Deadwyler S. A., Hampson R. E. (2006). Temporal coupling between subicular and hippocampal neurons underlies retention of trial-specific events. Behav. Brain Res. 174, 272–280 10.1016/j.bbr.2006.05.038 - DOI - PubMed

LinkOut - more resources