. 2014 Jan 8;9(1):e83249.
doi: 10.1371/journal.pone.0083249. eCollection 2014.

Reef-fidelity and migration of tiger sharks, Galeocerdo cuvier, across the Coral Sea

Affiliations

Reef-fidelity and migration of tiger sharks, Galeocerdo cuvier, across the Coral Sea

Jonathan M Werry et al. PLoS One. .

Abstract

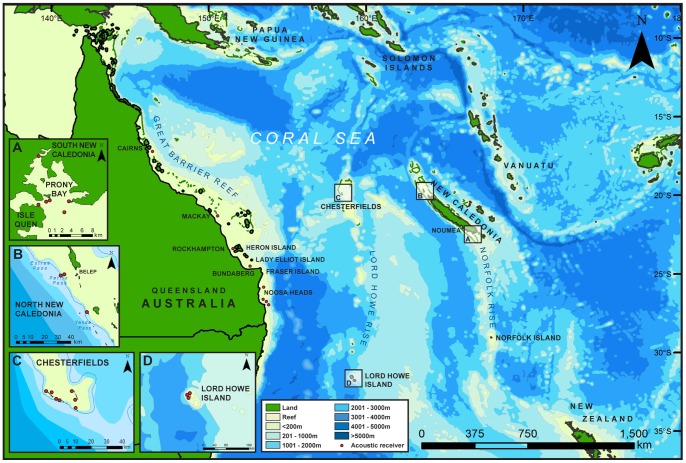
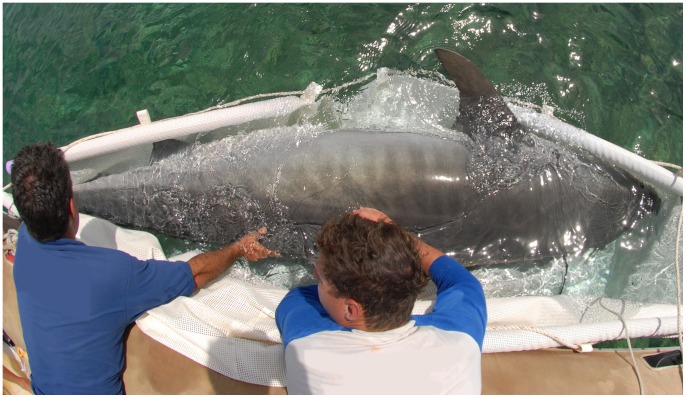
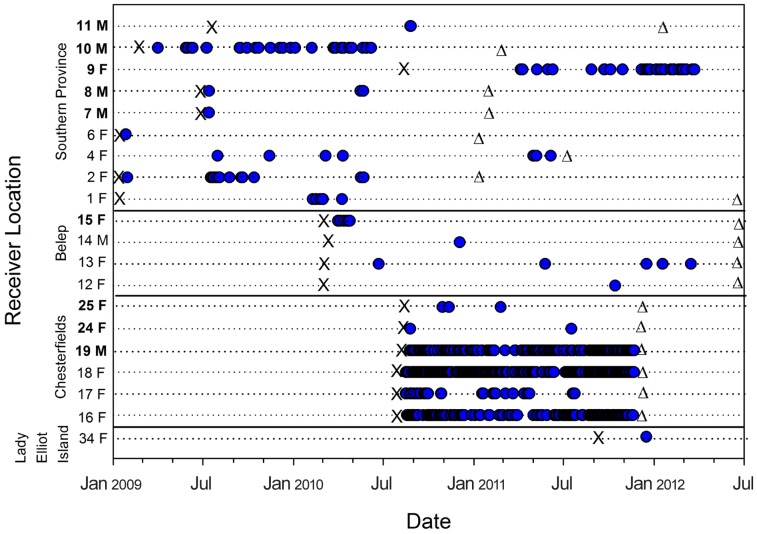
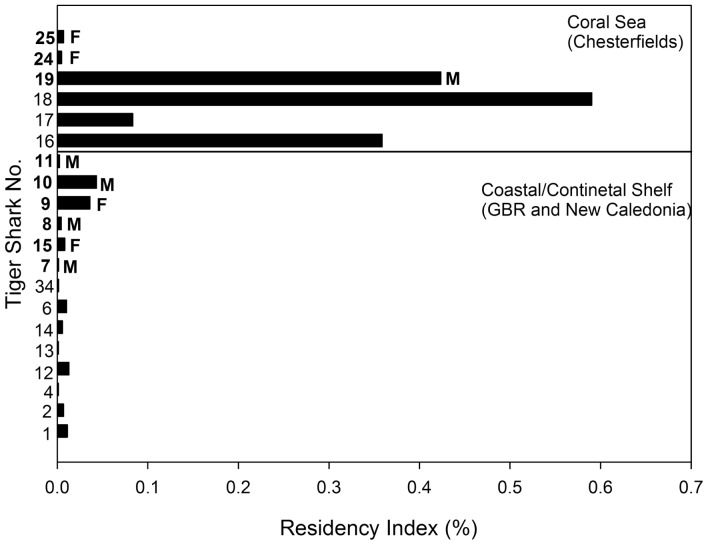
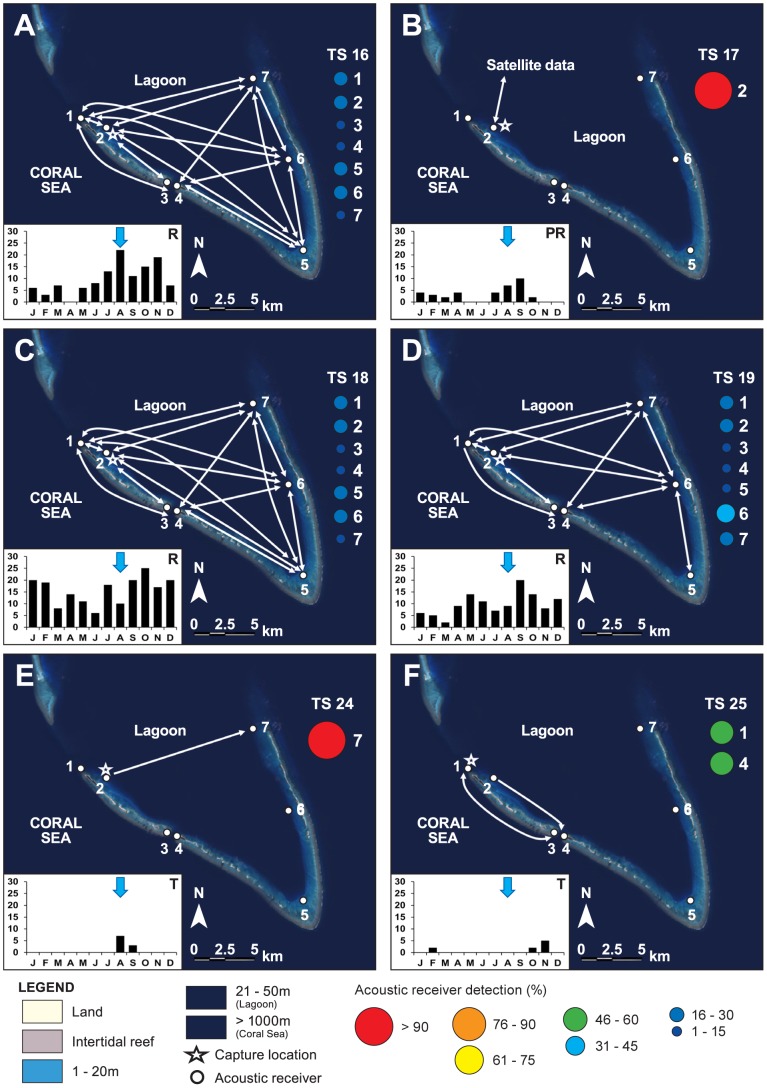
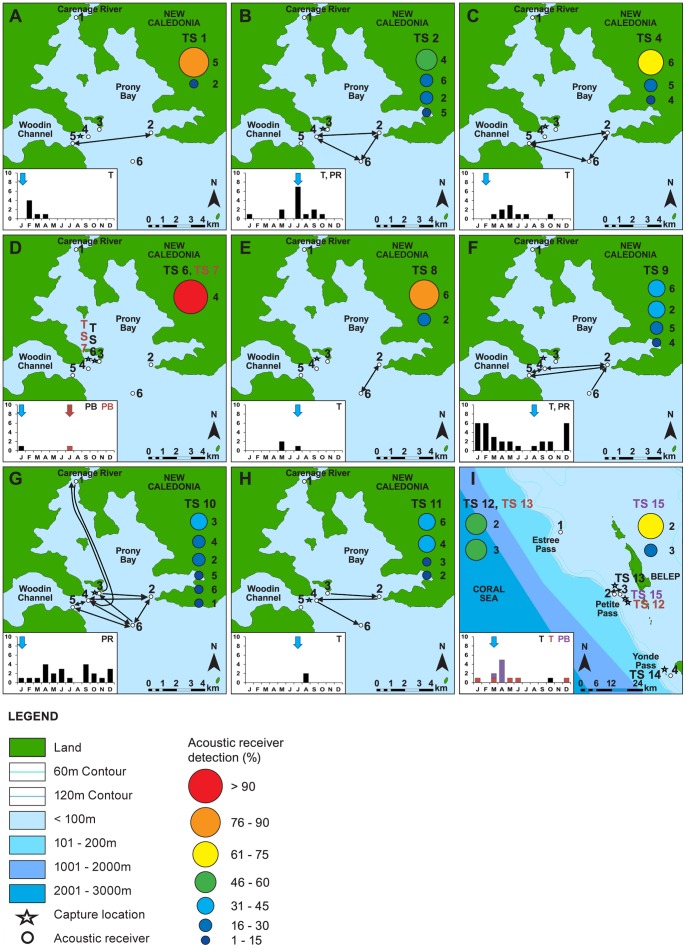
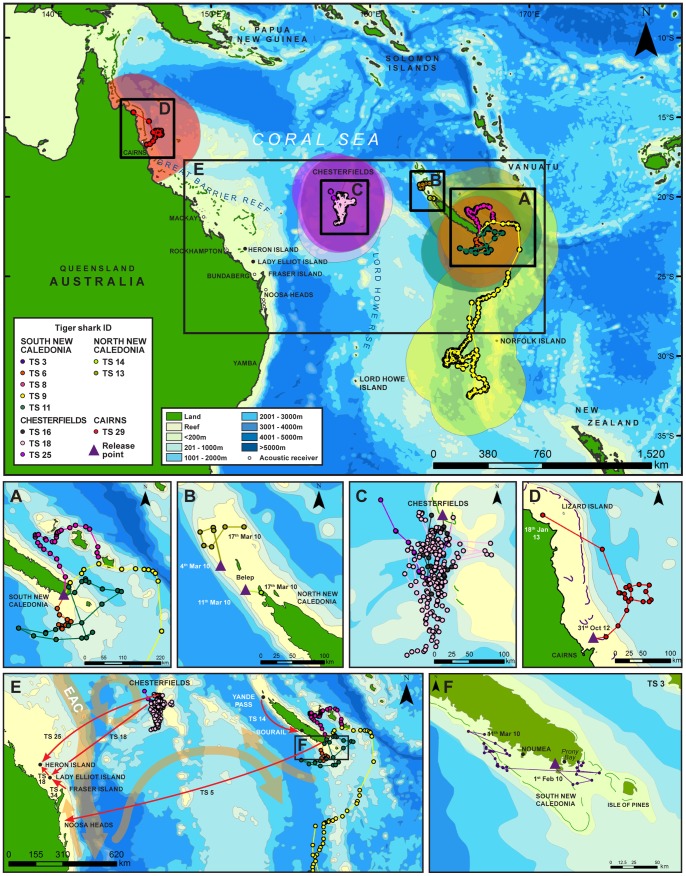
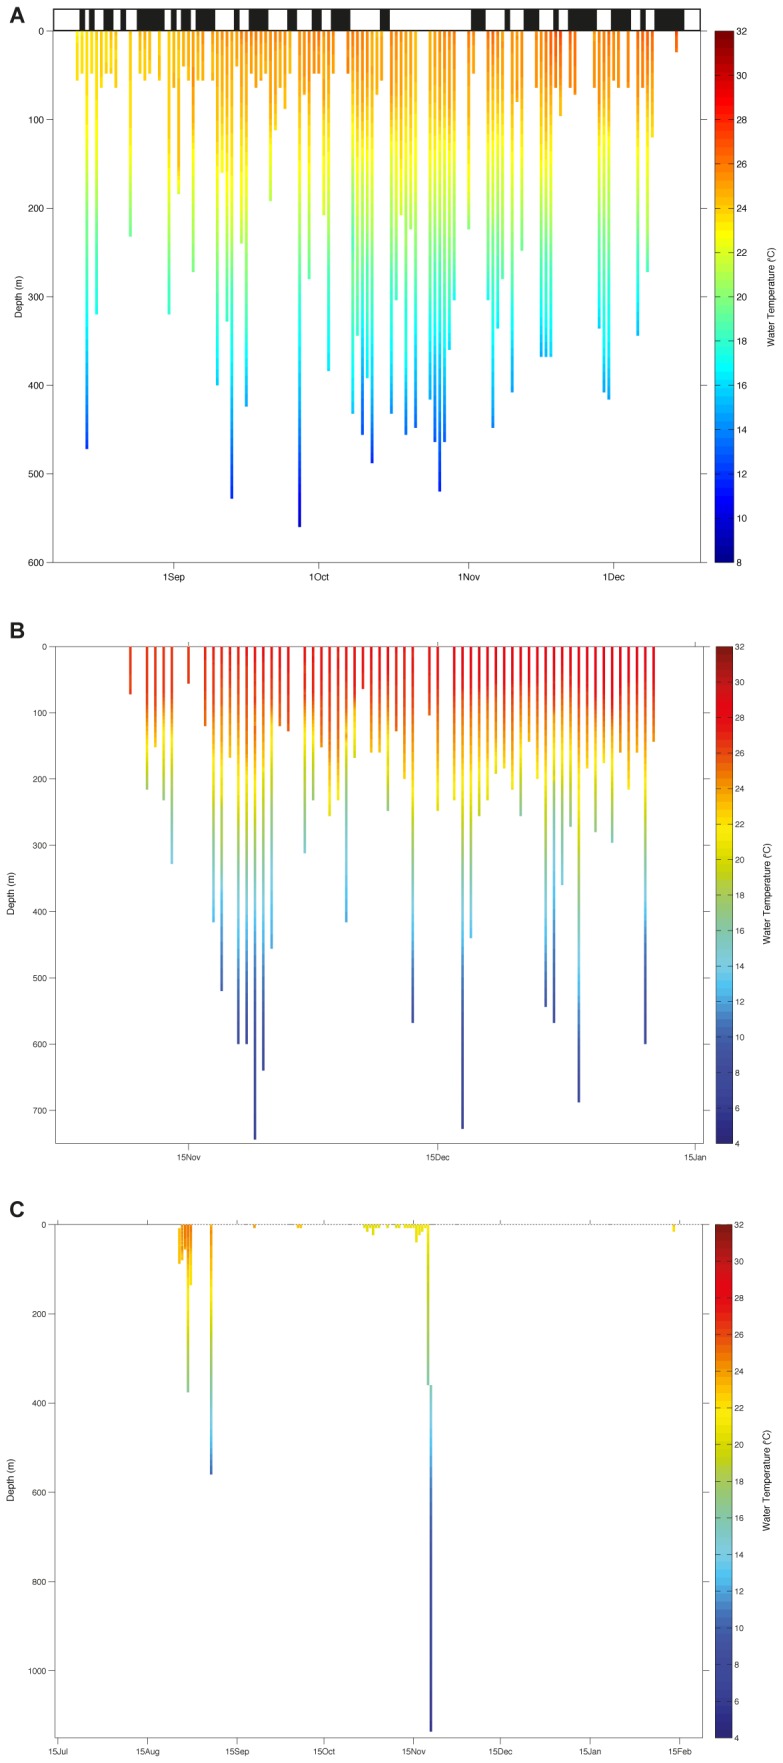
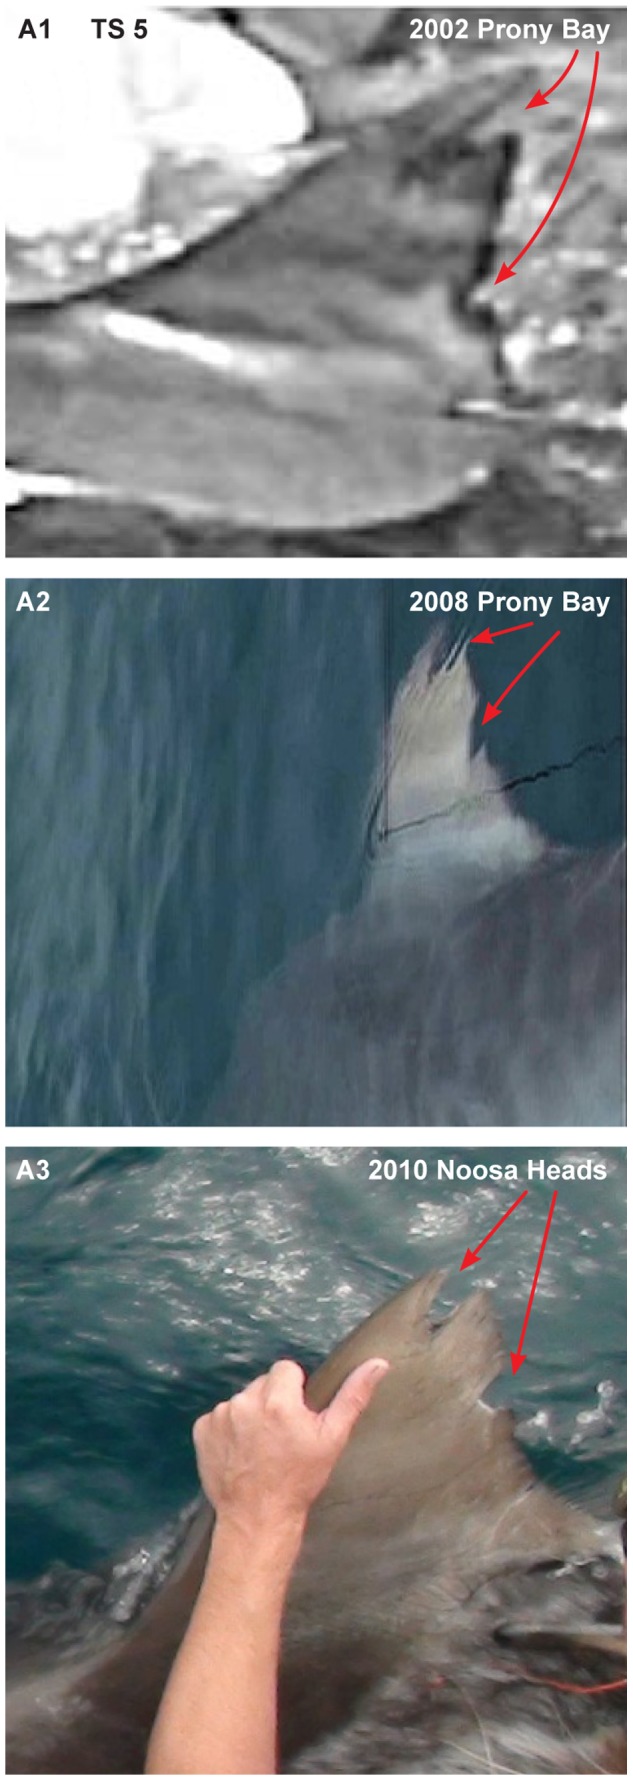
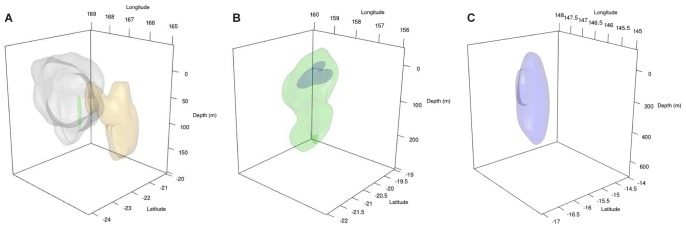
Knowledge of the habitat use and migration patterns of large sharks is important for assessing the effectiveness of large predator Marine Protected Areas (MPAs), vulnerability to fisheries and environmental influences, and management of shark-human interactions. Here we compare movement, reef-fidelity, and ocean migration for tiger sharks, Galeocerdo cuvier, across the Coral Sea, with an emphasis on New Caledonia. Thirty-three tiger sharks (1.54 to 3.9 m total length) were tagged with passive acoustic transmitters and their localised movements monitored on receiver arrays in New Caledonia, the Chesterfield and Lord Howe Islands in the Coral Sea, and the east coast of Queensland, Australia. Satellite tags were also used to determine habitat use and movements among habitats across the Coral Sea. Sub-adults and one male adult tiger shark displayed year-round residency in the Chesterfields with two females tagged in the Chesterfields and detected on the Great Barrier Reef, Australia, after 591 and 842 days respectively. In coastal barrier reefs, tiger sharks were transient at acoustic arrays and each individual demonstrated a unique pattern of occurrence. From 2009 to 2013, fourteen sharks with satellite and acoustic tags undertook wide-ranging movements up to 1114 km across the Coral Sea with eight detected back on acoustic arrays up to 405 days after being tagged. Tiger sharks dove 1136 m and utilised three-dimensional activity spaces averaged at 2360 km³. The Chesterfield Islands appear to be important habitat for sub-adults and adult male tiger sharks. Management strategies need to consider the wide-ranging movements of large (sub-adult and adult) male and female tiger sharks at the individual level, whereas fidelity to specific coastal reefs may be consistent across groups of individuals. Coastal barrier reef MPAs, however, only afford brief protection for large tiger sharks, therefore determining the importance of other oceanic Coral Sea reefs should be a priority for future research.


Conflict of interest statement

Competing Interests: Dr. E. Clua is employed by CRISP. The authors’ affiliation with CRISP does not alter their adherence to all the PLOS ONE policies on sharing data and materials.

Figures

Figure 1
Figure 1. Seamounts and surrounding bathymetry across the Coral Sea between New Caledonia and Australia.
Acoustic receiver array locations are shown along the east coast of Queensland, Australia and the southern Great Barrier Reef and inserts. Different shades of blue in the legend indicate different water depths.
Figure 2
Figure 2. Restraint of 3.8 m tiger shark in harness.
Figure 3
Figure 3. Temporal occurrence of tiger sharks tagged at New Caledonia (Southern Province, Belep), the southern GBR and the Chesterfield Islands in the Coral Sea with acoustic tags.
Individual sharks are numbered with sex (M = male; F = female) (see Table 1) and arranged by increasing body size from top to bottom within each study location. Numbers are bolded for mature sharks. Note shark 34 F was tagged at Fraser Island (Australia) and 14 M was detected at Bourail (New Caledonia) after being tagged at Yande Pass (Table 1). χ refers to tagging date. Blue dots indicate detections in the respective acoustic arrays. Δ refers to end of available reception period for an acoustic array or tag.
Figure 4
Figure 4. Residency Index (RI) of tiger sharks tagged at New Caledonia, the southern GBR and the Chesterfield Islands in the Coral Sea with acoustic tags.
Individual sharks are numbered (see Table 1) and arranged by increasing body size from top to bottom for those tagged in the Coral Sea (top section) and those in New Caledonia/GBR (bottom section). Numbers are bolded and sex (M = male; F = female) shown for mature sharks.
Figure 5
Figure 5. Spatial occurrence of tiger sharks tagged at the Chesterfield Islands in the Coral Sea with acoustic tags.
Individual tiger shark numbers correspond to Table 1. Arrows indicate direction of movement between receivers; double headed arrows indicate repeated movements between receivers. Coloured bubbles indicate the proportion of detections at numbered acoustic receivers. Shades of blue in the legend are labelled to indicate different water depths. Inset bar graphs indicate the number of days detected in each month and localised behaviours; PB (Passer-by), T (Transient), PR (Pseudo-Resident), R (Resident). Blue arrows indicate the month of capture.
Figure 6
Figure 6. Spatial Occurrence of tiger sharks within the Southern Province (A to H) and Northern Province (I) monitoring arrays in New Caledonia (see Fig. 1).
Individual tiger shark numbers correspond to Table 1. Arrows indicate direction of movement between receivers; double headed arrows indicate repeated movements between receivers. Coloured bubbles indicate the proportion of detections at numbered acoustic receivers. Different shades of blue in the legend indicate different water depths. Inset bar graphs indicate the number of days detected in each month and localised behaviours; PB (Passer-by), T (Transient), PR (Pseudo-Resident), R (Resident). Bar graph arrows indicate the month of capture. Numbers alongside the bubbles correspond to receiver number.
Figure 7
Figure 7. Spatial patterns of tiger shark movements across the Coral Sea between 2008 and 2013.
Bubble plots show 95% confidence interval envelope for PSAT tracks. (A) Satellite tracks of PSAT tiger sharks tagged in the Southern lagoon of New Caledonia; (B) SPOT satellite tagged tiger sharks in the north of New Caledonia; (C) PSAT tiger sharks in the Chesterfield Islands, and (D) off Cairns in the GBR. (E) Includes the straight distance between the first photo-ID spotting of TS5 in New Caledonia and the second on the east coast of Australia. (F) The movement of a juvenile TS in the south of New Caledonia. Red arrows indicate movements from point of release to detection on spatially separated array for tiger sharks with acoustic tags. Orange arrows indicate generalised patterns/directions of major currents within the region of tiger shark migration. EAC refers to the East Australian Current.
Figure 8
Figure 8. Depth-temperature profiles of selected PSAT tagged tiger sharks.
(A) TS25 Chesterfield Islands, (B) TS11 South lagoon of New Caledonia, and (C) TS9 South Lagoon of New Caledonia. Black bars above A refer to periods of acoustic detection in the Chesterfield array. Note differing spatial and temporal scales.
Figure 9
Figure 9. Resightings of individual tiger shark based on dorsal fins.
Arrows highlight the distinguishing features of the individual sharks fin. Note A1 was identified by Clua et al. . The photo taken in A3 is after a tissue sample was taken from the second notch in the shark’s dorsal fin.
Figure 10
Figure 10. Individual 3D (95%) activity space of satellite tagged tiger sharks in the Coral Sea.
(A) South New Caledonia: Green TS 6, Orange TS 8, Grey TS 11, (B) Chesterfields: Blue TS 16, Green TS 18, (C) Cairns: Purple TS 29.

References

    1. Myers RA, Baum JK, Shepherd TD, Powers SP, Peterson CH (2007) Cascading effects of the loss of apex predatory sharks from a coastal ocean. Sci 315: 1846–1850. - PubMed
    1. O’Connell MT, Shepard TD, O’Connell AMU, Myers RA (2007) Long-term declines in two apex predators, bull sharks (Carcharinus leucas) and alligator gar (Atractosteus spatula), in lake pontchartrain, an oligohaline estuary in southeastern Louisiana. Estuaries Coast 30 (4): 567–574.
    1. Ruttenberg BI, Hamilton SL, Walsh SM, Donovan MK, Friedlander A, et al. (2011) Predator-induced demographic shifts in coral reef fish assemblages. PLoS ONE 6(6): e21062. - PMC - PubMed
    1. Dulvy NK, Freckleton RP, Polunin VC (2004) Coral reef cascades and the indirect effects of predator removal by exploitation. Ecol Lett 7 (5): 410–416.
    1. Bascompte J, Melian CJ, Sala E (2005) Interaction strength combinations and the overfishing of a marine food web. Proc Nat Aca Sc USA 102 (15): 5443–5447. - PMC - PubMed

Publication types

LinkOut - more resources