Sodium deficiency regulates rat adrenal zona glomerulosa gene expression
- PMID: 24422541
- PMCID: PMC3959598
- DOI: 10.1210/en.2013-1999
Sodium deficiency regulates rat adrenal zona glomerulosa gene expression
Erratum in
-
ERRATUM FOR "Sodium Deficiency Regulates Rat Adrenal Zona Glomerulosa Gene Expression".Endocrinology. 2018 Jun 1;159(6):2307. doi: 10.1210/en.2018-00396. Endocrinology. 2018. PMID: 29718192 Free PMC article. No abstract available.
Abstract
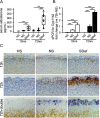
Aldosterone is the primary adrenocortical hormone regulating sodium retention, and its production is under the control of the renin-angiotensin-aldosterone system (RAAS). In vitro, angiotensin II can induce aldosterone production in adrenocortical cells without causing cell proliferation. In vivo, a low-sodium diet activates the RAAS and aldosterone production, at least in part, through an expansion of the adrenal zona glomerulosa (zG) layer. Although these mechanisms have been investigated, RAAS effects on zG gene expression have not been fully elucidated. In this study, we took an unbiased approach to define the complete list of zG transcripts involved in RAAS activation. Adrenal glands were collected from 11-week old Sprague-Dawley rats fed either sodium-deficient (SDef), normal sodium (NS), or high-sodium (HS) diet for 72 hours, and laser-captured zG RNA was analyzed on microarrays containing 27 342 probe sets. When the SDef transcriptome was compared with NS transcriptome (SDef/NS comparison), only 79 and 10 probe sets were found to be up- and down-regulated more than two-fold in SDef, respectively. In SDef/HS comparison, 201 and 68 probe sets were up- and down-regulated in SDef, respectively. Upon gene ontology (GO) analysis of these gene sets, we identified three groups of functionally related GO terms: cell proliferation-associated (group 1), response to stimulus-associated (group 2), and cholesterol/steroid metabolism-associated (group 3) GO terms. Although genes in group 1 may play a critical role in zG layer expansion, those in groups 2 and 3 may have important functions in aldosterone production, and further investigations on these genes are warranted.
Figures


Similar articles
-
Effect of Dietary Sodium Modulation on Pig Adrenal Steroidogenesis and Transcriptome Profiles.Hypertension. 2020 Dec;76(6):1769-1777. doi: 10.1161/HYPERTENSIONAHA.120.15998. Epub 2020 Oct 19. Hypertension. 2020. PMID: 33070662 Free PMC article.
-
cGMP-dependent protein kinase type II regulates basal level of aldosterone production by zona glomerulosa cells without increasing expression of the steroidogenic acute regulatory protein gene.J Biol Chem. 2003 Aug 8;278(32):29640-8. doi: 10.1074/jbc.M302143200. Epub 2003 May 29. J Biol Chem. 2003. PMID: 12775716
-
In vivo regulation of gene expression of enzymes controlling aldosterone synthesis in rat adrenal.J Steroid Biochem Mol Biol. 1992 Dec;43(8):837-46. doi: 10.1016/0960-0760(92)90310-F. J Steroid Biochem Mol Biol. 1992. PMID: 22217827
-
Lessons from the gene expression pattern of the rat zona glomerulosa.Mol Cell Endocrinol. 2013 May 22;371(1-2):107-13. doi: 10.1016/j.mce.2012.12.023. Epub 2012 Dec 31. Mol Cell Endocrinol. 2013. PMID: 23287491 Free PMC article. Review.
-
Role of voltage-gated calcium channels in the regulation of aldosterone production from zona glomerulosa cells of the adrenal cortex.J Physiol. 2016 Oct 15;594(20):5851-5860. doi: 10.1113/JP271896. Epub 2016 Mar 4. J Physiol. 2016. PMID: 26845064 Free PMC article. Review.
Cited by
-
DNA methylation patterns and predictive models for metabolic disease risk in offspring of gestational diabetes mellitus.Diabetol Metab Syndr. 2025 May 2;17(1):147. doi: 10.1186/s13098-025-01707-7. Diabetol Metab Syndr. 2025. PMID: 40312441 Free PMC article.
-
Adrenocortical stem cells in health and disease.Nat Rev Endocrinol. 2025 Aug;21(8):464-481. doi: 10.1038/s41574-025-01091-2. Epub 2025 Mar 10. Nat Rev Endocrinol. 2025. PMID: 40065108 Review.
-
Beta-Catenin Causes Adrenal Hyperplasia by Blocking Zonal Transdifferentiation.Cell Rep. 2020 Apr 21;31(3):107524. doi: 10.1016/j.celrep.2020.107524. Cell Rep. 2020. PMID: 32320669 Free PMC article.
-
Immunohistochemistry of aldosterone synthase leads the way to the pathogenesis of primary aldosteronism.Mol Cell Endocrinol. 2017 Feb 5;441:124-133. doi: 10.1016/j.mce.2016.10.014. Epub 2016 Oct 14. Mol Cell Endocrinol. 2017. PMID: 27751767 Free PMC article. Review.
-
Regulation of zonation and homeostasis in the adrenal cortex.Mol Cell Endocrinol. 2017 Feb 5;441:146-155. doi: 10.1016/j.mce.2016.09.003. Epub 2016 Sep 9. Mol Cell Endocrinol. 2017. PMID: 27619404 Free PMC article. Review.
References
-
- Stewart PM. The adrenal cortex. In: Kronenberg HM, Melmed S, Polonsky KS, Larsen PR, eds. Williams Textbook of Endocrinology. 11th ed Philadelphia, PA: Saunders Elsevier; 2007:445–504
-
- Singh AK, Williams GH. Textbook of Nephro-Endocrinology. San Diego, CA: Elsevier, Inc; 2009
-
- Mitani F, Suzuki H, Hata J, Ogishima T, Shimada H, Ishimura Y. A novel cell layer without corticosteroid-synthesizing enzymes in rat adrenal cortex: histochemical detection and possible physiological role. Endocrinology. 1994;135:431–438 - PubMed
-
- Nogueira EF, Vargas CA, Otis M, Gallo-Payet N, Bollag WB, Rainey WE. Angiotensin-II acute regulation of rapid response genes in human, bovine, and rat adrenocortical cells. J Mol Endocrinol. 2007;39:365–374 - PubMed
Publication types
MeSH terms
Substances
Grants and funding
LinkOut - more resources
Full Text Sources
Other Literature Sources
Miscellaneous

