. 2014 Mar;99(3):E518-27.
doi: 10.1210/jc.2013-3198. Epub 2013 Jan 1.

Transcriptome profiling reveals differentially expressed transcripts between the human adrenal zona fasciculata and zona reticularis

Affiliations

Transcriptome profiling reveals differentially expressed transcripts between the human adrenal zona fasciculata and zona reticularis

Juilee Rege et al. J Clin Endocrinol Metab. 2014 Mar.

Abstract

Context: The human adrenal zona fasciculata (ZF) and zona reticularis (ZR) are responsible for the production of cortisol and 19-carbon steroids (often called adrenal androgens), respectively. However, the gene profiles and exact molecular mechanisms leading to the functional phenotype of the ZF and ZR are still not clearly defined. In the present study, we identified the transcripts that are differentially expressed in the ZF and ZR.

Objective: The objective of the study was to compare the transcriptome profiles of ZF and ZR.

Design and methods: ZF and ZR were microdissected from 10 human adrenals. Total RNA was extracted from 10 ZF/ZR pairs and hybridized to Illumina microarray chips. The 10 most differentially expressed transcripts were studied with quantitative RT-PCR (qPCR). Immunohistochemistry was also performed on four zone-specific genes.

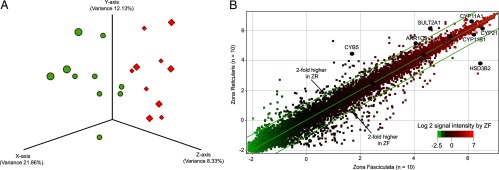
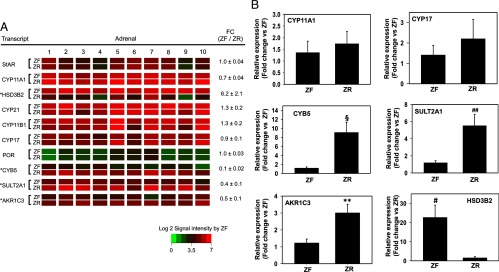
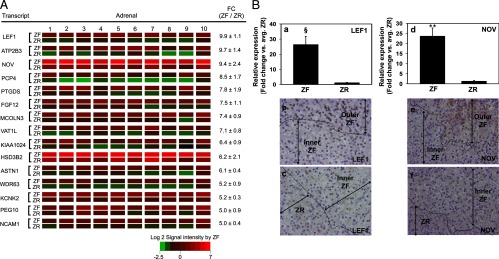
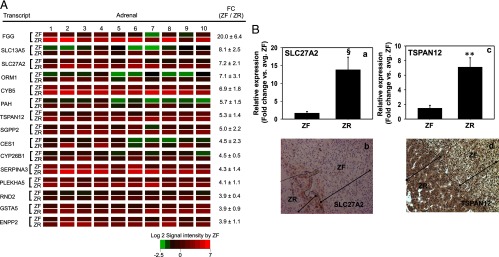
Results: Microarray results demonstrated that only 347 transcripts of the 47 231 were significantly different by 2-fold or greater in the ZF and ZR. ZF had 195 transcripts with 2-fold or greater increase compared with its paired ZR, whereas ZR was found to have 152 transcripts with 2-fold or greater higher expression than in ZF. Microarray and qPCR analysis of transcripts encoding steroidogenic enzymes (n = 10) demonstrated that only 3β-hydroxysteroid dehydrogenase, steroid sulfotransferase, type 5 17β-hydroxysteroid dehydrogenase, and cytochrome b5 were significantly different. Immunohistochemistry and qPCR studies confirmed that the ZF had an increased expression of lymphoid enhancer-binding factor 1 and nephroblastoma overexpressed, whereas ZR showed an increased expression of solute carrier family 27 (fatty acid transporter) (SLC27A2), member 2 and TSPAN12 (tetraspanin 12) CONCLUSION: Microarray revealed several novel candidate genes for elucidating the molecular mechanisms governing the ZF and ZR, thereby increasing our understanding of the functional zonation of these two adrenocortical zones.


Figures

Figure 1.
Figure 1.
A, PCA of microarray data. PCA three-dimensional scatterplot uses the expression of the all of the 47 231 independent transcripts on the normalized microarray platform [diamonds in red and spheres in green represent individual ZF and ZR samples (n = 10 each)]. B, Microarray scatterplot showing pooled data for ZF and ZR from 10 adrenals. Each spot indicates a unique probe with a total of 47 231 independent transcripts based on normalized microarray data. Spots outside the parallel lines represent transcripts with greater than 2-fold differences in expression. The transcripts involved in steroidogenesis are indicated as black circles.
Figure 2.
Figure 2.
A, Heat map representation of microarray analysis for transcripts encoding genes involved steroidogenesis in ZF vs ZR (n = 10). Normalized log2 signal intensity acquired from microarray analysis is represented by color (see color bar). Fold change was calculated as the average of normalized ZF signal intensities divided by that of normalized ZR signal intensities. Data are represented as mean ± SEM. FC, fold change. *, P < .01, by paired t test. B, Validation of microarray analysis by real-time qPCR for selected transcripts encoding genes involved in steroidogenesis in ZF vs ZR. CYP11A1 and CYP17 remain unchanged, whereas HSD3B2, CYB5, AKR1C3, and SULT2A1 were found to be significantly different between ZF and ZR. #, P < .01, §, P < .005, **, P < .001, ##, P < .05, by paired t test. Ten ZF-ZR pairs were used for the qPCR analysis.
Figure 3.
Figure 3.
A, Heat map representation of microarray analysis for the 15 transcripts with the highest differential expression in ZF vs ZR (n = 10). Normalized log2 signal intensity acquired from microarray analysis is represented by color (see color bar). Fold change was calculated as the average of normalized ZF signal intensities divided by that of normalized ZR signal intensities. Data are represented as mean ± SEM. FC, fold change. All transcripts showed a significance of P < .05. B, Quantitative RT-PCR and immunohistochemical analysis for ZF-expressed LEF1 and NOV. Validation of microarray analysis was done by real-time qPCR (a and d) and immunohistochemistry (b, c, e, and f) for transcripts with high differential expression in ZF vs ZR, namely LEF1 and NOV. Both LEF1 and NOV showed a higher expression in the outer ZF as compared with the inner ZF and ZR. Ten ZF-ZR pairs were used for the qPCR analysis. §, P < .005, **, P < .001, by paired t test.
Figure 4.
Figure 4.
A, Heat map representation of microarray analysis for the 15 transcripts with the highest differential expression in ZR vs ZF (n = 10). Normalized log2 signal intensity acquired from the microarray analysis is represented by color (see color bar). Fold change was calculated as the average of normalized ZF signal intensities divided by that of normalized ZR signal intensities. Data are represented as mean ± SEM. FC, fold change. All transcripts showed a significance of P < .05. B, Quantitative RT-PCR and immunohistochemical analysis for ZR-expressed SLC27A2 and TSPAN12. Validation of microarray analysis was done by real-time qPCR (a and c) and immunohistochemistry (b and d) for transcripts with high differential expression in ZR vs ZF, namely SLC27A2 and TSPAN12. Ten ZF-ZR pairs were used for the qPCR analysis. §, P < .005, **, P < .001, by paired t test.

References

    1. Arnold J. Ein beitrag zu der feiner struktur und dem chemismus der nebennieren. Virchows Arch. 1866;35:64–107
    1. Vinson GP. Adrenocortical zonation and ACTH. Microsc Res Tech. 2003;61:227–239 - PubMed
    1. Vinson GP, Ho MM. Origins of zonation: the adrenocortical model of tissue development and differentiation. Clin Exp Pharmacol Physiol Suppl. 1998;25:S91–S96 - PubMed
    1. Hornsby PJ. Biosynthesis of DHEA(S) by the human adrenal cortex and its age-related decline. Ann NY Acad Sci. 1995;774:29–46 - PubMed
    1. Parker LN, Odell WD. Control of adrenal androgen secretion. Endocr Rev. 1980;1:392–410 - PubMed

Publication types

MeSH terms

LinkOut - more resources