

Action planning and predictive coding when speaking
- PMID: 24423729
- PMCID: PMC3965634
- DOI: 10.1016/j.neuroimage.2014.01.003
Action planning and predictive coding when speaking
Abstract
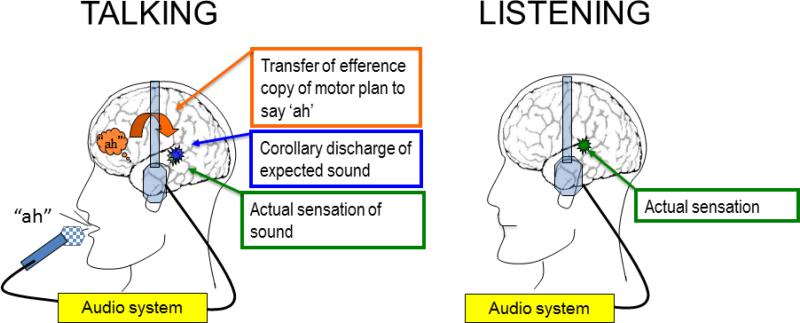
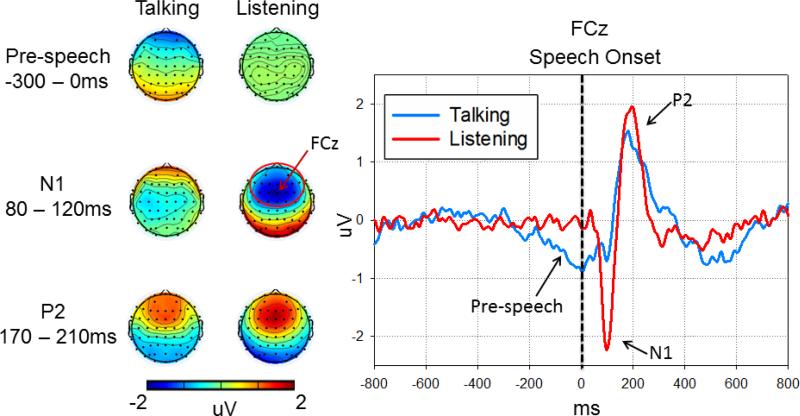
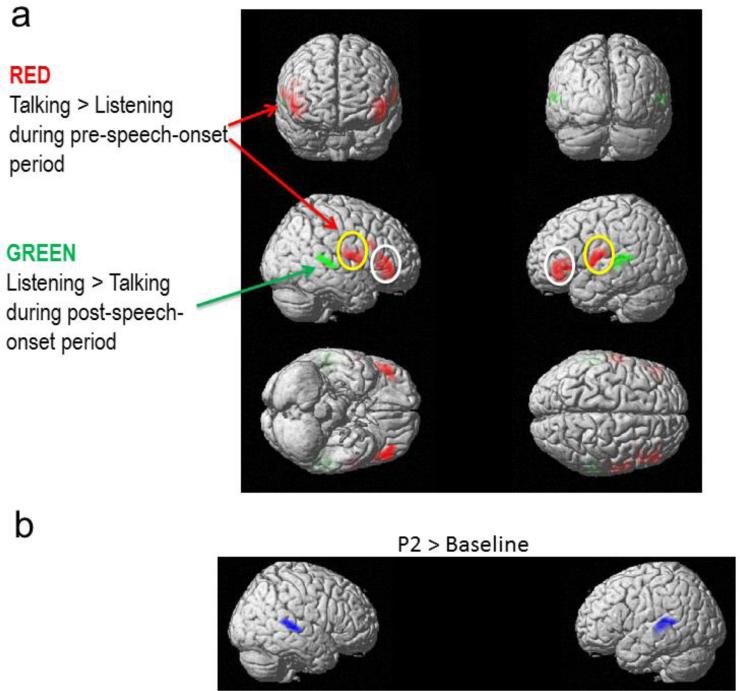
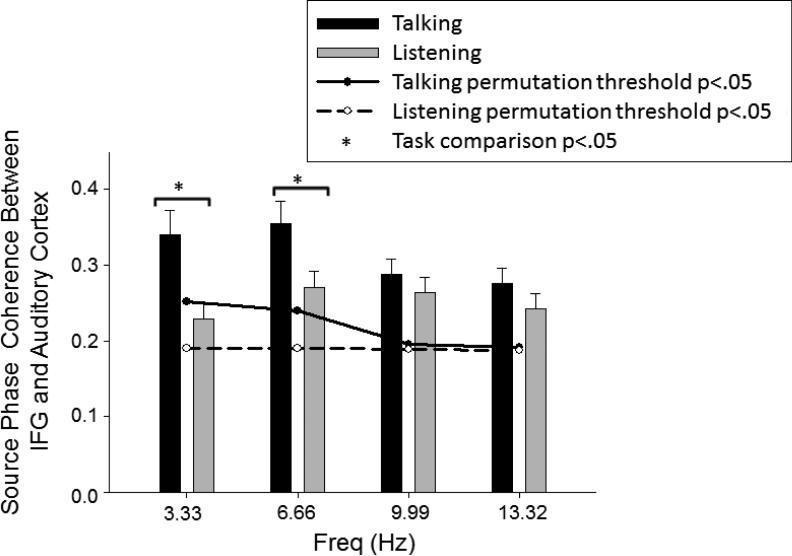
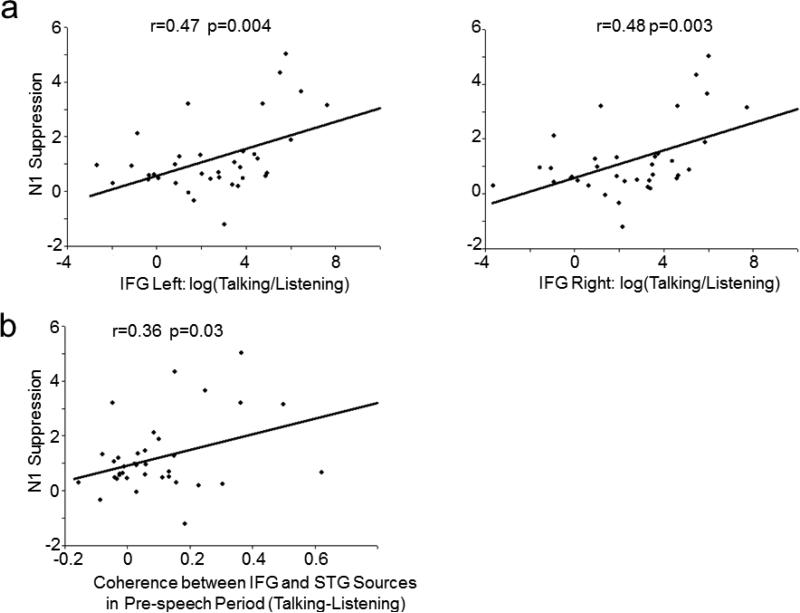
Across the animal kingdom, sensations resulting from an animal's own actions are processed differently from sensations resulting from external sources, with self-generated sensations being suppressed. A forward model has been proposed to explain this process across sensorimotor domains. During vocalization, reduced processing of one's own speech is believed to result from a comparison of speech sounds to corollary discharges of intended speech production generated from efference copies of commands to speak. Until now, anatomical and functional evidence validating this model in humans has been indirect. Using EEG with anatomical MRI to facilitate source localization, we demonstrate that inferior frontal gyrus activity during the 300ms before speaking was associated with suppressed processing of speech sounds in auditory cortex around 100ms after speech onset (N1). These findings indicate that an efference copy from speech areas in prefrontal cortex is transmitted to auditory cortex, where it is used to suppress processing of anticipated speech sounds. About 100ms after N1, a subsequent auditory cortical component (P2) was not suppressed during talking. The combined N1 and P2 effects suggest that although sensory processing is suppressed as reflected in N1, perceptual gaps may be filled as reflected in the lack of P2 suppression, explaining the discrepancy between sensory suppression and preserved sensory experiences. These findings, coupled with the coherence between relevant brain regions before and during speech, provide new mechanistic understanding of the complex interactions between action planning and sensory processing that provide for differentiated tagging and monitoring of one's own speech, processes disrupted in neuropsychiatric disorders.
Keywords: Corollary discharge; Efference copy; IFG; STG.
Published by Elsevier Inc.
Figures
Similar articles
-
Deficient auditory predictive coding during vocalization in the psychosis risk syndrome and in early illness schizophrenia: the final expanded sample.Psychol Med. 2019 Aug;49(11):1897-1904. doi: 10.1017/S0033291718002659. Epub 2018 Sep 25. Psychol Med. 2019. PMID: 30249315
-
Electrophysiological evidence of corollary discharge dysfunction in schizophrenia during talking and thinking.J Psychiatr Res. 2004 Jan;38(1):37-46. doi: 10.1016/s0022-3956(03)00095-5. J Psychiatr Res. 2004. PMID: 14690769
-
Efference copy/corollary discharge function and targeted cognitive training in patients with schizophrenia.Int J Psychophysiol. 2019 Nov;145:91-98. doi: 10.1016/j.ijpsycho.2018.12.015. Epub 2018 Dec 29. Int J Psychophysiol. 2019. PMID: 30599145 Free PMC article. Clinical Trial.
-
Speaking-Induced Suppression of the Auditory Cortex in Humans and Its Relevance to Schizophrenia.Biol Psychiatry Cogn Neurosci Neuroimaging. 2019 Sep;4(9):791-804. doi: 10.1016/j.bpsc.2019.05.011. Epub 2019 May 30. Biol Psychiatry Cogn Neurosci Neuroimaging. 2019. PMID: 31399393 Review.
-
Stimulus-dependent activations and attention-related modulations in the auditory cortex: a meta-analysis of fMRI studies.Hear Res. 2014 Jan;307:29-41. doi: 10.1016/j.heares.2013.08.001. Epub 2013 Aug 11. Hear Res. 2014. PMID: 23938208 Review.
Cited by
-
Using concurrent EEG and fMRI to probe the state of the brain in schizophrenia.Neuroimage Clin. 2016 Aug 10;12:429-41. doi: 10.1016/j.nicl.2016.08.009. eCollection 2016. Neuroimage Clin. 2016. PMID: 27622140 Free PMC article.
-
Corollary Discharge Dysfunction as a Possible Substrate of Anomalous Self-experiences in Schizophrenia.Schizophr Bull. 2024 Aug 27;50(5):1137-1146. doi: 10.1093/schbul/sbad157. Schizophr Bull. 2024. PMID: 37951230 Free PMC article.
-
Active inference, communication and hermeneutics.Cortex. 2015 Jul;68:129-43. doi: 10.1016/j.cortex.2015.03.025. Epub 2015 Apr 15. Cortex. 2015. PMID: 25957007 Free PMC article. Review.
-
A neurophysiological model of speech production deficits in fragile X syndrome.Brain Commun. 2020;2(1):fcz042. doi: 10.1093/braincomms/fcz042. Epub 2019 Dec 9. Brain Commun. 2020. PMID: 32924010 Free PMC article.
-
Attenuation of visual reafferent signals in the parietal cortex during voluntary movement.J Neurophysiol. 2016 Oct 1;116(4):1831-1839. doi: 10.1152/jn.00231.2016. Epub 2016 Jul 27. J Neurophysiol. 2016. PMID: 27466131 Free PMC article.
References
-
- Baess P, Jacobsen T, Schröger E. Suppression of the auditory N1 event-related potential component with unpredictable self-initiated tones: evidence for internal forward models with dynamic stimulation. International Journal of Psychophysiology. 2008;70:137–143. - PubMed
-
- Bosnyak DJ, Eaton RA, Roberts LE. Distributed auditory cortical representations are modified when non-musicians are trained at pitch discrimination with 40 Hz amplitude modulated tones. Cerebral Cortex. 2004;14:1088–1099. - PubMed
-
- Brett M, Anton J-L, Valabregue R, Poline J-B. Region of interest analysis using an SPM toolbox. In: NeuroImage V, editor. 8th International Conference on Functional Mapping of the Human Brain; Sendai, Japan. 2002. No 2.
-
- Burr DC, Morrone MC. Constructing stable spatial maps of the world. Perception. 2012;41:1355–1372. - PubMed
Publication types
MeSH terms
Grants and funding
LinkOut - more resources
Full Text Sources
Other Literature Sources
Medical
