

Dependency of planned dose perturbation (PDP) on the spatial resolution of MapCHECK 2 detectors
- PMID: 24423843
- PMCID: PMC5711226
- DOI: 10.1120/jacmp.v15i1.4457
Dependency of planned dose perturbation (PDP) on the spatial resolution of MapCHECK 2 detectors
Abstract
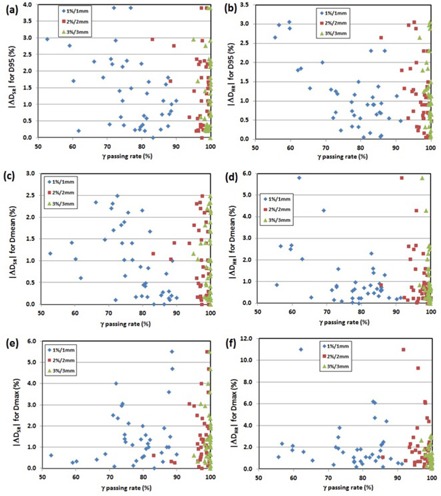
The purpose of this study is to determine the dependency of the planned dose perturbation (PDP) algorithm (used in Sun Nuclear 3DVH software) on spatial resolution of the MapCHECK 2 detectors. In this study, ten brain (small target), ten brain (large target), ten prostate, and ten head-and-neck (H&N) cases were retrospectively selected for QA measurement. IMRT validation plans were delivered using the field-by-field technique with the MapCHECK 2 device. The measurements were performed using standard detector density (standard resolution; SR) and a doubled detector density (high resolution; HR) by merging regular with shifted measurements. SR and HR measurements were fed into the 3DVH software and ROI (region of interest), planning target volume (PTV), and organ at risk (OAR)) dose statistics (D95, Dmean, and Dmax) were determined for each. Differences of the dose statistics normalized to prescription dose for ROIs between original planning and PDP-perturbed planning were calculated for SR (ΔDSR) and HR (ΔDHR), and difference between ΔDSR and ΔDHR (ΔDSR-HR = ΔDSR - ΔDHR) was also calculated. In addition, 2D and 3D γ passing rates (GPRs) were determined for both resolutions, and a correlation between GPRs and ΔDSR or ΔDHR for PTV dose metrics was determined. No considerably high mean differences between ΔDSR and ΔDHR were found for almost all ROIs and plans (< 2%); however, |ΔDSR|, |ΔDHR|, and |ΔDSR-HR| for PTV were found to significantly increase as the PTV size decreased (e.g., PTV size < 5 cc). And statistically significant differences between SR and HR were observed for OARs proximal to targets in large brain target and H&N cases. As plan modulation represented by fractional MU/prescription dose (MU/cGy) became more complex, the 2D/3D GPRs tended to decrease; however, the modulation complexity did not make any noticeable distinctions in the DVH statistics of PTV between SR and HR, excluding the small brain cases whose PTVs were extremely small (PTV = 11.0 ± 10.1 cc). Moderate to strong negative correlations (-1 < r < -0.3) between GPRs and PTV dose metrics indicated that small clinical errors for PTV occur at the higher GPRs. In conclusion, doubling the detector density of the MapCHECK 2 device is recommended for small targets (i.e., PTV < 5 cc) and multiple targets with complex geometry with minimum setup error in the DVH-based plan evaluation.
Figures


References
-
- Low DA, Harms WB, Mutic S, Purdy JA. A technique for the quantitative evaluation of dose distributions. Med Phys. 1998;25(5):656–61. - PubMed
-
- Basran PS and Woo MK. An analysis of tolerance levels in IMRT quality assurance procedures. Med Phys. 2008;35(6):2300–07. - PubMed
-
- Ezzell GA, Burmeister JW, Dogan N, et al. IMRT commissioning: multiple institution planning and dosimetry comparisons, a report from AAPM Task Group 119. Med Phys. 2009;36(11):5359–73. - PubMed
MeSH terms
LinkOut - more resources
Full Text Sources
Other Literature Sources
Medical
Research Materials
