. 2014 Mar 15;127(Pt 6):1346-56.
doi: 10.1242/jcs.146373. Epub 2014 Jan 14.

Torin1-mediated TOR kinase inhibition reduces Wee1 levels and advances mitotic commitment in fission yeast and HeLa cells

Affiliations

Torin1-mediated TOR kinase inhibition reduces Wee1 levels and advances mitotic commitment in fission yeast and HeLa cells

Jane Atkin et al. J Cell Sci. .

Abstract

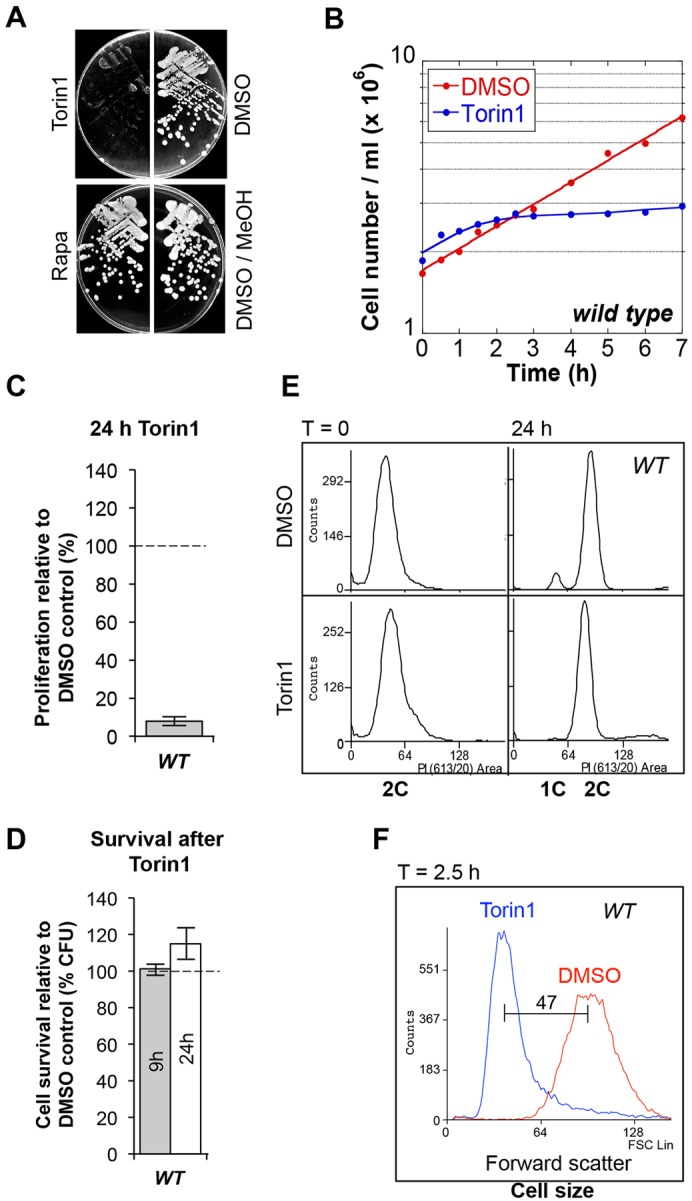
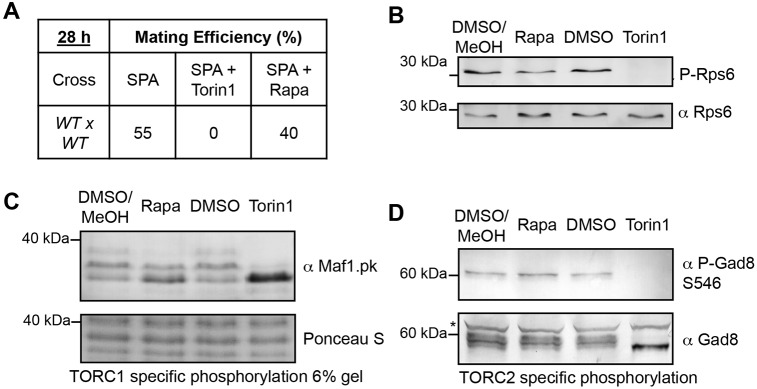
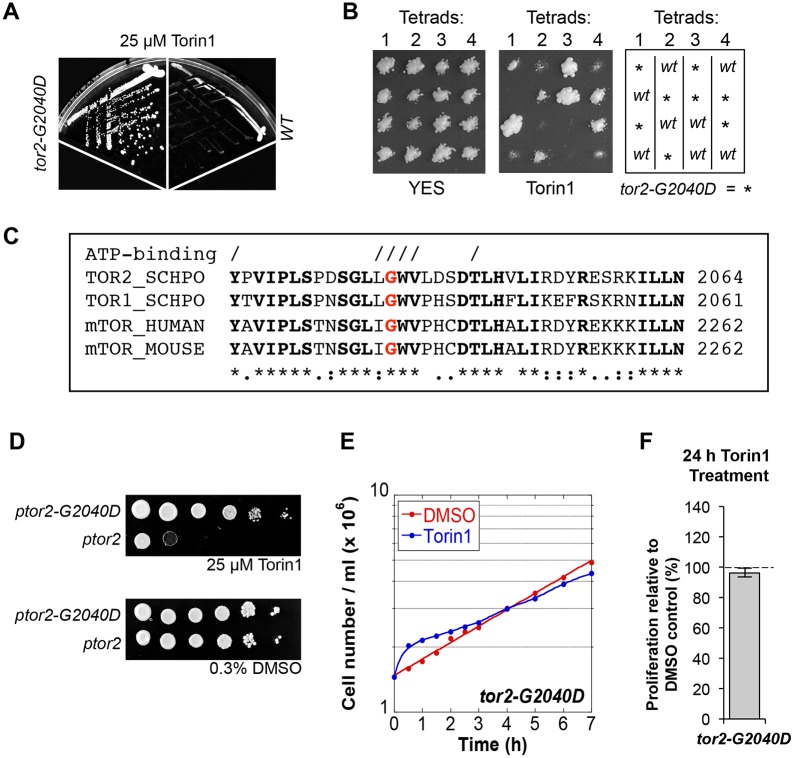
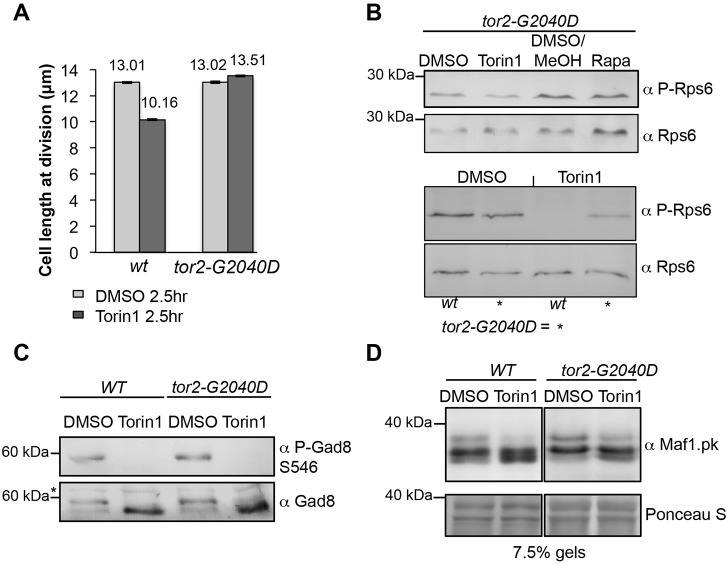
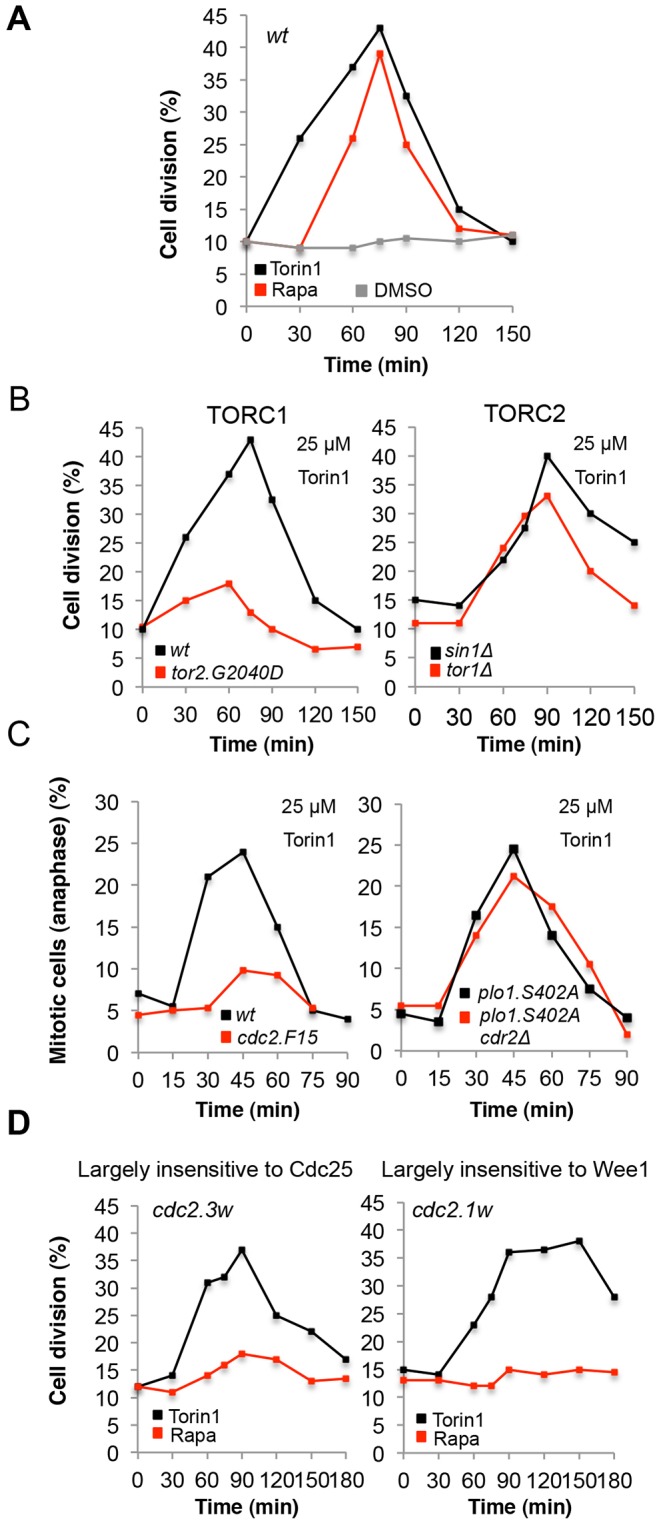
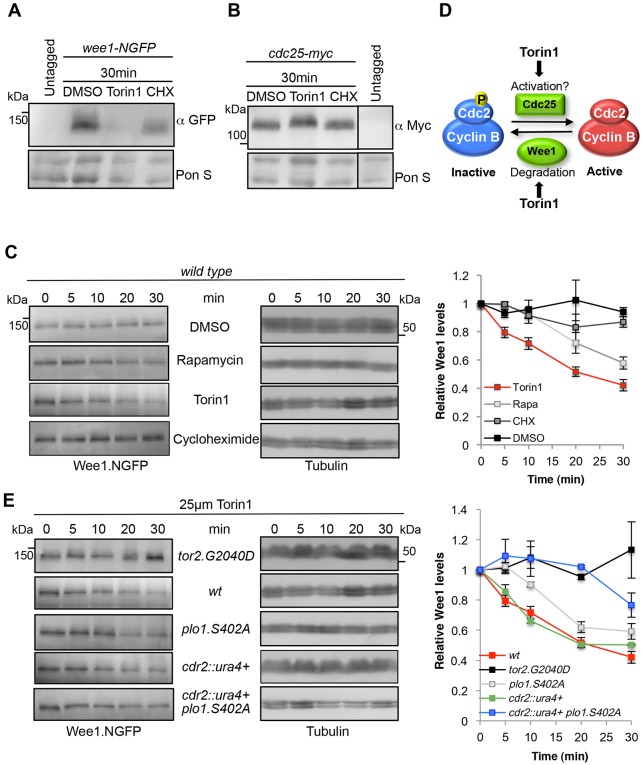
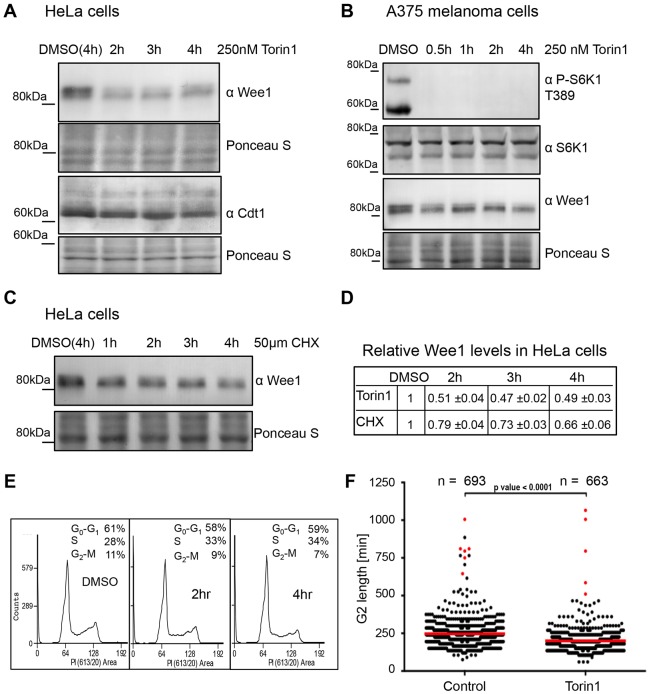
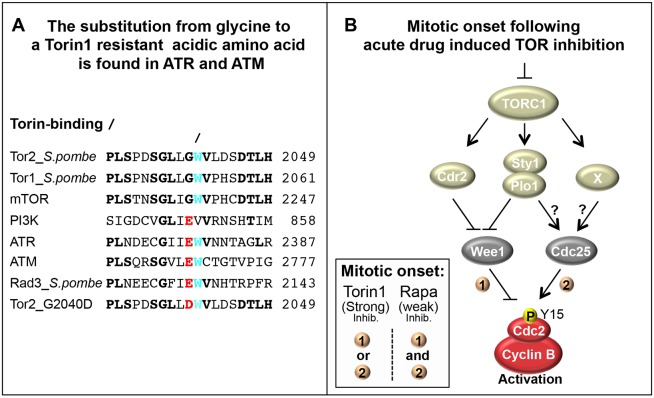
The target of rapamycin (TOR) kinase regulates cell growth and division. Rapamycin only inhibits a subset of TOR activities. Here we show that in contrast to the mild impact of rapamycin on cell division, blocking the catalytic site of TOR with the Torin1 inhibitor completely arrests growth without cell death in Schizosaccharomyces pombe. A mutation of the Tor2 glycine residue (G2040D) that lies adjacent to the key Torin-interacting tryptophan provides Torin1 resistance, confirming the specificity of Torin1 for TOR. Using this mutation, we show that Torin1 advanced mitotic onset before inducing growth arrest. In contrast to TOR inhibition with rapamycin, regulation by either Wee1 or Cdc25 was sufficient for this Torin1-induced advanced mitosis. Torin1 promoted a Polo and Cdr2 kinase-controlled drop in Wee1 levels. Experiments in human cell lines recapitulated these yeast observations: mammalian TOR (mTOR) was inhibited by Torin1, Wee1 levels declined and mitotic commitment was advanced in HeLa cells. Thus, the regulation of the mitotic inhibitor Wee1 by TOR signalling is a conserved mechanism that helps to couple cell cycle and growth controls.

Keywords: HeLa; S. pombe; TOR; Torin1; Wee1.


Figures

Fig. 1.
Fig. 1.
Growth of S. pombe is inhibited without cell death or G1 arrest following inhibition of TOR signalling by Torin1. (A) Wild-type cells grown on EMMG plates containing 25 µM Torin1, 300 ng/ml rapamycin or solvent. MeOH, methanol. (B-F) Liquid cultures were treated with 25 µM Torin1 or DMSO. (B) Cell number was measured and proliferation relative to vehicle calculated after 24 hours (C). (D) 500 cells were spread on YES plates and colony-forming units counted and shown relative to vehicle-treated cultures. (E) DNA content was analysed by flow cytometry. (F) Cell size was determined by forward-scatter flow cytometry.
Fig. 2.
Fig. 2.
Torin1 inhibits both TORC1 and TORC2 in S. pombe. (A) Mating efficiency following drug treatment. Cells of opposite mating type were mixed 1∶1 and incubated on SPA plates as indicated (B-D) Wild-type (B,D) and maf1–pk cells (C) were treated with 25 µM Torin1, 300 ng/ml rapamycin or solvent for 30 minutes. Samples were harvested and analysed by western blot using the indicated antibodies. Maf1 phosphorylation is TORC1 specific, Gad8.S546 phosphorylation is TORC2 specific and Rsp6 phosphorylation is regulated by both TORC1 and TORC2.
Fig. 3.
Fig. 3.
A mutation in the ATP-binding pocket of Tor2 provides resistance to Torin1. (A,B) The indicated strains were grown on EMMG plates containing 25 µM Torin1. (B) 2∶2 segregation of Torin1-resistance. Four tetrads were replicated onto YES and YES + Torin1 plates, to the right a diagram illustrates the genotype of the four spores (C) Alignment of TOR kinases; conserved residues are highlighted in bold and residues forming the ATP-binding site are indicated by /. Glycine correspending to tor2.G2040 is highlighted in red. (D) Expression of tor2.G2040D provides resistance to Torin1. (E,F) Cells were treated as in Fig. 1B,C, cell number was counted (E) and proliferation relative to vehicle calculated after 24 hours (F).
Fig. 4.
Fig. 4.
The tor2.G2040D mutation alters the dephosphorylation of TORC1 substrates following Torin1 treatment. (A) Cell length at division of indicated strains (n = 200). After 2.5 hours of Torin1 treatment, 10% of wt cells divide (see Fig. 5A). (B-D) Western blot using the indicated antibodies. Cells were treated as in Fig. 2. (C) Cells were treated with 25 µM Torin1 for 10 minutes. A non-specific band is indicated by an asterisk (*). (D) Cells were treated with 750 nM Torin1 for 10 minutes.
Fig. 5.
Fig. 5.
Torin1 induces cells to advance into mitosis. (A-D) Cells of the indicated strain were treated with Torin1, rapamycin or DMSO for the indicated times and the percentages of dividing cells (A,B,D) or mitotic cells in anaphase (C) were calculated. Graphs are representative of at least two independent experiments.
Fig. 6.
Fig. 6.
Torin1 induces a Plo1- and Cdr2-controlled decline in Wee1 levels. (A,B,C,E) Cells were treated with Torin1, cycloheximide (CHX), rapamycin or DMSO for indicated times. (A,B) Western blot of Cdc25 or Wee1. (D) Inhibition of TORC1 by Torin1 in wild-type cells traps the Cdk1–cyclin-B complex in its active dephosphorylated form as Wee1 levels are reduced and Cdc25 is modified. (C,E) Western blots of Wee1 levels and quantification of Wee1 levels from 3 individual experiements. Torin1-treated wt cells are shown twice for comparison.
Fig. 7.
Fig. 7.
mTORC1 inhibition advances mitosis, as Wee1 is lost. (A) HeLa cells were treated with 250 nM Torin1 and samples harvested at the indicated time points and analysed by western blot using the indicated antibodies. (B) A375 cells were treated with 250 nM Torin1 and analysed by western blot. (C) Cycloheximide (CHX) treatment of HeLa cells. (D) Quantification of A and C. (E) HeLa cells were treated with 250 nM Torin1 and DNA content was analysed by flow cytometry. (F) HeLa Kyoto cyclin-B1–Venus−/+ mRuby–PCNA−/+ H3.3–CFP cells were treated with 250 nM Torin1 or solvent (DMSO). Cell cycle progression was analysed by time-lapse microscopy using mRuby–PCNA marker. G2 length in individual cells was measured from the time point when the PCNA foci form. Red lines are mean values of four independent experiments; red dots represent cells that were in G2 phase until the end of experiment.
Fig. 8.
Fig. 8.
The convergence of multiple pathways to control Cdc2–cyclin-B activity. (A) Alignment of TOR and TOR-related kinases. Conserved residues are highlighted in bold. The key Torin-interacting tryptophan is shown in cyan. The Torin1 resistant tor2-G2040D is shown in red. (B) A model suggesting that when Torin1 inhibits TORC1, Wee1 levels decline. This traps Cdc2–cyclin-B in its active conformation, driving entry into mitosis at a reduced cell size. The presence of molecule X is implied by advanced mitosis in torin1-treated plo1.S402A cdr2::ura4+ double mutants. Insert: in contrast to rapamycin, regulation of either Wee1 (1) or Cdc25 (2) is sufficient to advance mitotic onset following the strong Torin1-induced TOR inhibition.

References

    1. Alvarez B., Moreno S. (2006). Fission yeast Tor2 promotes cell growth and represses cell differentiation. J. Cell Sci. 119, 4475–4485 10.1242/jcs.03241 - DOI - PubMed
    1. Bähler J., Wu J. Q., Longtine M. S., Shah N. G., McKenzie A., 3rd, Steever A. B., Wach A., Philippsen P., Pringle J. R. (1998). Heterologous modules for efficient and versatile PCR-based gene targeting in Schizosaccharomyces pombe. Yeast 14, 943–951 10.1002/(SICI)1097-0061(199807)14:10<943::AID-YEA292>3.0.CO;2-Y - DOI - PubMed
    1. Bimbó A., Jia Y., Poh S. L., Karuturi R. K., den Elzen N., Peng X., Zheng L., O'Connell M., Liu E. T., Balasubramanian M. K. et al. (2005). Systematic deletion analysis of fission yeast protein kinases. Eukaryot. Cell 4, 799–813 10.1128/EC.4.4.799-813.2005 - DOI - PMC - PubMed
    1. Caspari T., Dahlen M., Kanter-Smoler G., Lindsay H. D., Hofmann K., Papadimitriou K., Sunnerhagen P., Carr A. M. (2000). Characterization of Schizosaccharomyces pombe Hus1: a PCNA-related protein that associates with Rad1 and Rad9. Mol. Cell. Biol. 20, 1254–1262 10.1128/MCB.20.4.1254-1262.2000 - DOI - PMC - PubMed
    1. Costello G., Rodgers L., Beach D. (1986). Fission yeast enters the stationary phase g0 state from either mitotic g1 or g2. Curr. Genet. 11, 119–125 10.1007/BF00378203 - DOI

Publication types

MeSH terms

Substances